
DotNet Performance With HSN
The most comprehensive .NET monitoring dashboard with OpenTelemetry, including all necessary configuration for the application. This dashboard includes monitoring for Inbound Requests, Outbound Requests, Memory, GC, CPU, SQL, EF Core, ThreadPool, JIT, Exceptions, and Lock Contentions. Author: @hasanxdev in social media Mail: hasan.arab.borzo@gmail.com
📈 .NET Application Performance Dashboard (Performance With HSN)
This dashboard is a comprehensive monitoring tool designed to track the performance, health, and network behavior of applications developed on the .NET platform and related frameworks like ASP.NET Core and EF Core.
The primary goal of this dashboard is to provide deep insight into key performance indicators (KPIs) for both the server-side (Kestrel) and client-side (HttpClient) to quickly diagnose performance bottlenecks, network errors, and resource management issues.
👤 Author and Contact Information
GitHub: https://github.com/hasanxdev Telegram: https://t.me/hasanxdev YouTube: https://www.youtube.com/@hasanxdev Mail: hasan.arab.borzo@gmail.com
⚙️ Prerequisites and Data Sources
This dashboard is designed to work with monitoring data collected by Prometheus from .NET applications that publish metrics via OpenTelemetry Metrics or similar tools (like ASP.NET Core Metrics).
- Data Source: Prometheus (Configured as
grafanacloud-promin the JSON configuration). - Filterable Variables:
environment: To filter by deployment environments (e.g.,production,staging).service_name: To select the desired service/application name.
🤑 How to export metrics?
1. install dotnet packages
dotnet add package OpenTelemetry.Exporter.Prometheus.AspNetCore
dotnet add package OpenTelemetry.Extensions.Hosting
dotnet add package OpenTelemetry.Instrumentation.AspNetCore
dotnet add package OpenTelemetry.Instrumentation.ConfluentKafka
dotnet add package OpenTelemetry.Instrumentation.ElasticsearchClient
dotnet add package OpenTelemetry.Instrumentation.EntityFrameworkCore
dotnet add package OpenTelemetry.Instrumentation.EventCounters
dotnet add package OpenTelemetry.Instrumentation.Http
dotnet add package OpenTelemetry.Instrumentation.Process
dotnet add package OpenTelemetry.Instrumentation.Runtime
dotnet add package OpenTelemetry.Instrumentation.SqlClient
WRNING: Some instrumentation may have memory leaks in newer or older versions. I recommend performing this work carefully and step by step.
2. setup in your code:
builder.Services.AddOpenTelemetry()
.ConfigureResource(resourceBuilder =>
{
resourceBuilder
.AddService("YourApplicationName")
.AddAttributes(new Dictionary<string, object>
{
["deployment.environment"] = builder.Environment.EnvironmentName.ToLower()
});
})
.WithMetrics(meterProviderBuilder =>
{
meterProviderBuilder.AddAspNetCoreInstrumentation();
meterProviderBuilder.AddHttpClientInstrumentation();
meterProviderBuilder.AddRuntimeInstrumentation();
meterProviderBuilder.AddSqlClientInstrumentation();
meterProviderBuilder.AddProcessInstrumentation();
string[] diagnosticsMetrics =
[
"System.Net.Http",
"System.Net.NameResolution",
"System.Threading",
"System.Runtime",
"Microsoft.EntityFrameworkCore"
];
meterProviderBuilder.AddMeter(diagnosticsMetrics);
meterProviderBuilder.AddPrometheusExporter(options =>
{
options.ScrapeEndpointPath = "/metrics";
options.ScrapeResponseCacheDurationMilliseconds = 1000;
});
meterProviderBuilder.AddOtlpExporter((cfg, reader) =>
{
cfg.Endpoint = new Uri(builder.Configuration["OTEL_EXPORTER_OTLP_ENDPOINT"]); // Read step 3
cfg.Headers = builder.Configuration["OTEL_EXPORTER_OTLP_HEADERS"]; // Read step 3
cfg.Protocol = OtlpExportProtocol.HttpProtobuf;
reader.PeriodicExportingMetricReaderOptions.ExportIntervalMilliseconds = (int?)TimeSpan.FromSeconds(30).TotalMilliseconds;
});
});
// in app
app.MapPrometheusScrapingEndpoint();
3. Register on https://grafana.net or use metrics in '/metrics' route for private cloud
For registration:
- Going to details your stack https://grafana.com/orgs/[your-stack-grafana-sub domain]/stacks
- Configure OpenTelemetry
- Generate API Token
- from "Environment Variables" copy variables and set to your application
- You should append "/v1/metrics" to the end of the OTEL_EXPORTER_OTLP_ENDPOINT variable.
🔑 Key Monitored Indicators
The dashboard is logically divided into several main sections:
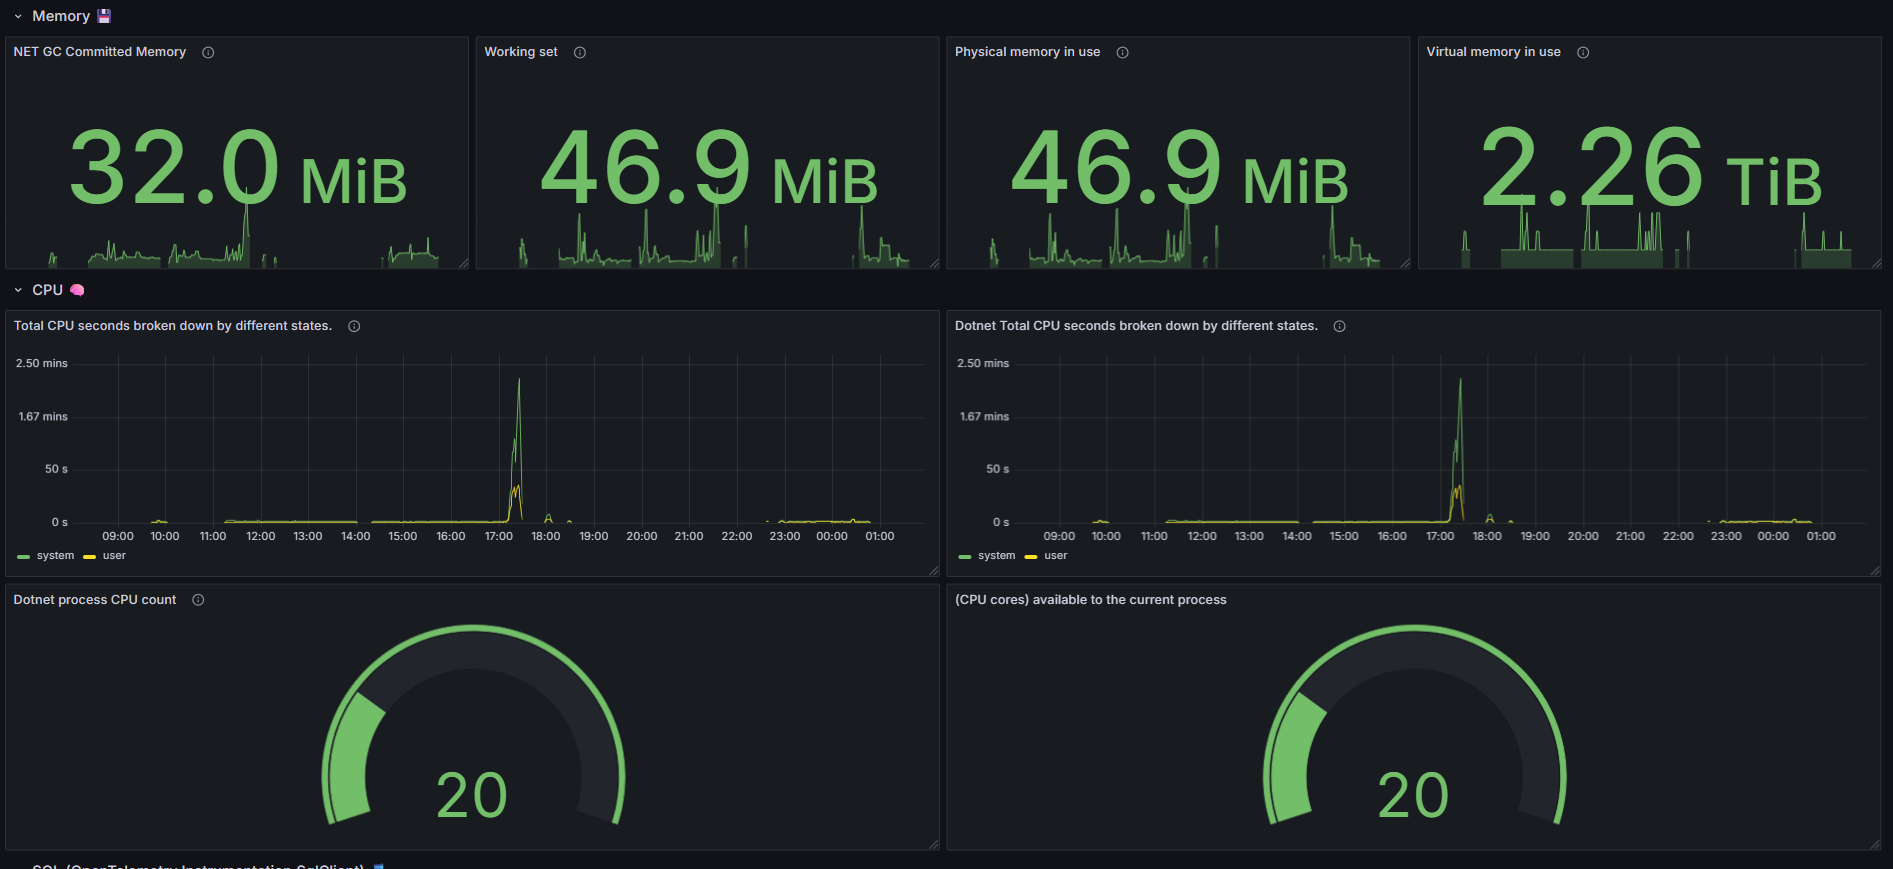
1. Application Health & Resources
This section provides an overview of the application's internal health and resource management at runtime:
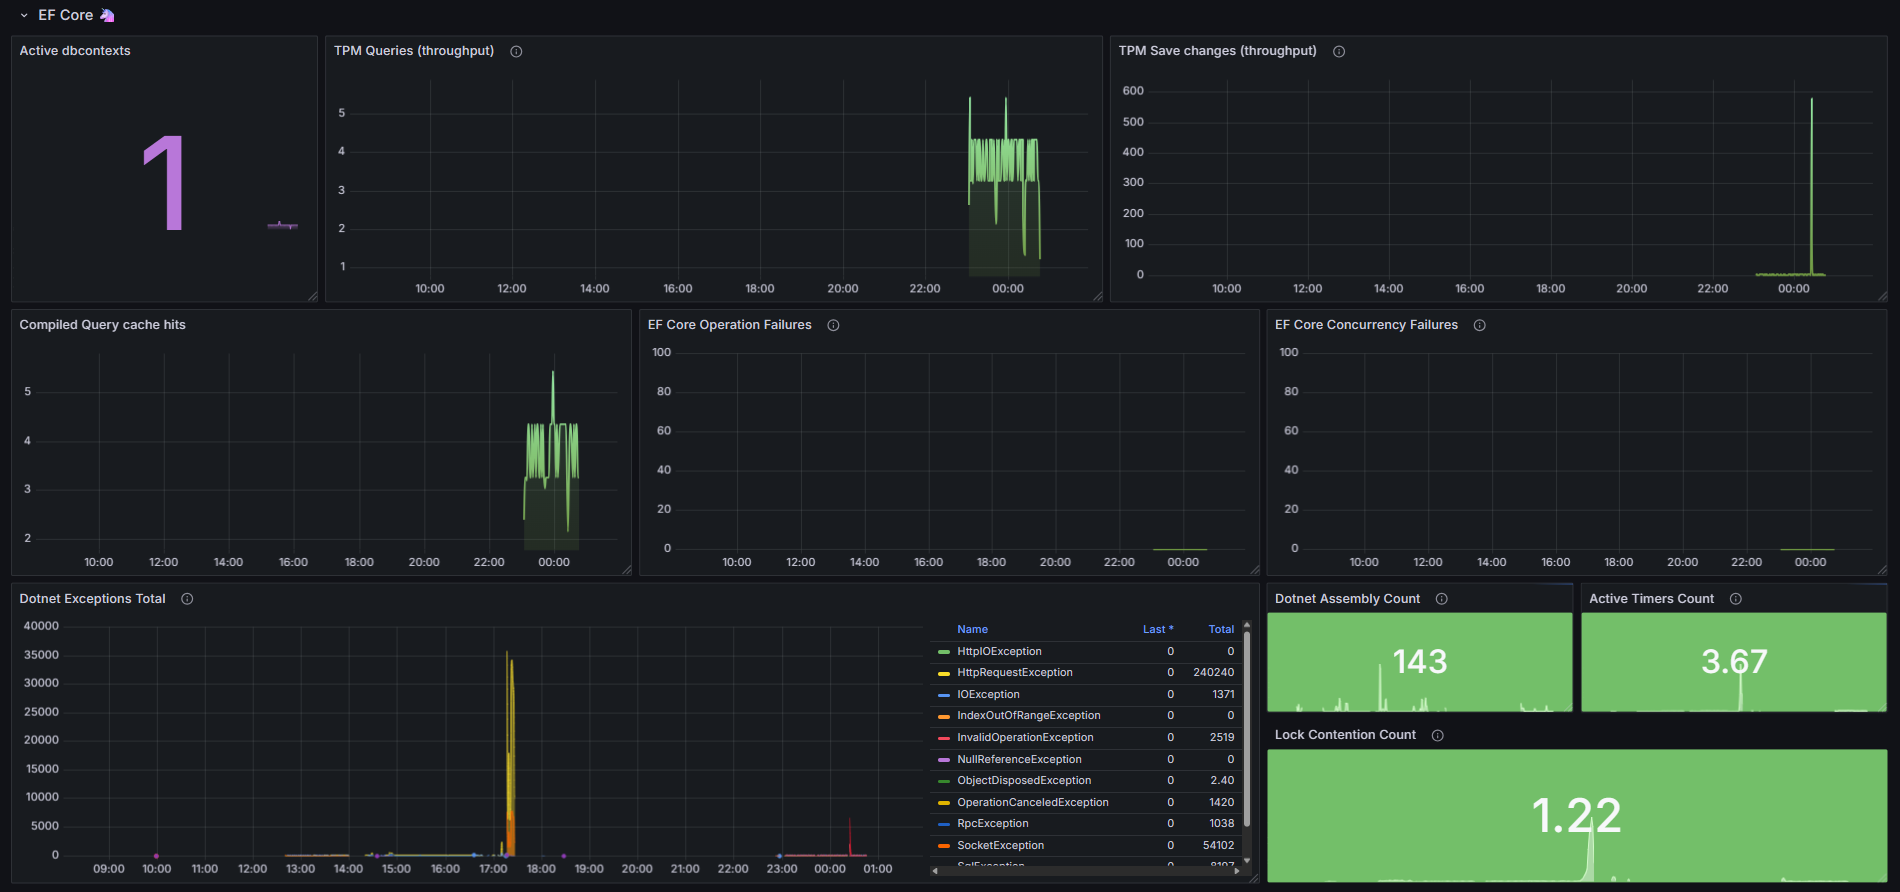
- Dotnet Exceptions Total: The total number of exceptions thrown in managed code.
- Active Timers Count: The number of active timers (important for monitoring potential resource leaks and concurrency).
- Lock Contention Count: The number of times contention occurred while trying to acquire a Monitor Lock (an indicator of concurrency bottlenecks).
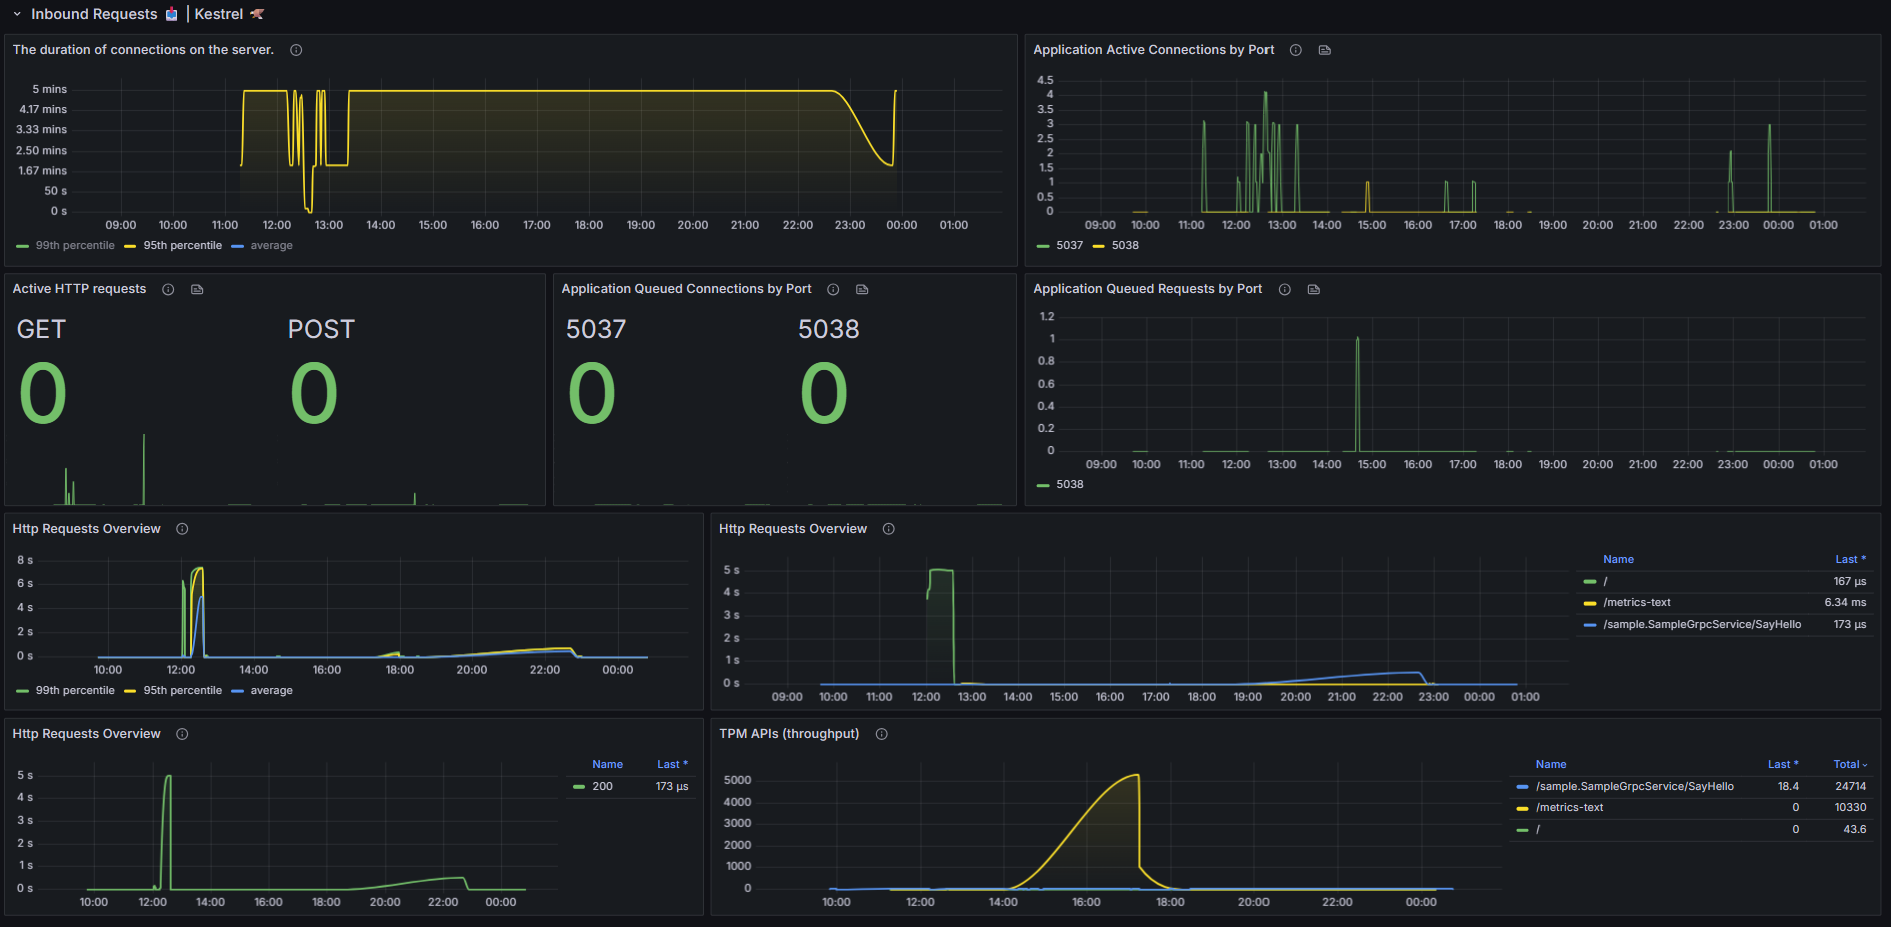
2. Inbound Requests 📥 | Kestrel
This section specifically monitors the performance and processing capability of the Kestrel web server in ASP.NET Core:
- Duration of Connections on the Server: Monitoring the connection lifetime on the server side (P99, P95, and average percentiles).
- Application Active/Queued Connections: The number of active and queued connections based on the port.
- TPM APIs (Throughput): Transactions Per Minute (Requests Per Minute) based on the API route.
- Http Requests Overview: Average request duration based on the route and response status code.
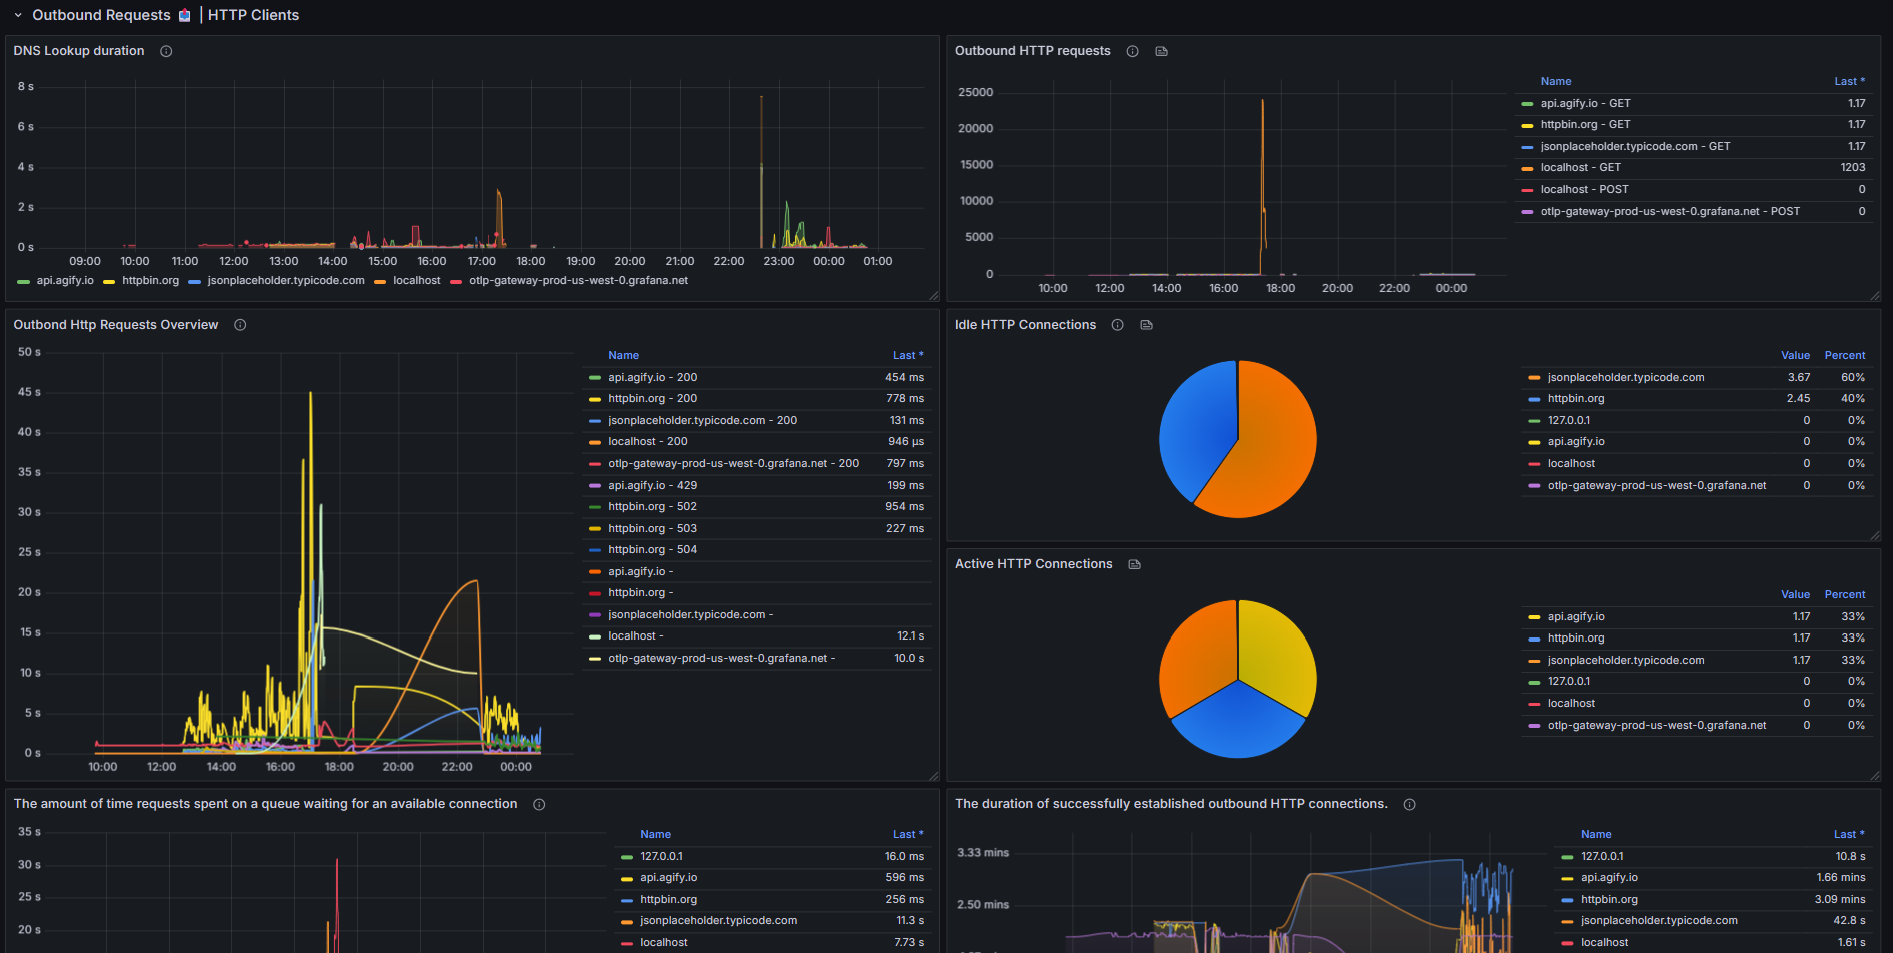
3. Outbound Requests 📤 | HTTP Client
This section specifically monitors HTTP Client activity within the application (calling external APIs) and is crucial for diagnosing external network issues:
http_client_connection_duration_seconds: The duration required to successfully establish the TCP connection and handshake (often includes retries if issues exist).http_client_request_duration_seconds_sum: The total duration of sending the request, server processing, and receiving the response (after the connection is established).- DNS Lookup Duration: The time spent on DNS resolution.
- Idle/Active HTTP Connections: Displaying the status of active and idle connections in the Client's Connection Pool.
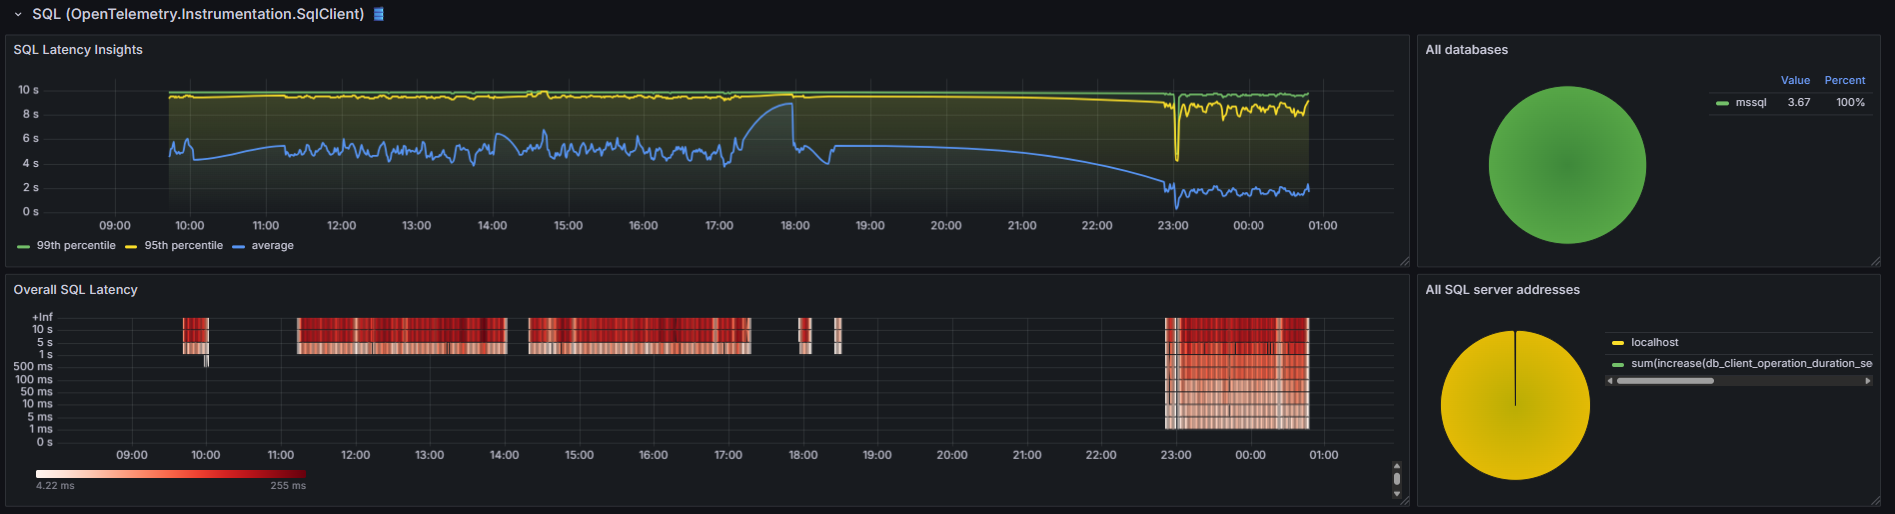
4. Database Performance (EF Core 🦄)
- EF Core Concurrency Failures: Displays concurrency errors in EF Core (such as
DbUpdateConcurrencyException).
⚠️ Connection Troubleshooting Guide
One of the challenges of HTTP Client monitoring is the difference between connection time and request time. If you encounter the following scenario:
Connection Duration Metric ($\approx$ 3 minutes) is very high, while Request Duration ($\approx$ 1 second) is fast.
This indicates that the problem is in the Connection Establishment phase, not the destination server's processing speed. Most likely:
- High Connection Timeout: Your client's Connection Timeout setting is very high (e.g., 3 minutes). If a network or DNS issue occurs, the client waits until the end of this period before succeeding or retrying.
- Failed Connection Pool Attempts: Your Connection Pool had problematic connections that were eventually cleaned up or replaced by the system after a long duration, and these long times were recorded in the maximum or high percentile (P99) metric.
For troubleshooting, closely examine the DNS Lookup and Idle/Active Connections panels.
Data source config
Collector config:
Upload an updated version of an exported dashboard.json file from Grafana
| Revision | Description | Created | |
|---|---|---|---|
| Download |