
Github Actions - pipetrics.com insights
End-to-end GitHub Actions insights with Pipetrics: success rate, billed vs. actual minutes, usage by trigger, queue delays, and workflow reliability across repositories.
Pipetrics.com - GitHub Actions Insights
Overview
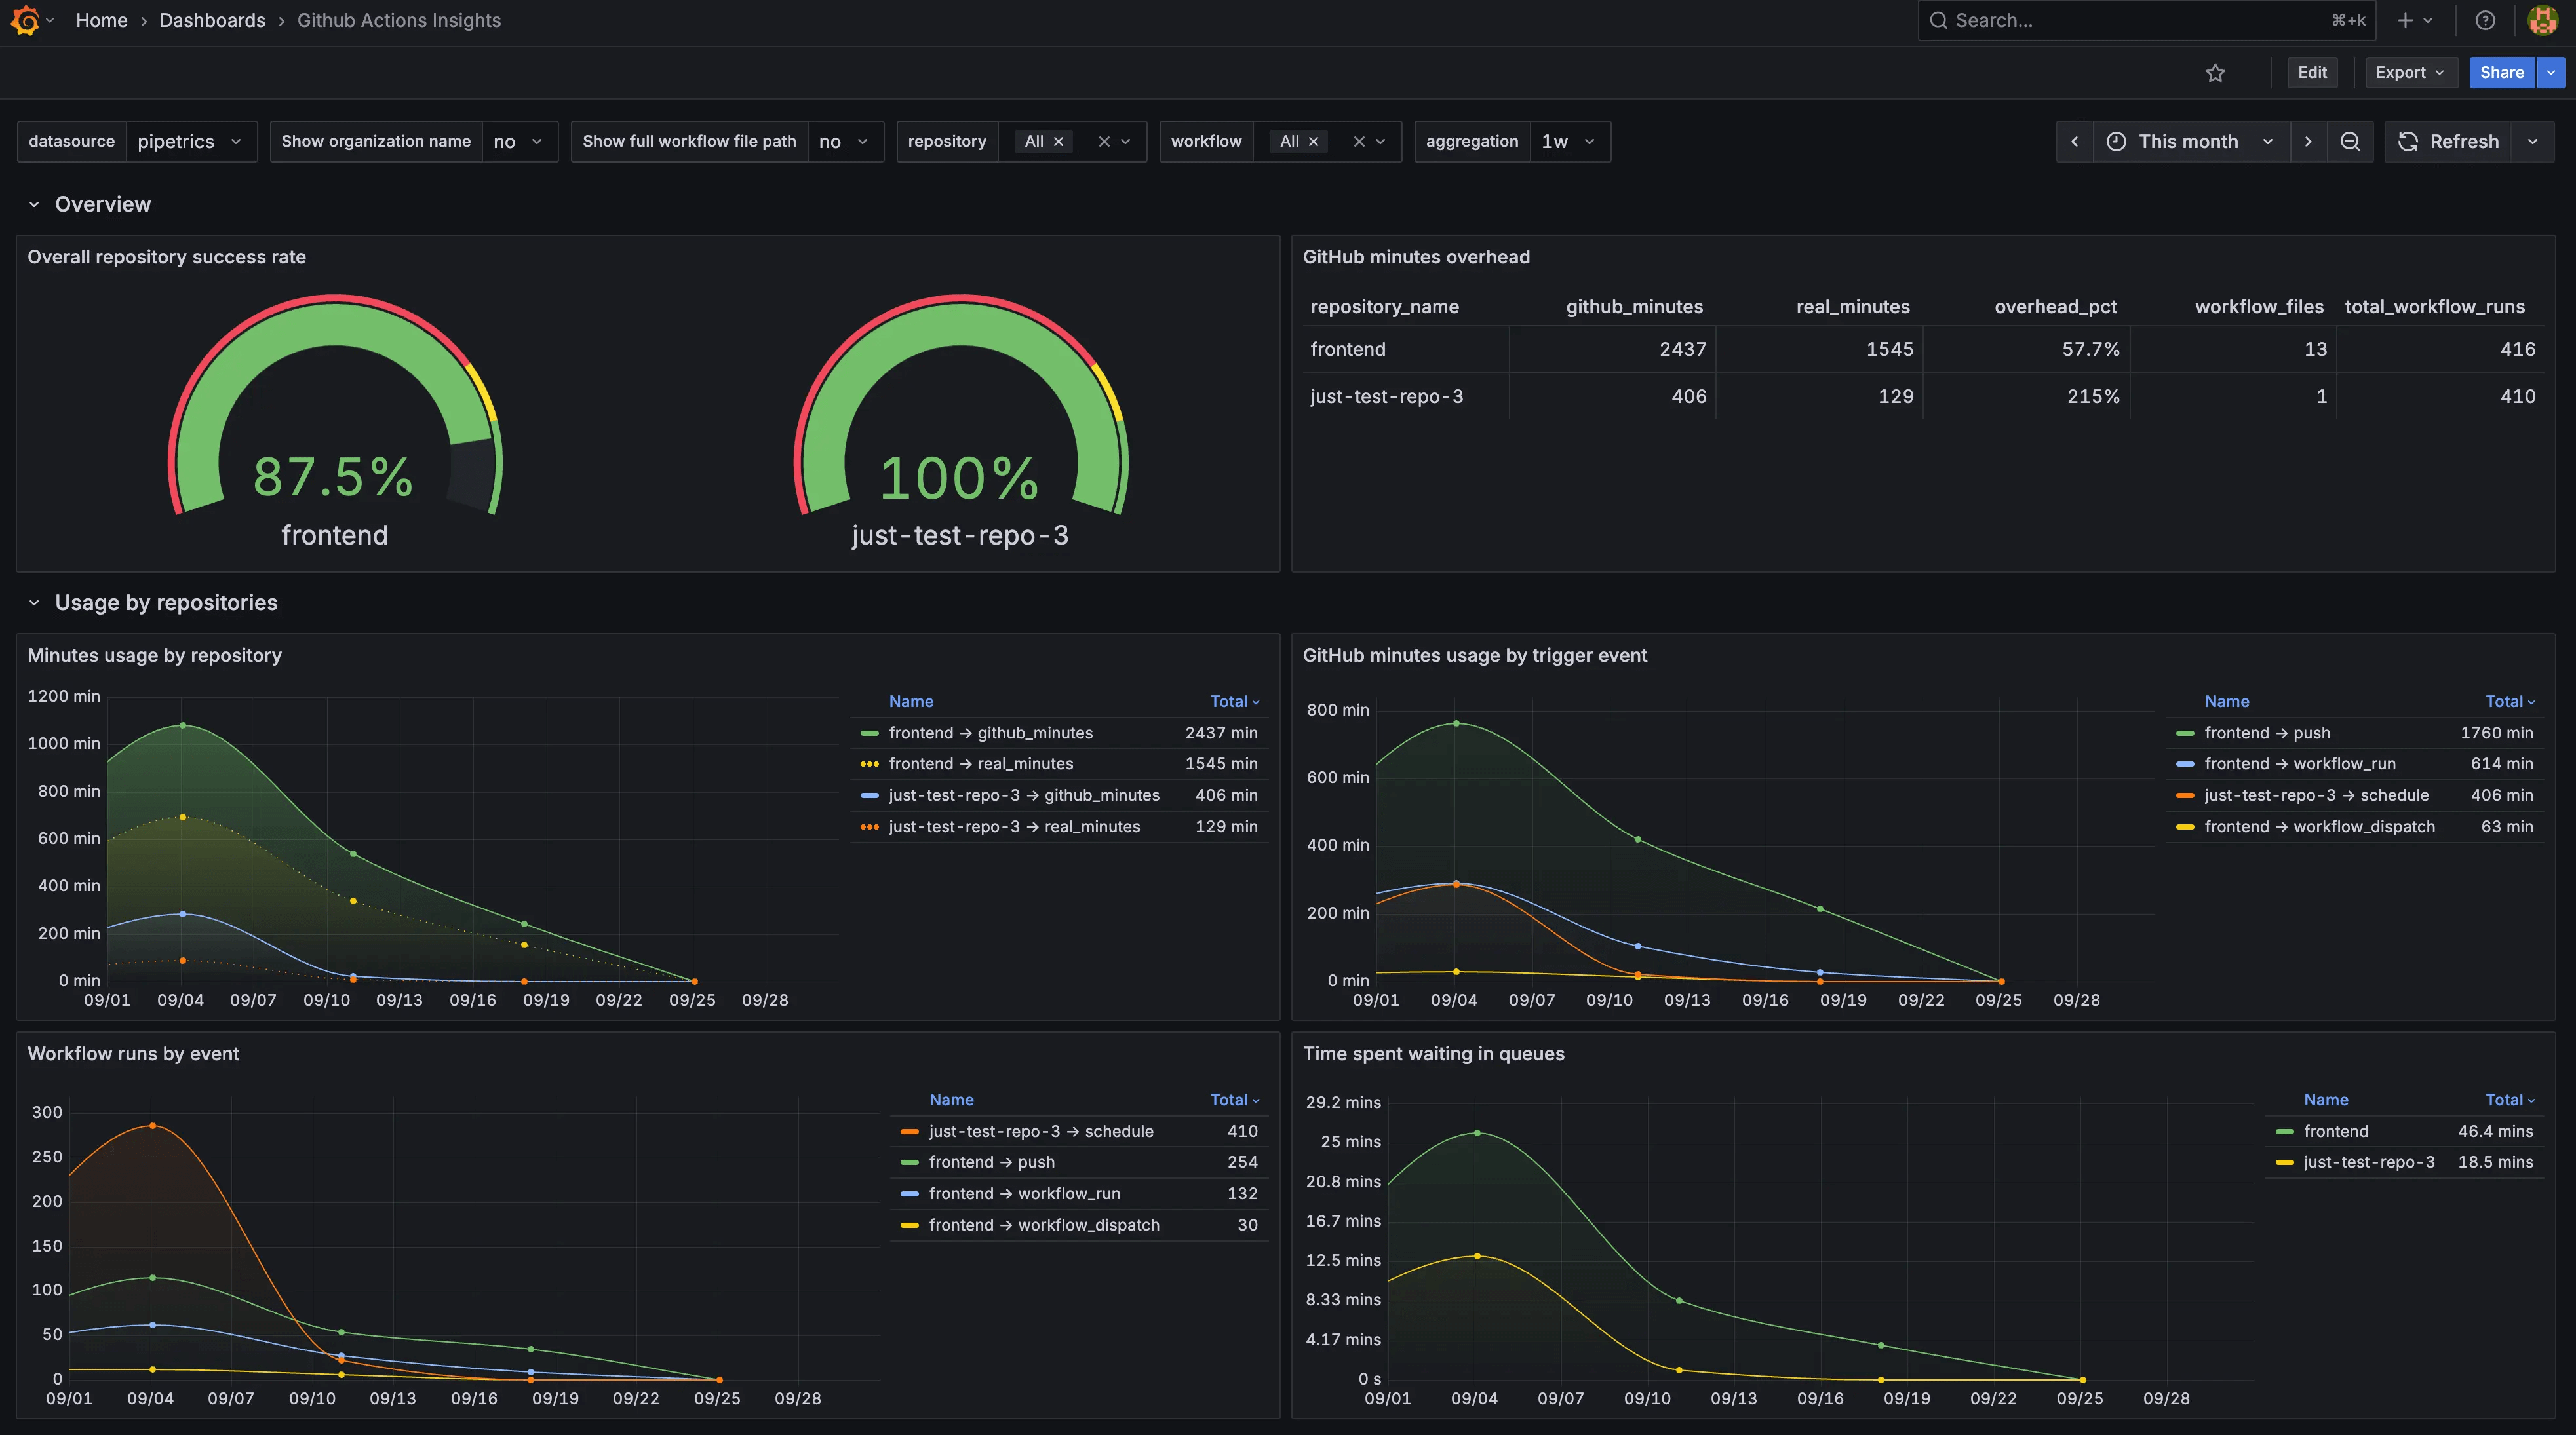
Get a clear view of how your GitHub Actions are performing across repositories. This dashboard surfaces usage, reliability, and queueing metrics directly from Pipetrics, so you can quickly spot inefficiencies, failures, and cost drivers.
What you’ll see
- Repository success rate: Track overall health and stability of your workflows.
- Minutes overhead: Compare billed vs. actual runtime to uncover wasted spend.
- Usage over time: Understand how runtime minutes trend across repositories.
- Breakdown by trigger: See how push, PR, scheduled, and other triggers affect your usage and run counts.
- Queue wait times: Identify when jobs are delayed waiting for available runners.
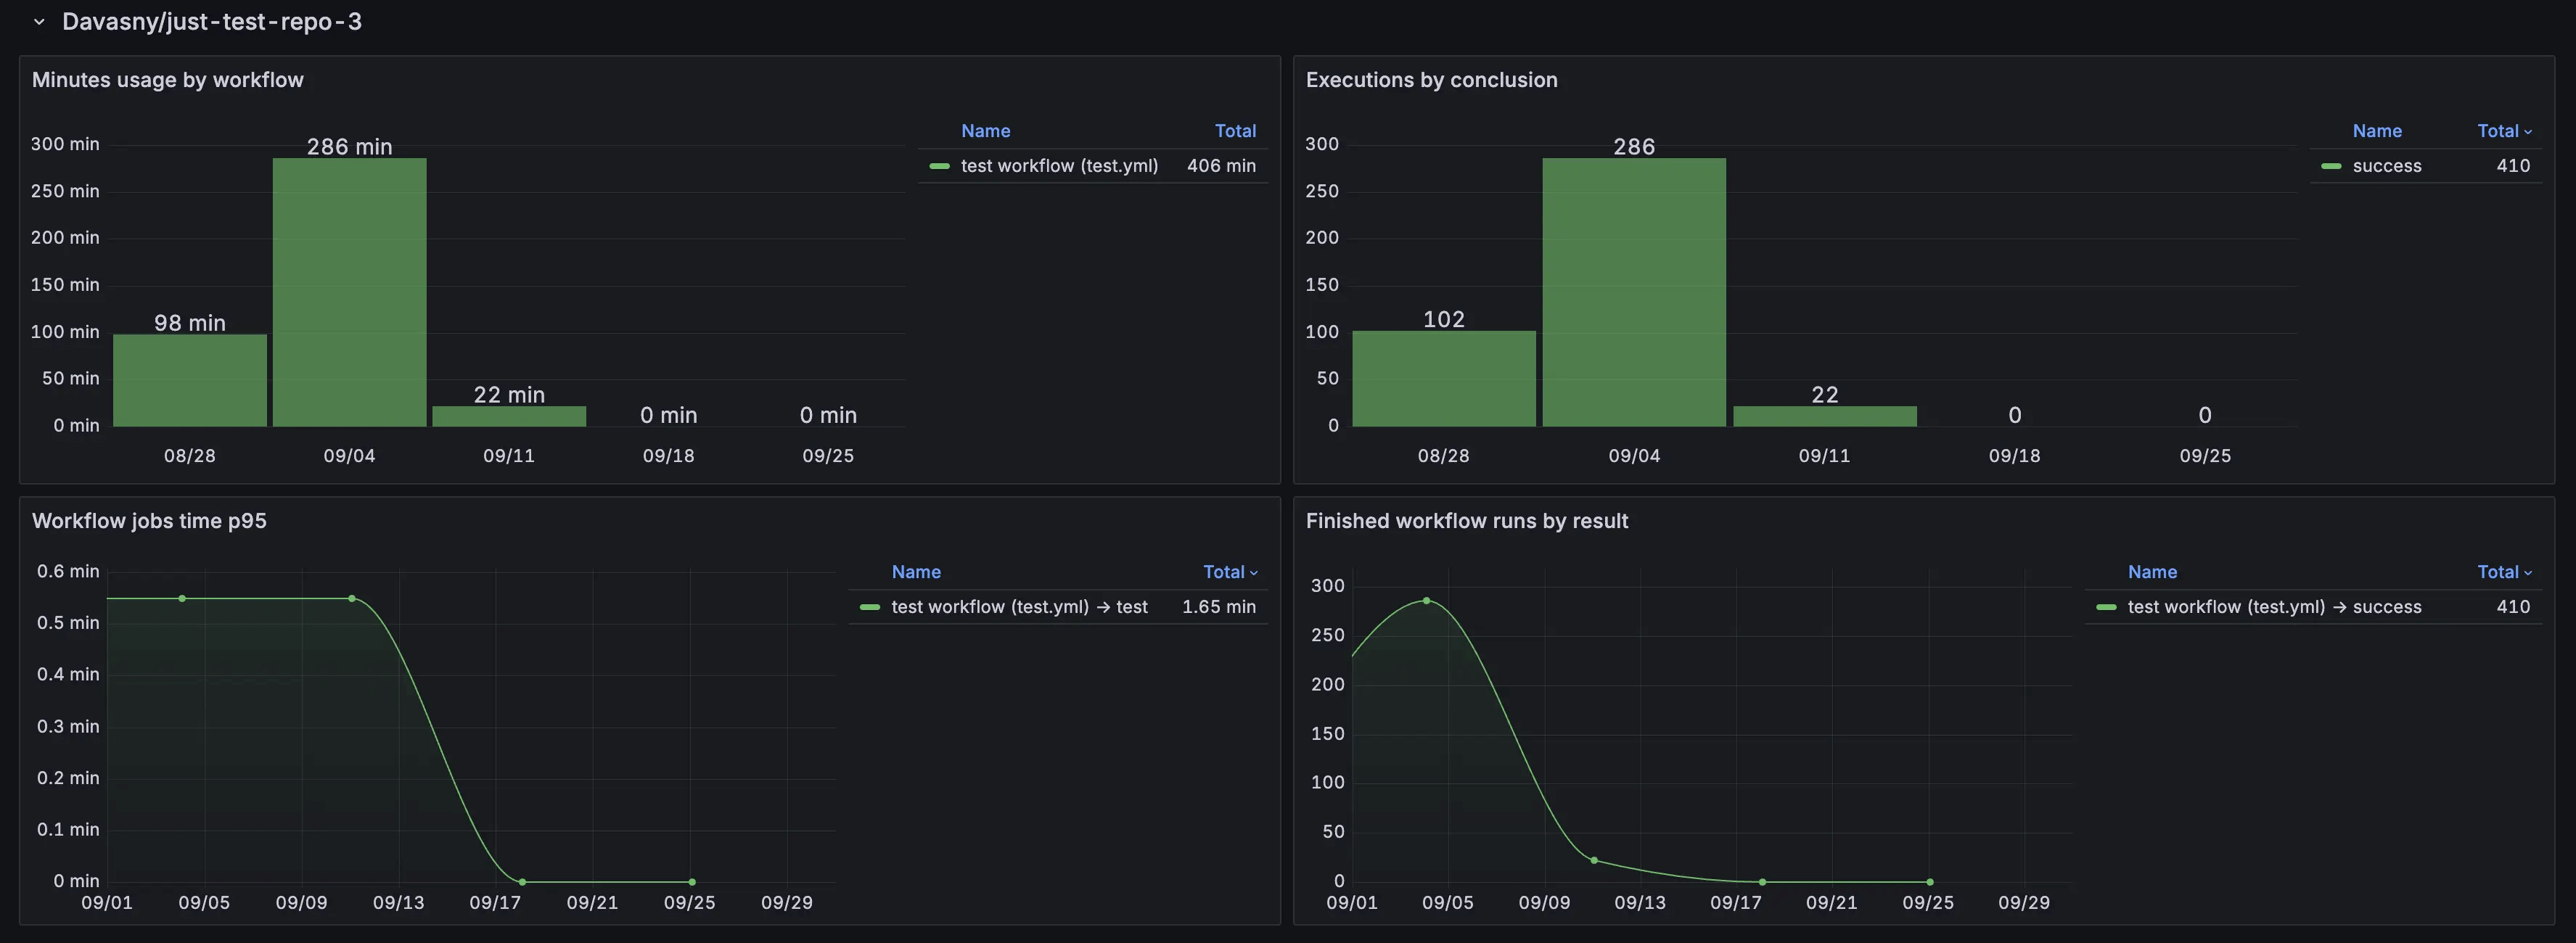
- Per-repository drill-downs:
- Minutes consumed by individual workflows.
- Execution results split by success, failure, skipped, and cancelled.
- High-percentile job durations to highlight bottlenecks.
- Workflow outcomes over time for deeper reliability analysis.
Flexible controls
- Toggle whether to show organization names or just repositories.
- Choose between displaying full workflow file paths or short names.
- Filter by repositories, workflows, and time intervals to focus your view.
Requirements
- active account at https://pipetrics.com/
Data source config
Collector type:
Collector plugins:
Collector config:
Revisions
Upload an updated version of an exported dashboard.json file from Grafana
| Revision | Description | Created | |
|---|---|---|---|
| Download |
GitHub
Easily monitor GitHub, a service for software development and version control using Git, with Grafana Cloud's out-of-the-box monitoring solution.
Learn more