
Agent Framework
Comprehensive monitoring dashboard for AI agent framework performance, tracking operations, token usage, costs, errors, and detailed trace analysis. Monitor agent health, response times, success rates, and resource consumption in real-time.
<h2 id="agent-framework---agent-overview">Agent Framework - Agent Overview</h2>
<p><img
class="lazyload d-inline-block"
data-src="https://github.com/1w2w3y/grafana-dashboards/raw/master/agent-framework/agent-framework-grafana.gif"
alt="Agent Framework Dashboard"/></p>
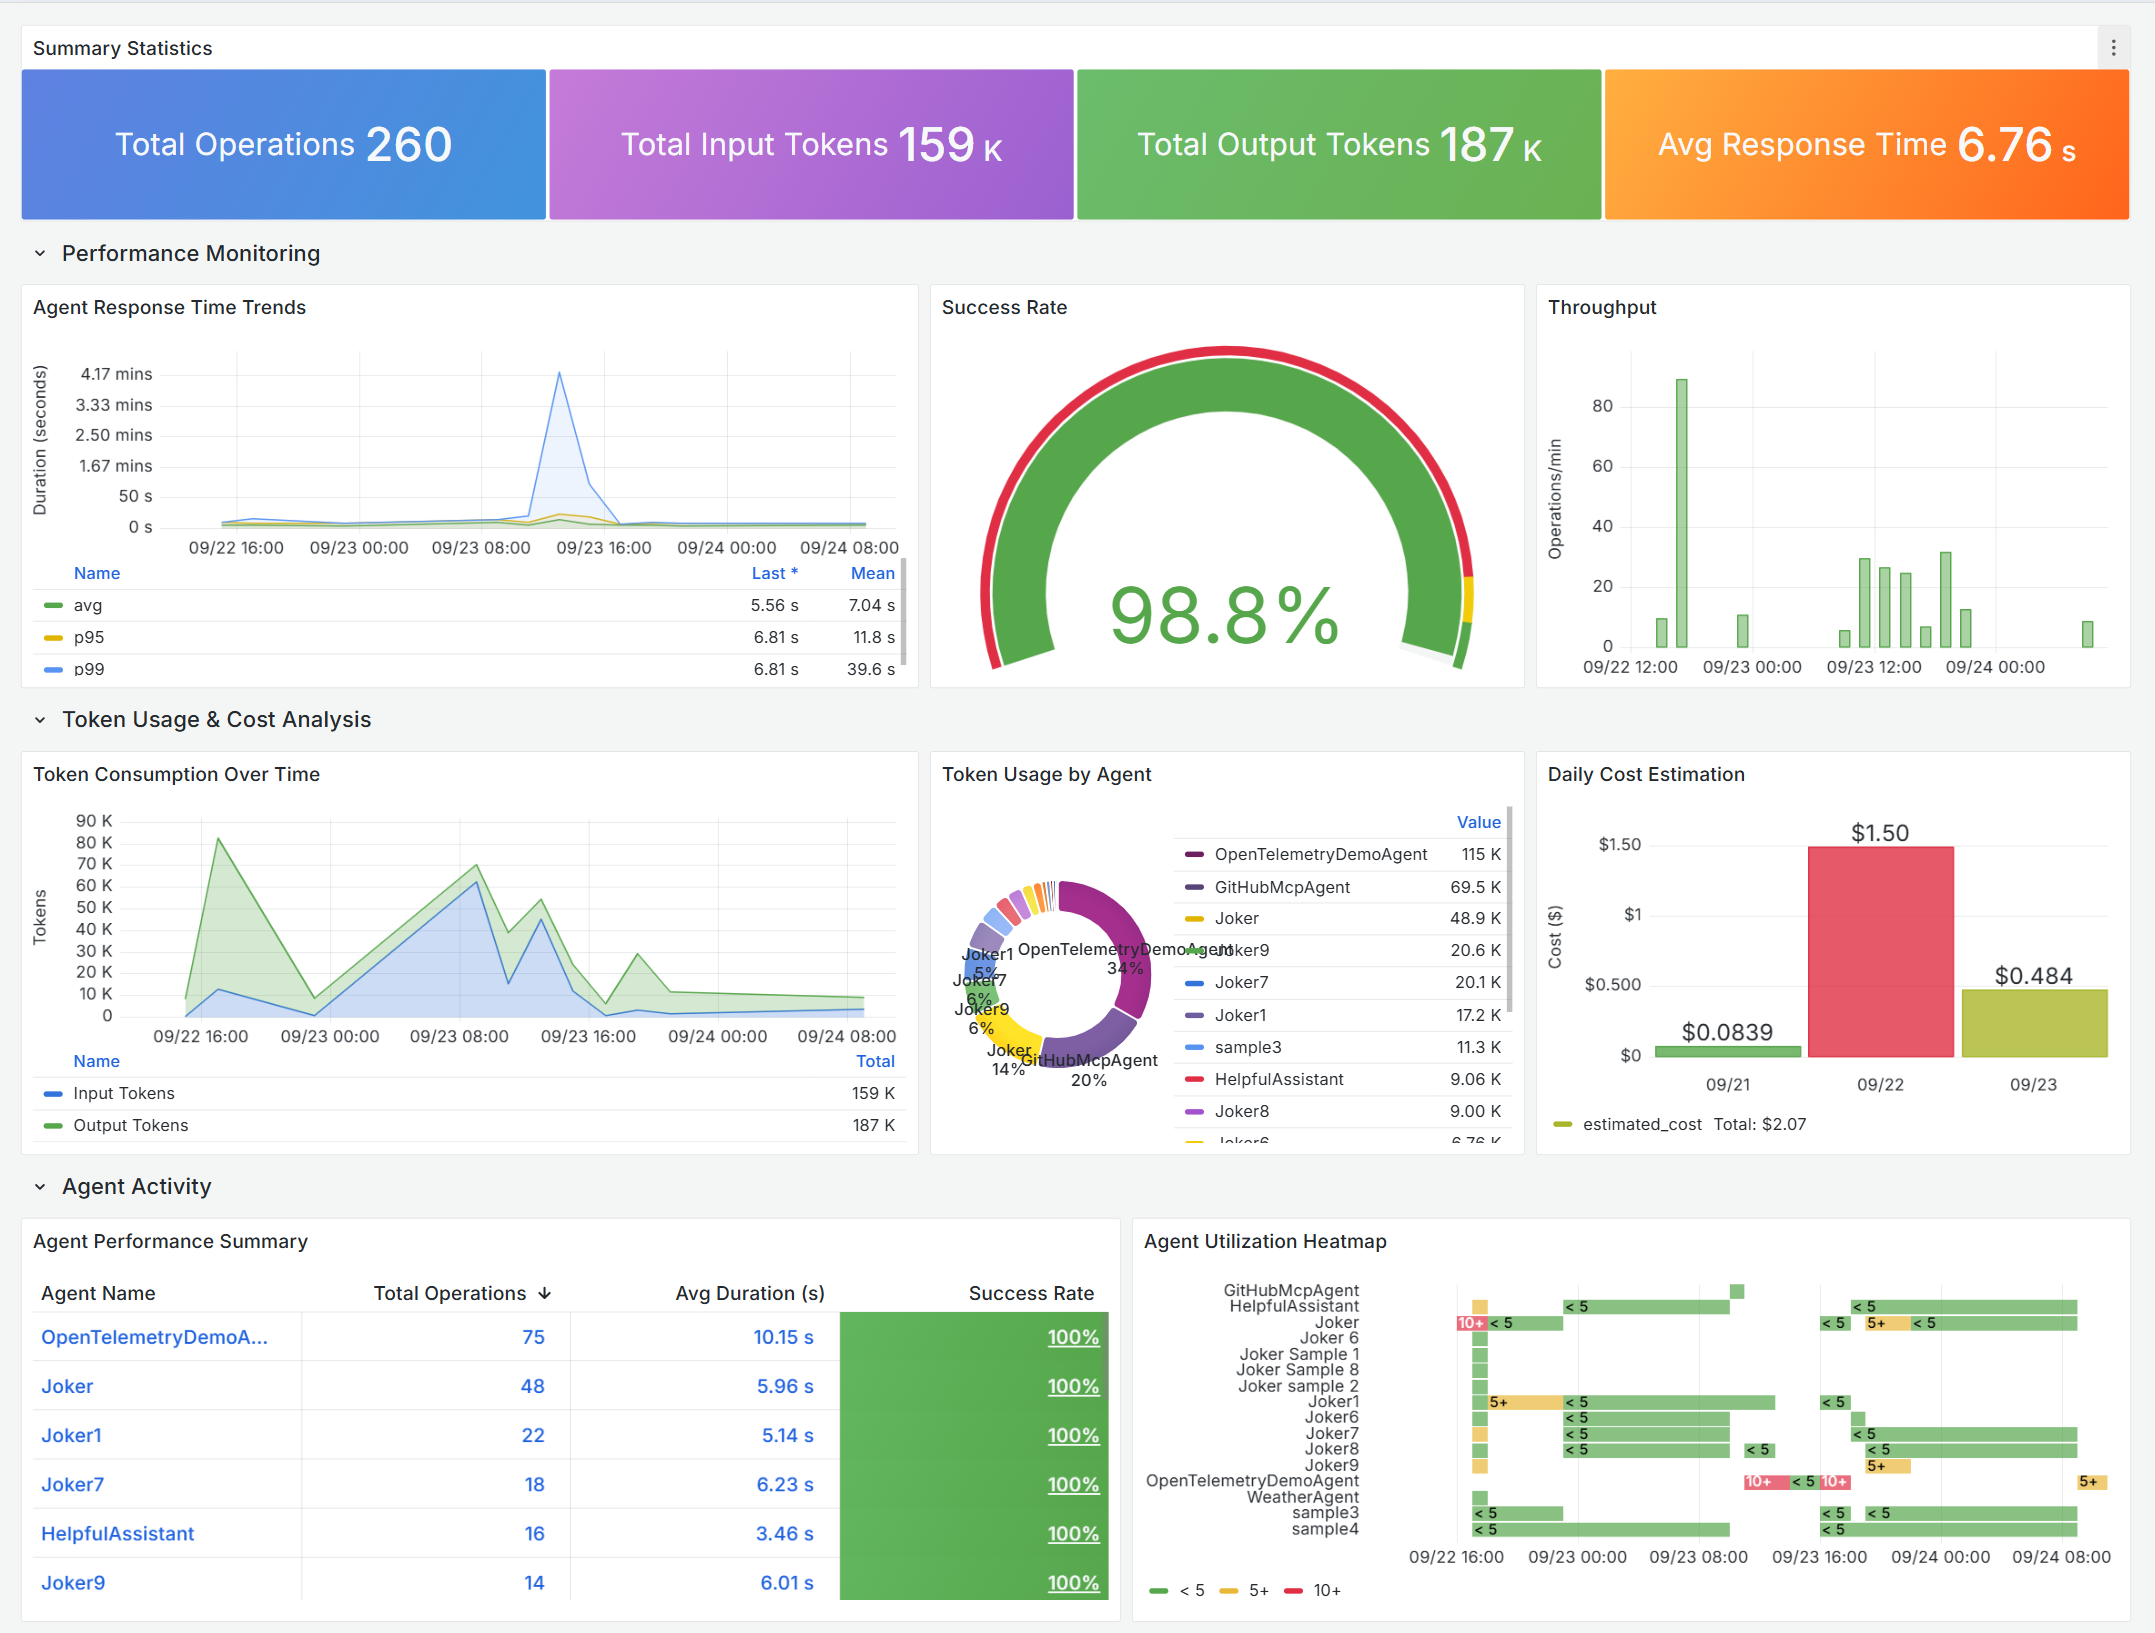
<p>Comprehensive monitoring dashboard for <strong>Microsoft Agent Framework</strong> performance, tracking operations, token usage, costs, errors, and detailed trace analysis. Monitor your AI agents’ health, response times, success rates, and resource consumption in real-time.</p>
<h2 id="-what-is-microsoft-agent-framework">📊 What is Microsoft Agent Framework?</h2>
<p>The <a href="https://github.com/microsoft/agent-framework" target="_blank" rel="noopener noreferrer">Microsoft Agent Framework</a> is an open-source development kit for building AI agents and multi-agent workflows for .NET and Python. It brings together the best of <a href="https://github.com/microsoft/semantic-kernel" target="_blank" rel="noopener noreferrer">Semantic Kernel</a> and <a href="https://github.com/microsoft/autogen" target="_blank" rel="noopener noreferrer">AutoGen</a>, combining their strengths while adding new capabilities for enterprise-grade AI applications.</p>
<h2 id="-why-this-dashboard">🎯 Why This Dashboard?</h2>
<p>As you build AI agents that make autonomous decisions, call external tools, and process user requests, you need visibility into:</p>
<ul>
<li><strong>Performance</strong>: Are your agents responding quickly enough?</li>
<li><strong>Reliability</strong>: What’s your success rate? Where are errors occurring?</li>
<li><strong>Cost</strong>: How much are your AI operations costing in token consumption?</li>
<li><strong>Usage</strong>: Which agents are most active? When are peak usage times?</li>
<li><strong>Debugging</strong>: What’s happening inside failed operations?</li>
</ul>
<p>This dashboard answers all these questions and more—in real-time.</p>
<h2 id="-dashboard-highlights">✨ Dashboard Highlights</h2>
<h3 id="-performance-monitoring">📈 Performance Monitoring</h3>
<ul>
<li><strong>Response Time Trends</strong>: Track average, 95th, and 99th percentile latencies</li>
<li><strong>Success Rate Gauge</strong>: Instant health check with color-coded thresholds</li>
<li><strong>Throughput Analysis</strong>: Monitor operations per minute to identify peak loads</li>
<li><strong>Agent-Level Metrics</strong>: Compare performance across different agents</li>
</ul>
<h3 id="-token-usage--cost-analysis">💰 Token Usage & Cost Analysis</h3>
<ul>
<li><strong>Token Consumption Over Time</strong>: Stacked visualization of input/output tokens</li>
<li><strong>Cost Estimation</strong>: Daily spending estimates based on model pricing</li>
<li><strong>Per-Agent Breakdown</strong>: Identify which agents consume the most resources</li>
<li><strong>Trend Analysis</strong>: Spot usage patterns and optimize accordingly</li>
</ul>
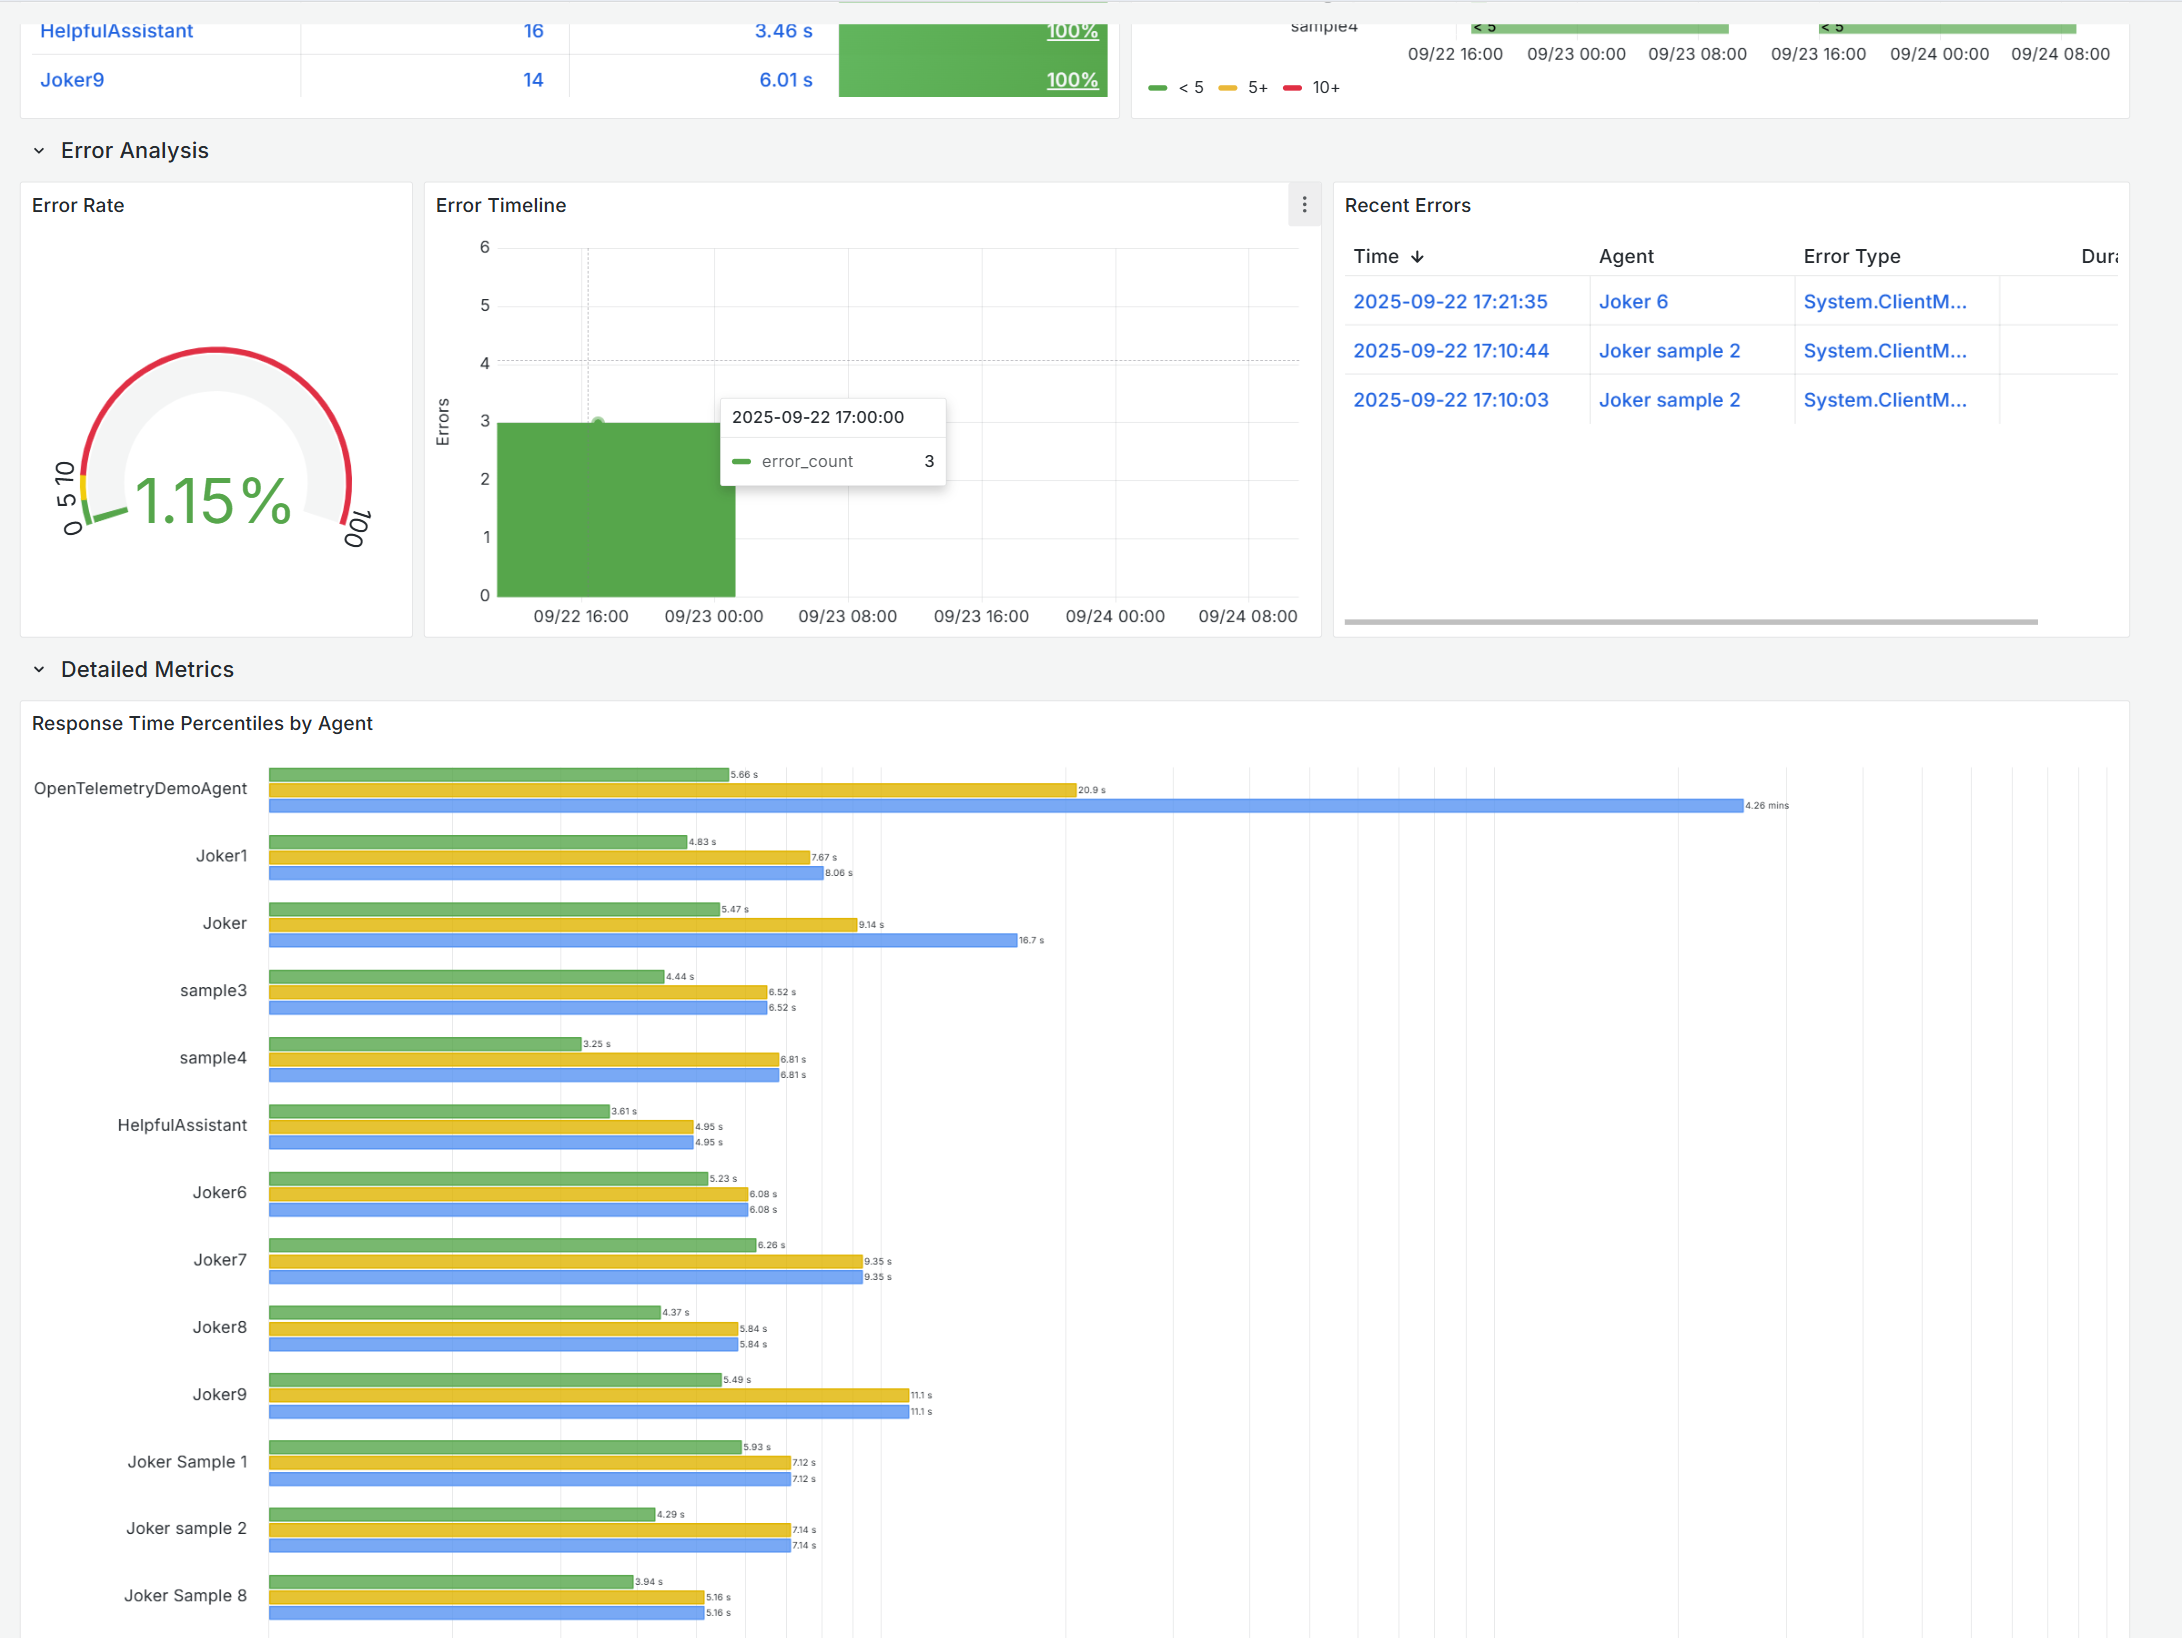
<h3 id="-error-analysis--debugging">🔍 Error Analysis & Debugging</h3>
<ul>
<li><strong>Error Rate Monitoring</strong>: Overall system health at a glance</li>
<li><strong>Error Timeline</strong>: Identify when problems occur</li>
<li><strong>Recent Errors Table</strong>: Quick access to the latest failures</li>
<li><strong>Root Cause Analysis</strong>: Drill down with agent name, error type, and duration</li>
</ul>
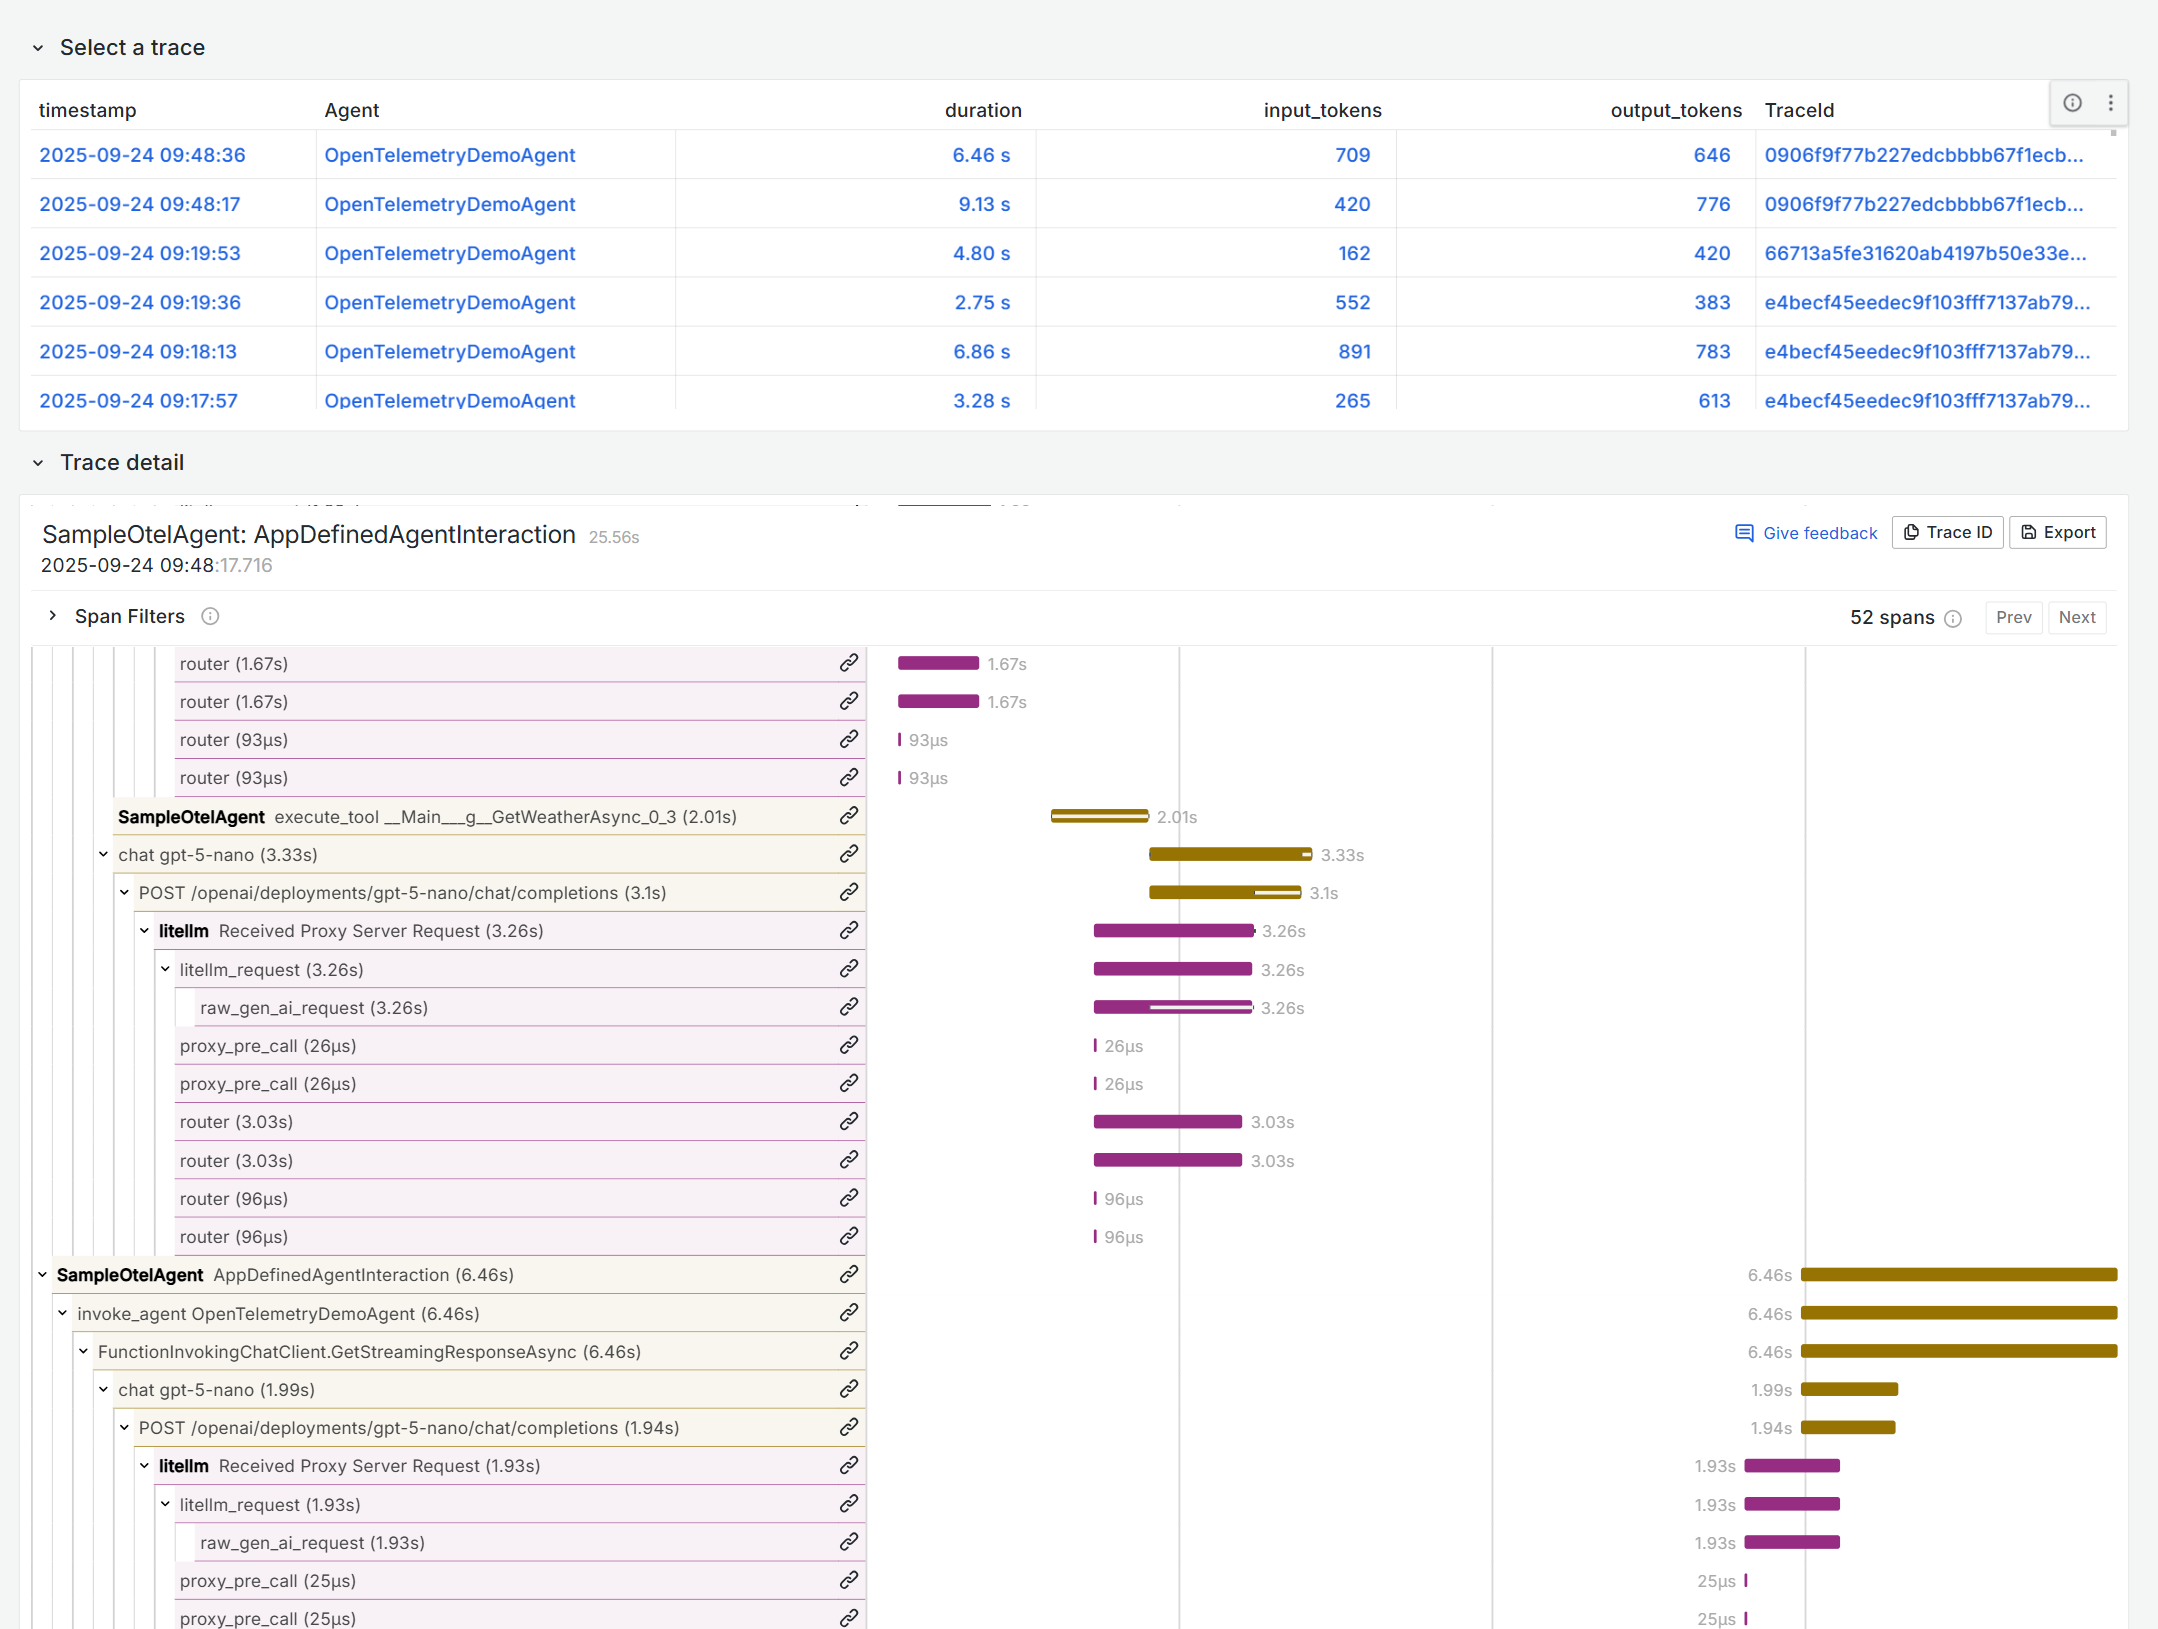
<h3 id="-detailed-trace-analysis">🔬 Detailed Trace Analysis</h3>
<ul>
<li><strong>Interactive Trace Selection</strong>: Click any operation to see full execution details</li>
<li><strong>Trace Visualization</strong>: Complete execution flow with timing and dependencies</li>
<li><strong>Span Analysis</strong>: Understand the hierarchical relationships in your agent operations</li>
<li><strong>Performance Deep-Dive</strong>: Identify bottlenecks in complex agent workflows</li>
</ul>
<h3 id="-agent-activity-insights">📊 Agent Activity Insights</h3>
<ul>
<li><strong>Agent Performance Summary</strong>: Comprehensive table with operations, duration, and success rates</li>
<li><strong>Utilization Heatmap</strong>: Visual representation of agent activity over time</li>
<li><strong>Response Time Percentiles</strong>: Compare latency distribution across agents</li>
</ul>
<h2 id="-customization">🔧 Customization</h2>
<h3 id="adjust-cost-estimation">Adjust Cost Estimation</h3>
<p>The dashboard uses example pricing. Update the cost calculation query to match your model pricing:</p>
<div class="code-snippet "><div class="lang-toolbar">
<span class="lang-toolbar__item lang-toolbar__item-active">kql</span>
<span class="code-clipboard">
<button x-data="app_code_snippet()" x-init="init()" @click="copy()">
<img class="code-clipboard__icon" src="/media/images/icons/icon-copy-small-2.svg" alt="Copy code to clipboard" width="14" height="13">
<span>Copy</span>
</button>
</span>
<div class="lang-toolbar__border"></div>
</div><div class="code-snippet ">
<pre data-expanded="false"><code class="language-kql">// In the "Daily Cost Estimation" panel query
input_cost = input_tokens * 0.00000025, // Your input token rate
output_cost = output_tokens * 0.000002 // Your output token rate</code></pre>
</div>
</div>
<h2 id="-contributing">🤝 Contributing</h2>
<p>Found a bug or have a feature request?</p>
<ul>
<li><a href="https://github.com/1w2w3y/grafana-dashboards/issues" target="_blank" rel="noopener noreferrer">Open an issue</a></li>
<li>Submit a pull request</li>
<li>Share your customizations!</li>
</ul>
<h2 id="-resources">📚 Resources</h2>
<ul>
<li><a href="https://learn.microsoft.com/en-us/agent-framework/overview/agent-framework-overview" target="_blank" rel="noopener noreferrer">Microsoft Agent Framework Documentation</a></li>
<li><a href="https://github.com/microsoft/agent-framework" target="_blank" rel="noopener noreferrer">Agent Framework GitHub Repository</a></li>
<li><a href="https://learn.microsoft.com/en-us/azure/azure-monitor/app/app-insights-overview" target="_blank" rel="noopener noreferrer">Azure Application Insights</a></li>
<li><a href="/docs/">Grafana Documentation</a></li>
</ul>
<hr />
<p><strong>Ready to gain visibility into your AI agents?</strong> Import this dashboard and start monitoring your Agent Framework applications today! 🚀</p>
Data source config
Collector type:
Collector plugins:
Collector config:
Revisions
Upload an updated version of an exported dashboard.json file from Grafana
| Revision | Description | Created | |
|---|---|---|---|
| Download |
Grafana Agent
Easily monitor metrics and logs from a Grafana Agent instance with Grafana Cloud's out-of-the-box monitoring solution.
Learn more