
Atlas MongoDB Dashboard
Atlas MongoDB Dashboard
Overview
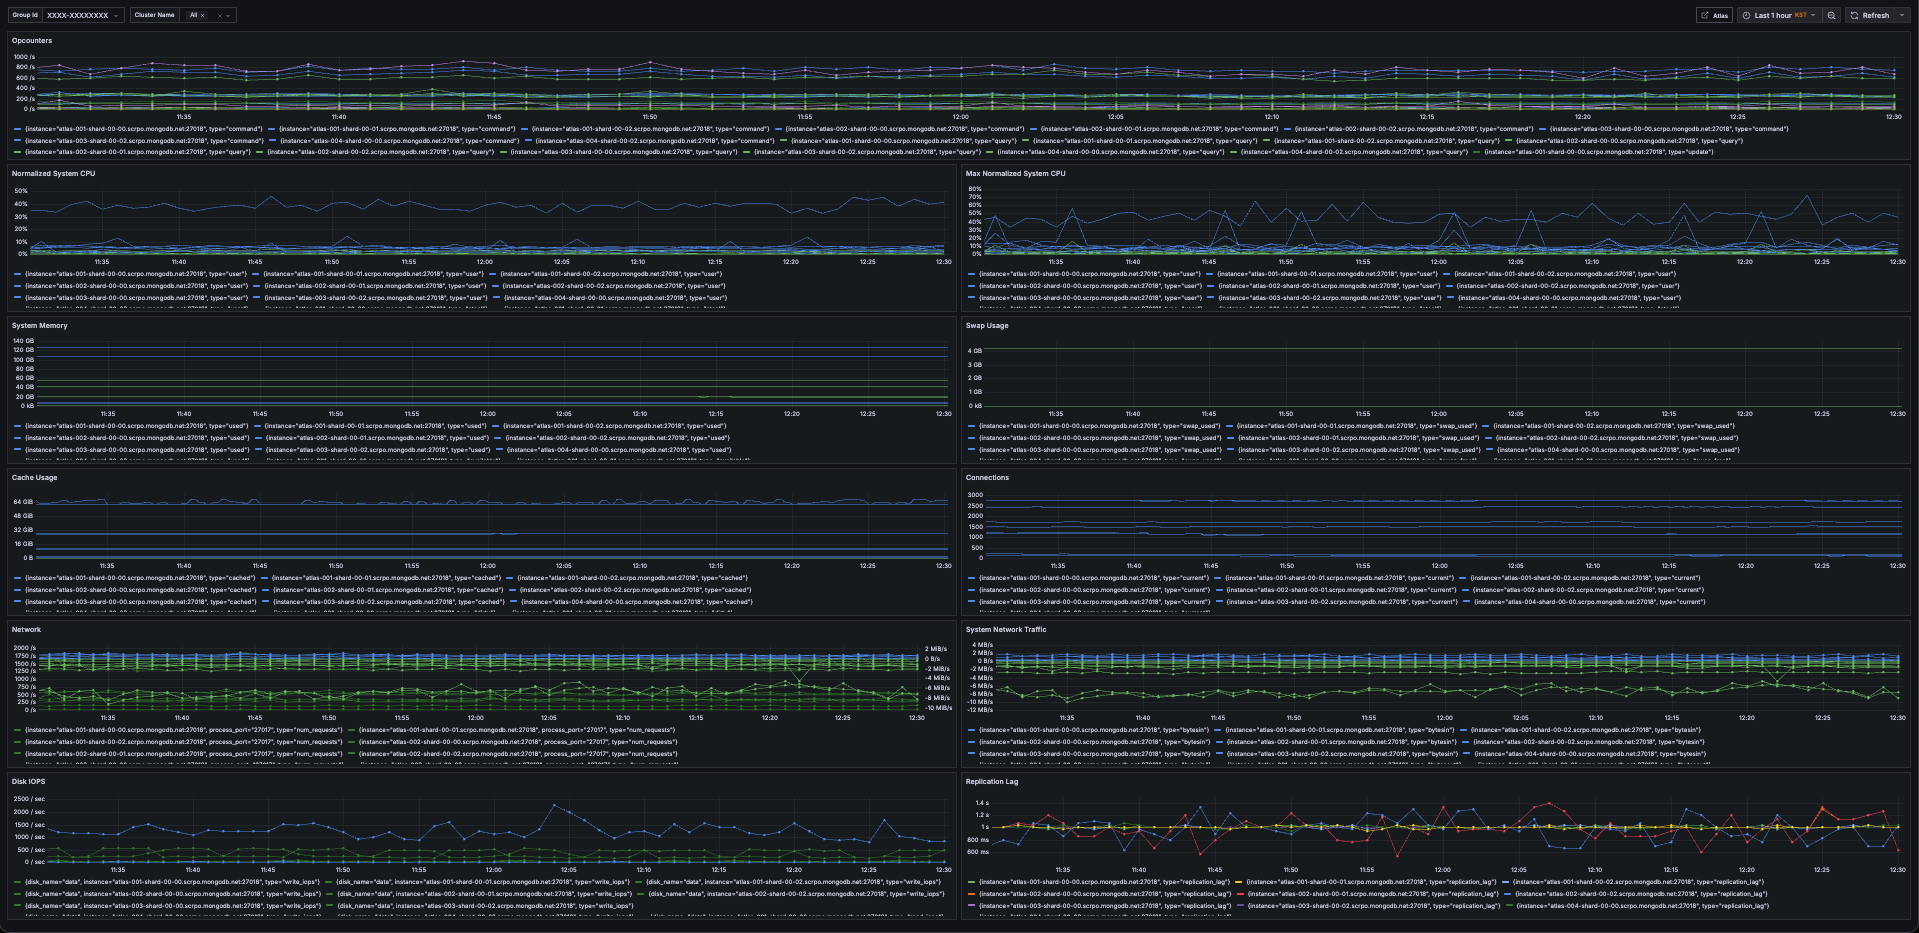
This dashboard integrates MongoDB Atlas metrics into Grafana, enabling cloud-native monitoring of clusters, databases, and collections. It provides insights into performance, replication, and storage utilization directly from Atlas.
Features
Cluster overview: connections, operations per second, replication health
Database metrics: read/write throughput, latency, index usage
Storage: disk utilization, oplog size, backup status
Customizable filters for project and cluster IDs
Requirements
Grafana with MongoDB Atlas data source plugin or Prometheus exporter (such as mongodb_exporter or Atlas API integration)
API key with Project Data Access Read Only role in Atlas
Usage
Configure MongoDB Atlas integration (via plugin or Prometheus).
Import this dashboard JSON into Grafana.
Enter your Atlas project/cluster information in the dashboard variables.
Data source config
Collector config:
Upload an updated version of an exported dashboard.json file from Grafana
| Revision | Description | Created | |
|---|---|---|---|
| Download |
MongoDB
Easily monitor MongoDB, a general purpose, document-based, distributed database, with Grafana Cloud's out-of-the-box monitoring solution.
Learn more