
QuickStat Node.js Metrics
Effortlessly monitor Node.js metrics and export them to Prometheus for visualization in Grafana
Node.js Runtime Monitoring Plugin
The QuickStat Node.js Plugin offers seamless integration with Node.js runtime, allowing effortless monitoring of key runtime metrics. It exports these metrics to Prometheus, enabling visualization in Grafana dashboards for comprehensive Node.js application performance monitoring.
If you are new to QuickStat and its components, feel free to check the official documentation for a detailed breakdown.
Installation
Start by installing the QuickStat core package, the data source used by Grafana and then the Node.js plugin:
npm install @quickstat/core
npm install @quickstat/prometheus
npm install @quickstat/nodejs
Getting Started
If you use docker and want to get started quickly, you can check the following docker-setup, which allows you to skip the setup and directly use the plugin. Once you have setup docker, continue on Step 3.
If your unfamiliar with QuickStat’s plugins, then keep in mind that you can also use other strategies such as (PushGateway) for exposing metrics or even combine your dashboard with other plugins.
If you want to set up Prometheus and Grafana manually, follow the steps below:
1. Setup Prometheus and Grafana
Install Prometheus: Follow the official documentation to install Prometheus on your system.
Install Grafana: Refer to the official documentation for instructions on installing Grafana.
Configure Prometheus Data Source in Grafana: After installing Grafana, configure Prometheus as a data source. Go to Grafana settings, add a new data source, and specify the URL where Prometheus is running.
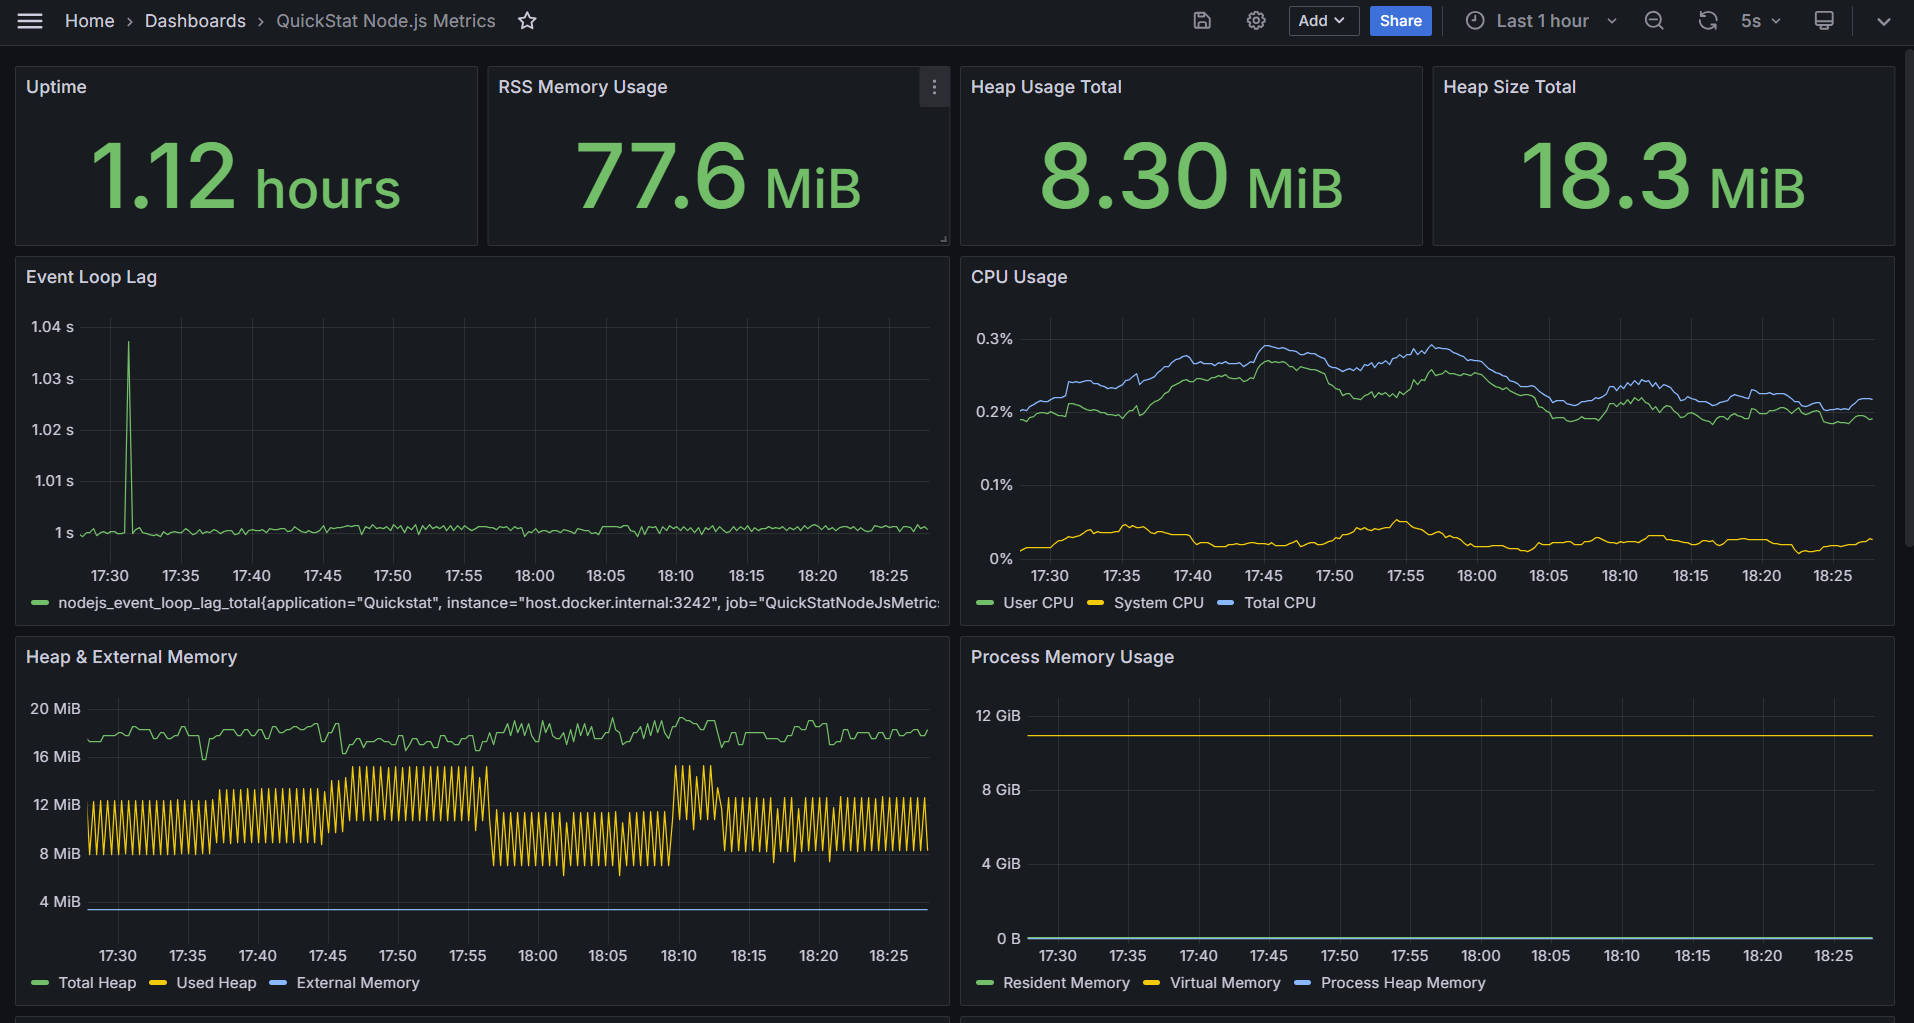
2. Import Dashboard to Grafana
Once Prometheus and Grafana are set up, you can add following Dashboard. Navigate to the Grafana dashboard page, click on “Import” and paste the dashboard template URL. Then, customize the dashboard as needed.
3. Expose Node.js Runtime Metrics
To expose the metrics to Prometheus using the QuickStat Node.js Plugin, use the following code snippet:
import { Client as QuickStatClient } from '@quickstat/core'
import { NodeJsPlugin } from '@quickstat/nodejs'
import { PrometheusDataSource, ScrapeStrategy } from '@quickstat/prometheus'
import http from 'http'

// Create QuickStat Client
const quickStatClient = new QuickStatClient() < PrometheusDataSource < ScrapeStrategy >> ({
      metrics: [],
      plugins: [
        // Register Node.js Plugin
        new NodeJsPlugin({
          excludeMetrics: [],
        }),
      ],
      // Register the data source
      dataSource: new PrometheusDataSource({
        strategy: new ScrapeStrategy(),
      }),
    })

// Let Prometheus scrape the metrics at http://localhost:3242
// WARNING: On production, properly secure the endpoint (if open)
http.createServer(async (req, res) => {
  const response = await quickStatClient.dataSource?.strategy?.getResponse()

  // Write the prometheus response file
  if (response) {
    res.writeHead(200, response.headers)
    res.end(response.file)
  }
}).listen(3242)
4. Start the Application
After setting up the code, start the application. The metrics will be available at http://localhost:3242 in Prometheus format and will be scraped by Prometheus, which will then be used for visualization in Grafana.
Available Metrics
The Node.js plugin provides comprehensive runtime metrics:
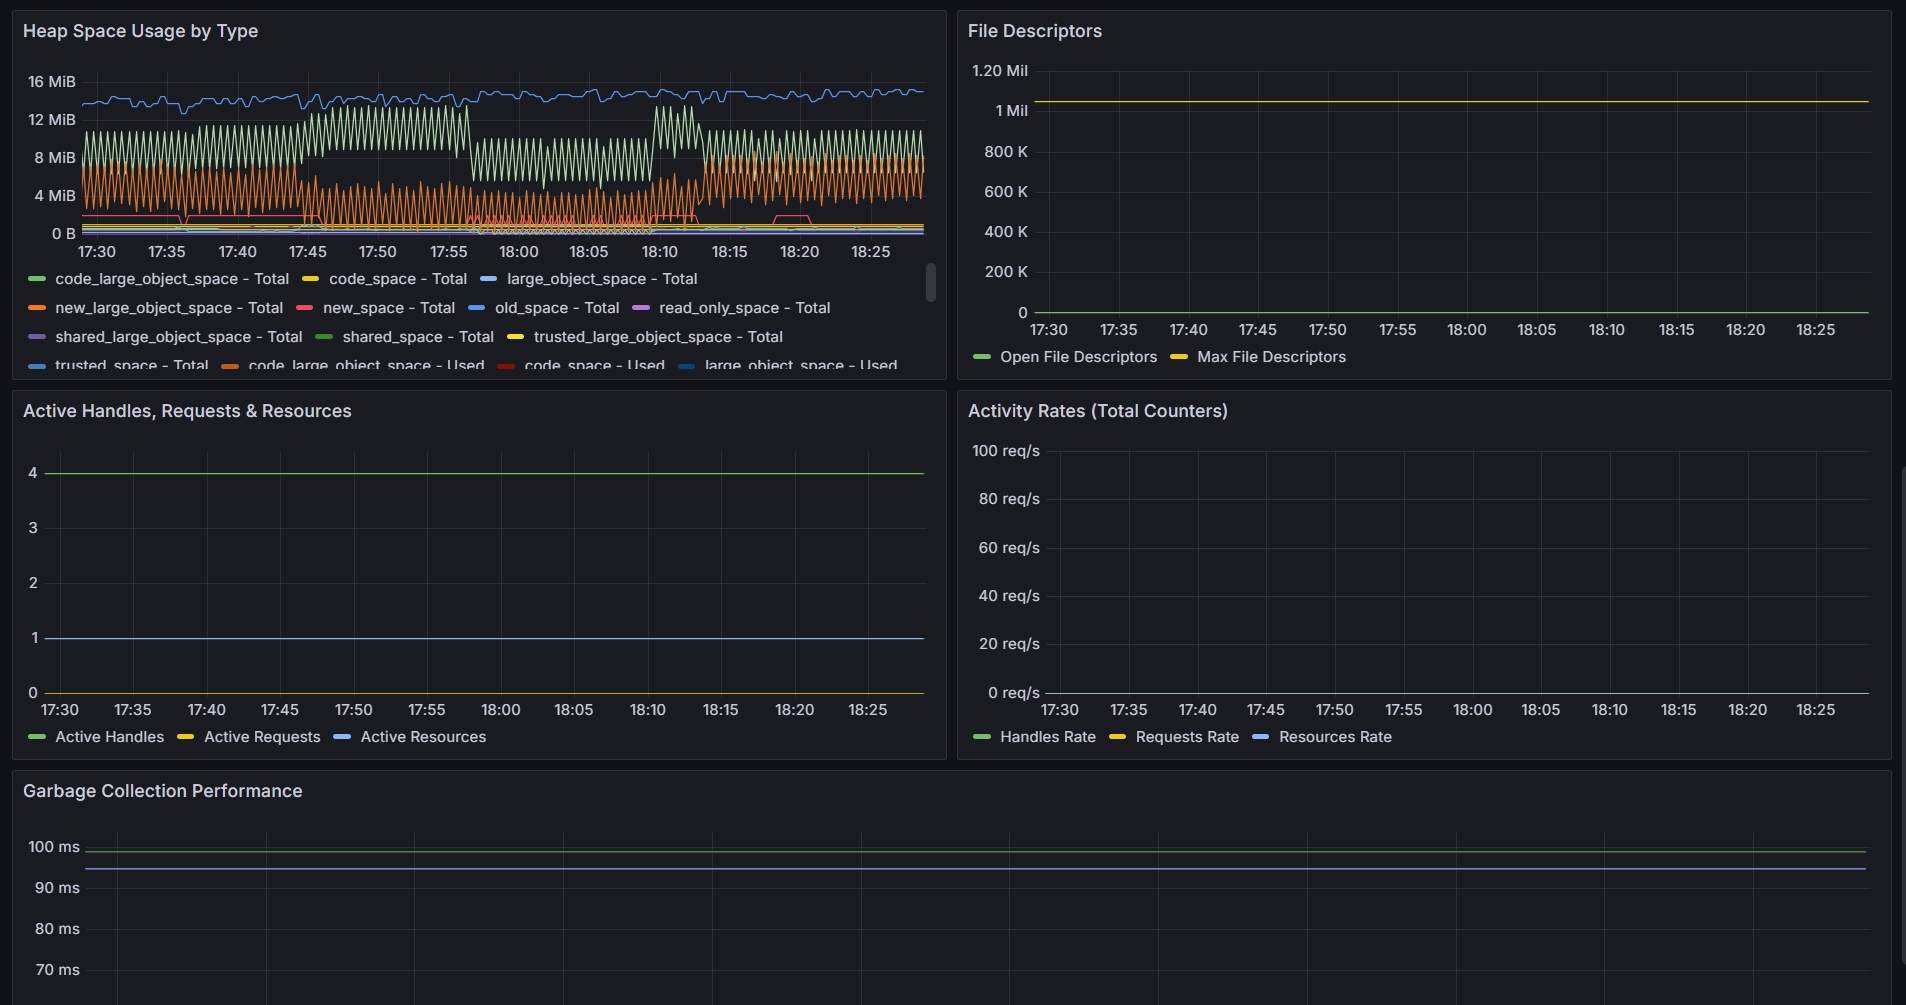
Memory Metrics
nodejs_heap_size_total- Total heap size in bytesnodejs_heap_size_used- Used heap size in bytesnodejs_external_memory- External memory size in bytesnodejs_heap_space_size_total- Total heap space size in bytes (by space)nodejs_heap_space_size_used- Used heap space size in bytes (by space)nodejs_heap_space_size_available- Available heap space size in bytes (by space)nodejs_process_resident_memory- Resident memory size in bytesnodejs_process_virtual_memory- Virtual memory size in bytes (Linux only)nodejs_process_heap_memory- Heap memory size in bytes
Performance Metrics
nodejs_event_loop_lag- Event loop lag in secondsnodejs_gc_duration- Garbage collection duration in seconds (by GC kind)
CPU Metrics
nodejs_process_cpu_user_total- Total user CPU time in secondsnodejs_process_cpu_system_total- Total system CPU time in secondsnodejs_process_cpu_total- Total CPU time in seconds
Resource Metrics
nodejs_active_handles- Number of active handlesnodejs_active_handles_total- Total number of active handlesnodejs_active_requests- Number of active requestsnodejs_active_requests_total- Total number of active requestsnodejs_active_resources- Number of active resourcesnodejs_active_resources_total- Total number of active resources
File Descriptor Metrics (Linux/Unix only)
nodejs_process_max_fds- Maximum number of file descriptorsnodejs_process_open_fds- Number of open file descriptors
Process Information
nodejs_start_time- Start time of the Node.js process in secondsnodejs_version- Node.js version information
Configuration
DataSource
The example above uses the PrometheusDataSource with the ScrapeStrategy. The ScrapeStrategy exposes the prometheus file on the given endpoint for being scraped from prometheus. You can also use the PushGatewayStrategy to push the metrics to the PushGateway of Prometheus.
If you would like to use other data sources, you can take a look at the available data sources in the @quickstat/core package
Plugin
The Node.js Plugin automatically collects runtime metrics from the current Node.js process. You can exclude specific metrics which should not be processed by the plugin.
Platform Support
- Full Support: Linux/Unix systems (includes file descriptor metrics)
- Core Support: Windows/macOS (excludes platform-specific metrics like file descriptors)
- GC Monitoring: Available on Node.js versions that support PerformanceObserver
- Event Loop Monitoring: Available on all supported Node.js versions
Memory Considerations
The plugin monitors the Node.js runtime with minimal overhead:
- Event loop monitoring: ~1KB memory, updates every second
- GC monitoring: Negligible overhead, only active during garbage collection
- Metric collection: Runs during scheduled collection intervals
Example Use Cases
Development Environment
Monitor your application’s memory usage, event loop performance, and garbage collection patterns during development to identify potential performance issues early.
Production Monitoring
Set up alerts on critical metrics like:
- High event loop lag (> 100ms)
- Memory leaks (continuously increasing heap usage)
- Excessive garbage collection frequency
- High CPU usage patterns
Performance Optimization
Use heap space metrics to understand memory allocation patterns and optimize your application’s memory usage across different heap spaces.
Contributing and Issues
If you have any issues or feature requests, feel free to open an issue on the GitHub repository
Data source config
Collector config:
Upload an updated version of an exported dashboard.json file from Grafana
| Revision | Description | Created | |
|---|---|---|---|
| Download |