
Prometheus Alertmanager
Dashboard showing Prometheus Alertmanager metrics for observing status of the cluster and possible debbuging.
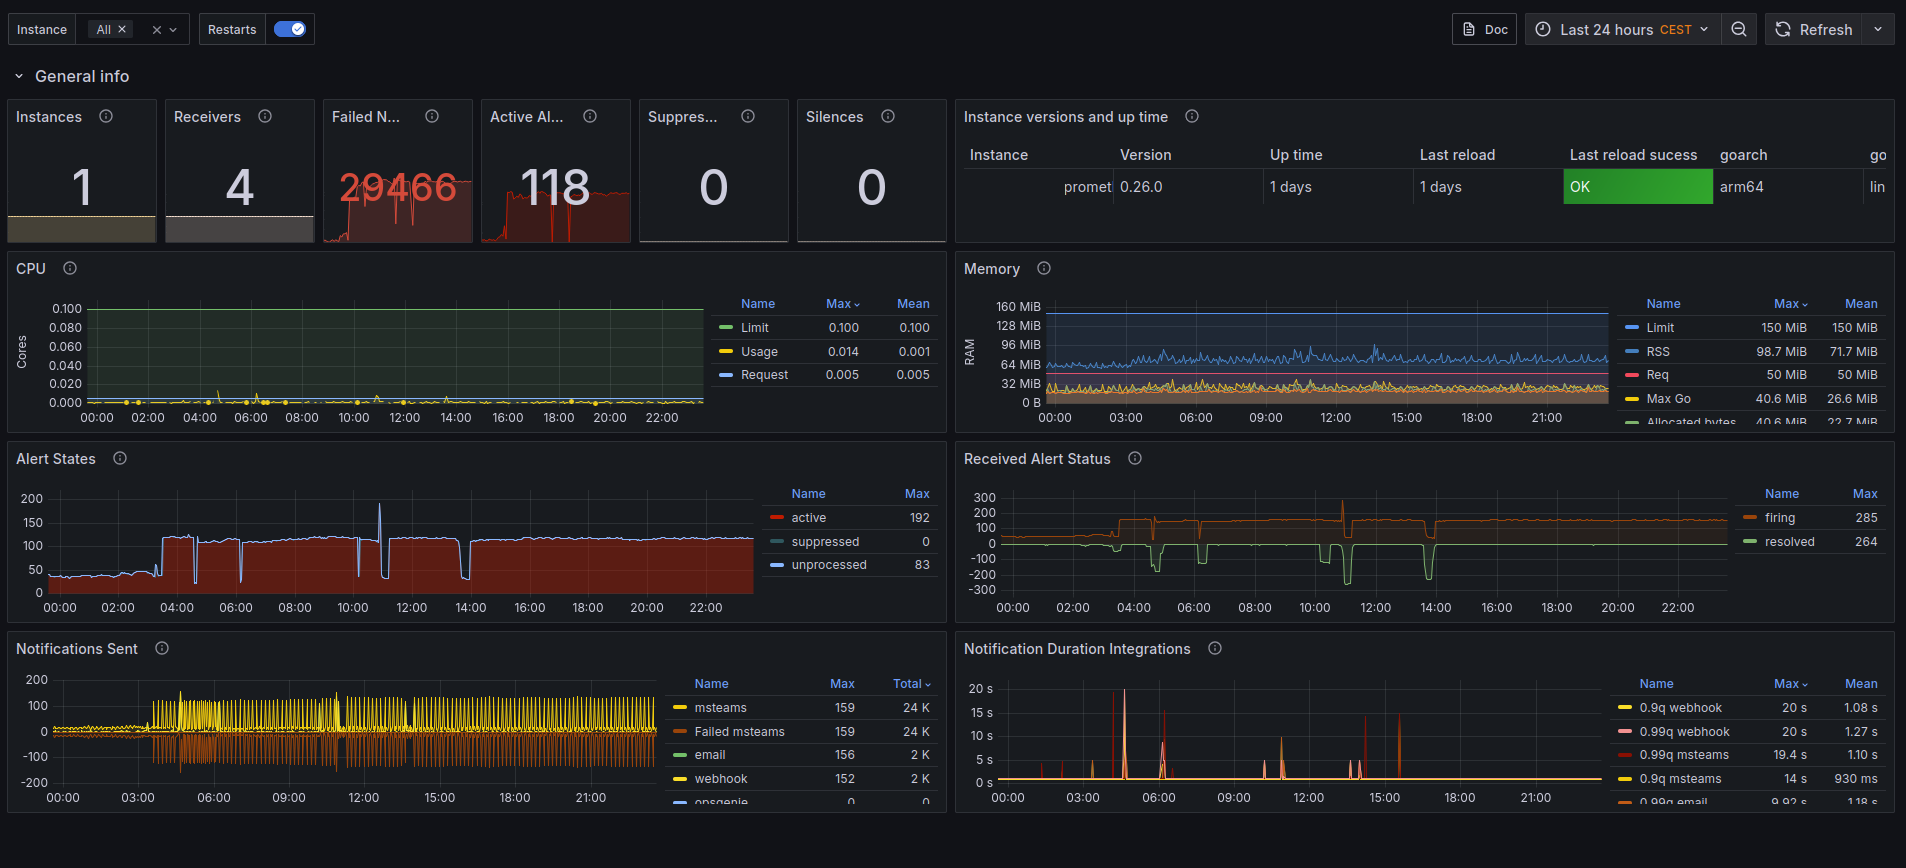
Prometheus AlertManager
This dashboard needs prometheus alertmanager metrics endpoint to be scraped.
- job_name: 'prometheus-am'
  static_configs:
    - targets: ['prometheus-alertmanager:8080']
Data source config
Collector type:
Collector plugins:
Collector config:
Revisions
Upload an updated version of an exported dashboard.json file from Grafana
| Revision | Description | Created | |
|---|---|---|---|
| Download |
Metrics Endpoint (Prometheus)
Easily monitor any Prometheus-compatible and publicly accessible metrics URL with Grafana Cloud's out-of-the-box monitoring solution.
Learn more