
Zabbix Linux
Dashboard based on Zabbix data for Linux
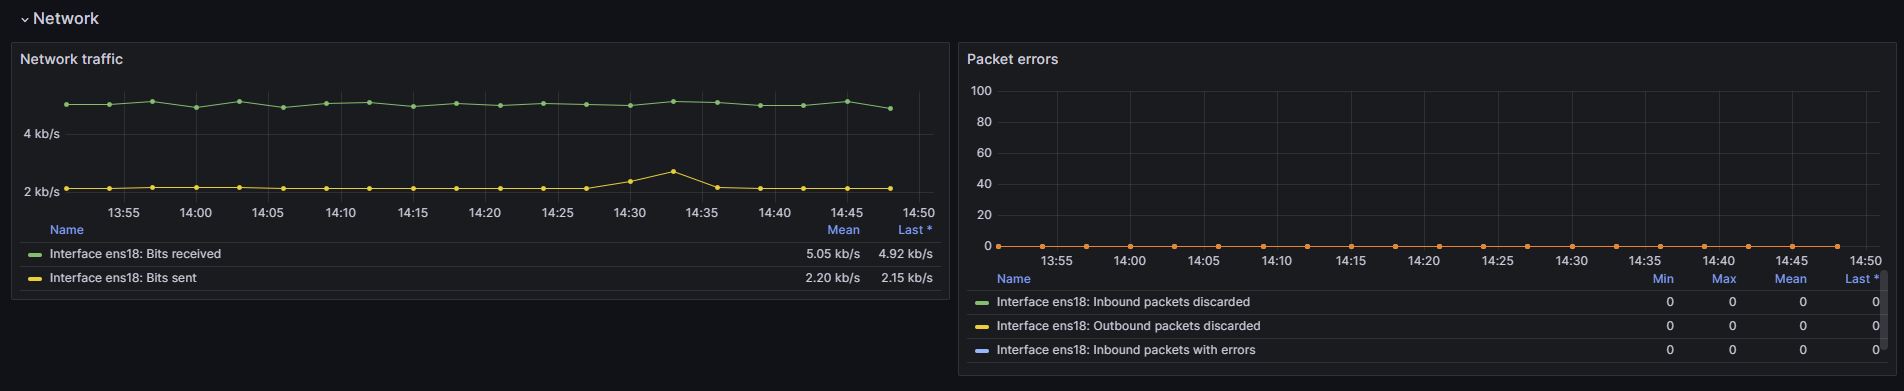
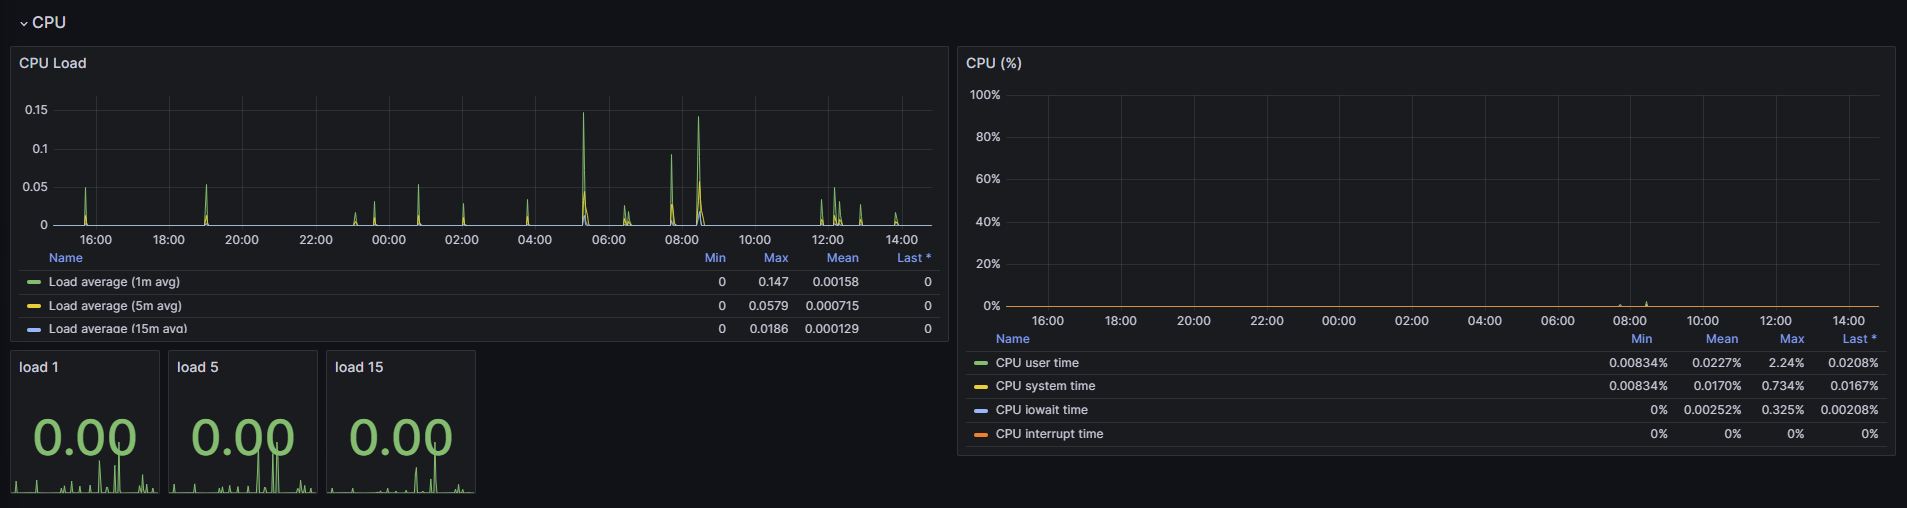
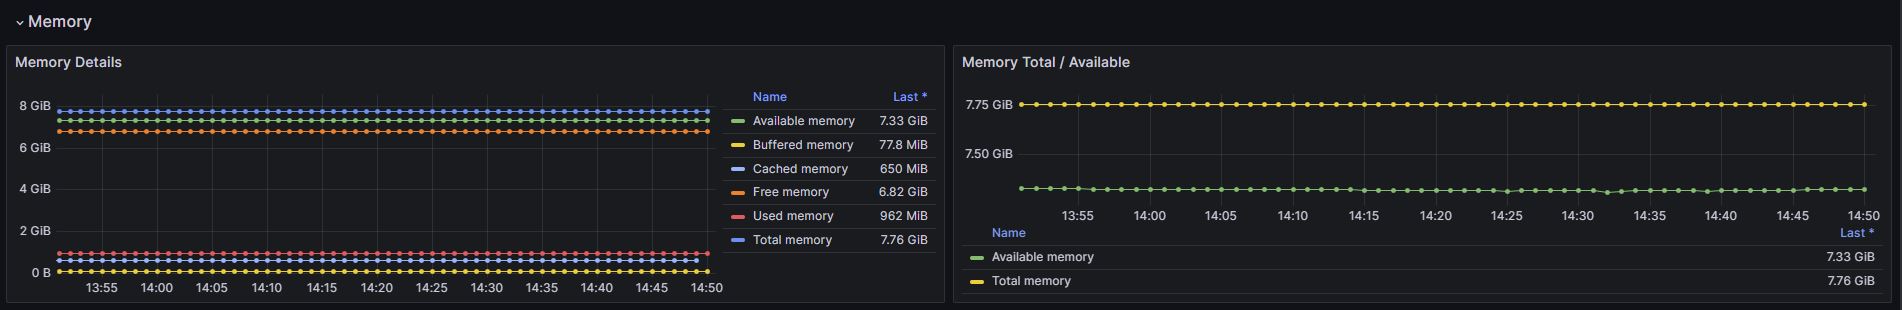
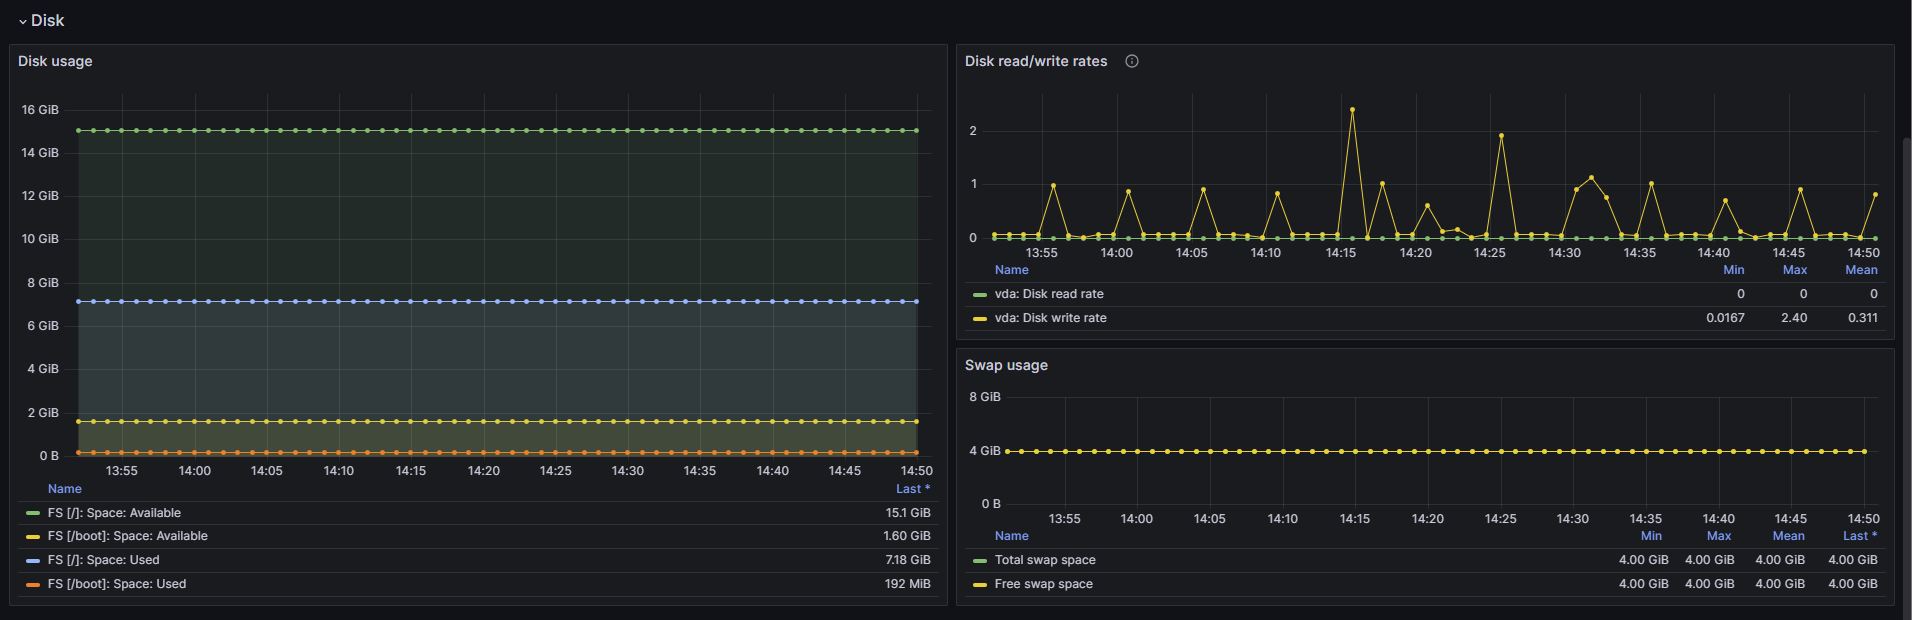
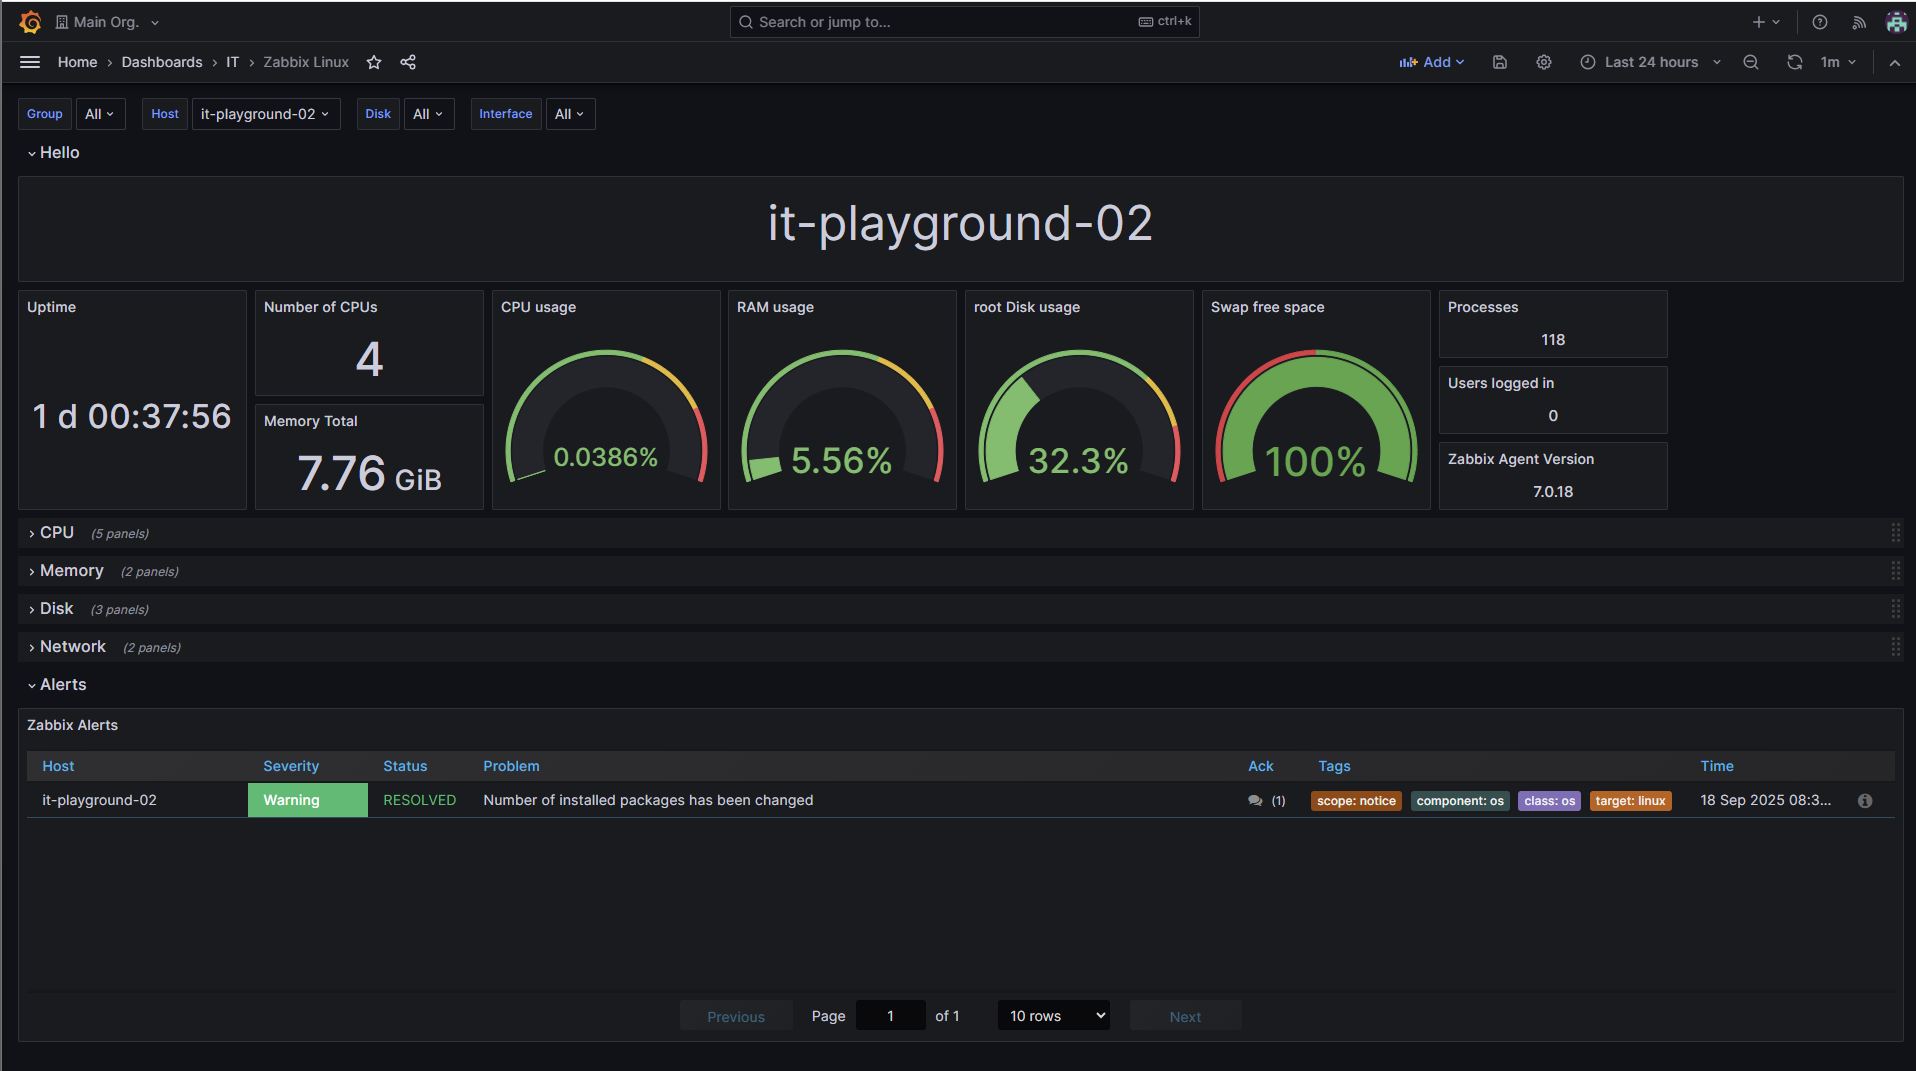
The Zabbix Linux dashboard uses the alexanderzobnin-zabbix-datasource data source to create a Grafana dashboard with the alexanderzobnin-zabbix-triggers-panel, gauge, stat, text and timeseries panels.
Data source config
Collector type:
Collector plugins:
Collector config:
Revisions
Upload an updated version of an exported dashboard.json file from Grafana
| Revision | Description | Created | |
|---|---|---|---|
| Download |
Linux Server
Monitor Linux with Grafana. Easily monitor your Linux deployment with Grafana Cloud's out-of-the-box monitoring solution.
Learn more