
Proemion Telematics Analyzer
Updated panels, additional time series statistics, optimized CLF queries. PDCs can also be read directly. Internal Only Minimum Permission: Machines: Admin Models: Admin Location: History


How to Setup the Grafana Telematics Analyzer
Fresh Setup
- Create a Grafana account
- Install necessary plugins
- Add new data source
- Import the Dashboard
- How to find your Dashboard later
If you migrate from the Proemion CLF Analyzer Dashboard
Fresh Setup
Create a Grafana account
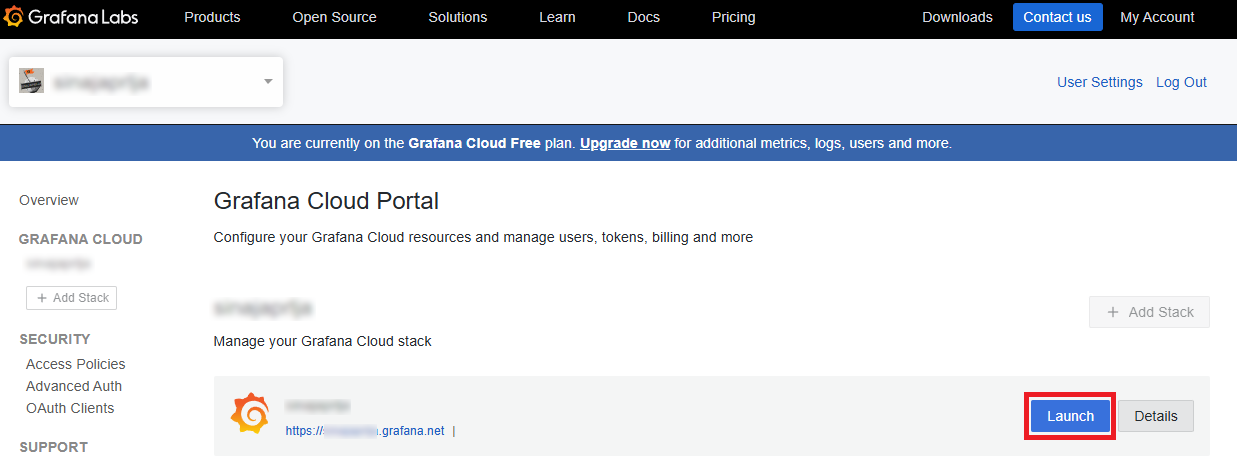
- Open Grafana
- Create an account with your e-mail
- Launch Grafana by clicking on the blue button circled in red showed below.

Install necessary plugins
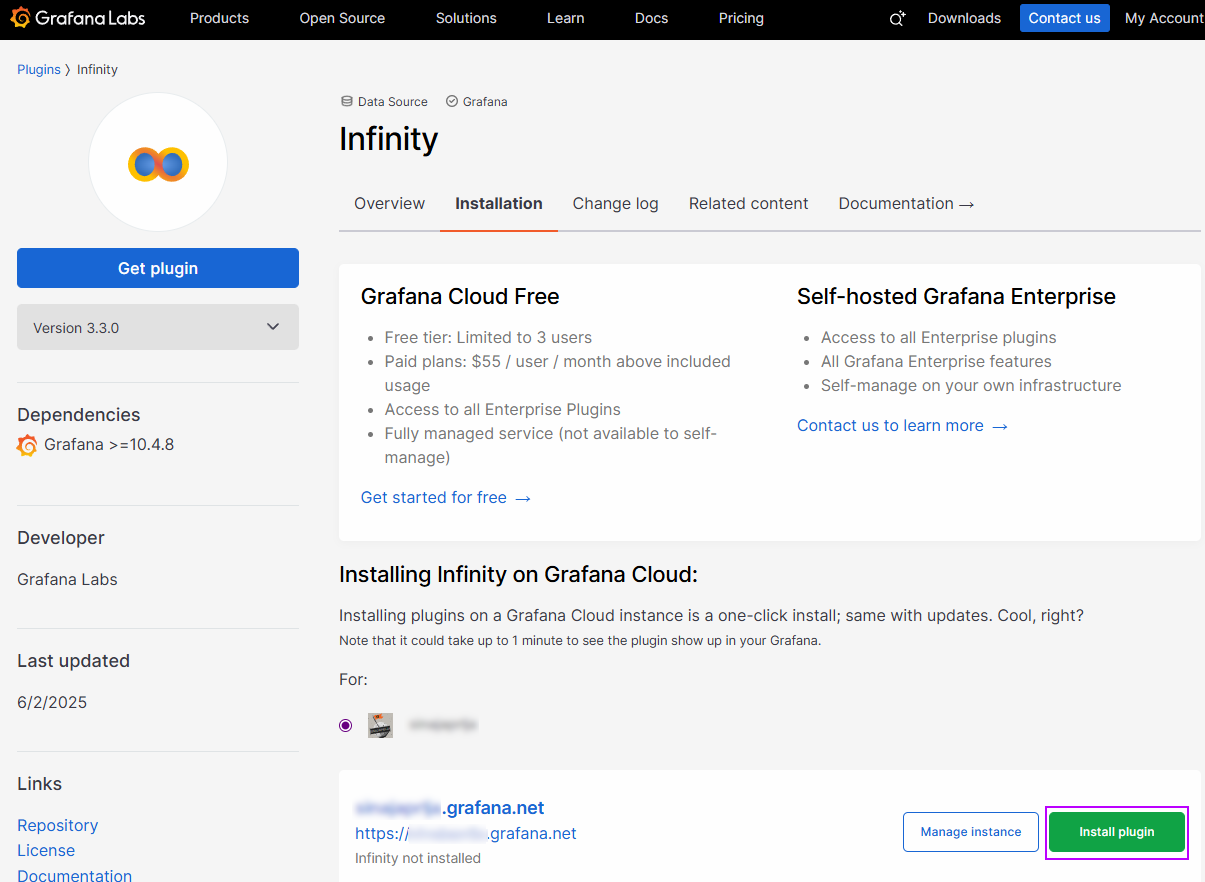
Install the Infinity plugin
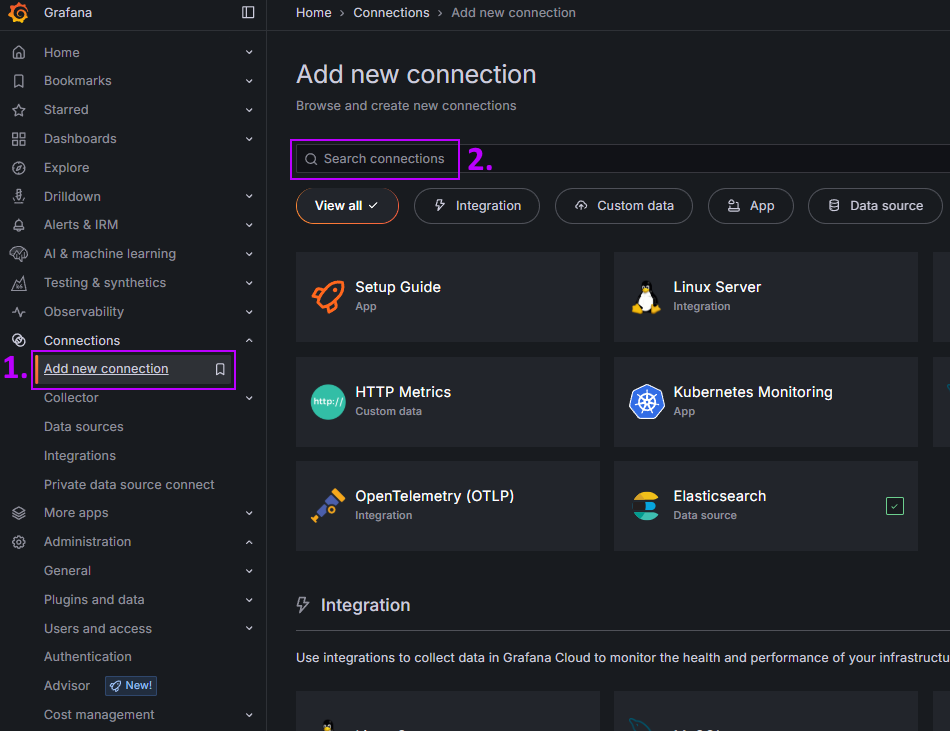
Go to Connections and click on Add new connection
Search for Infinity and install it
Click on Install Plugin via Grafana.com link
Note: If this does not appear, make sure you are logged in to Grafana, and refresh the page until your cloud instance appears


- Once installed, it can take a few minutes to update on your Grafana Cloud Instance
Install the Dynamic Text plugin
- Analogue to the previous steps for installing Infinity, install the Business Text plugin.
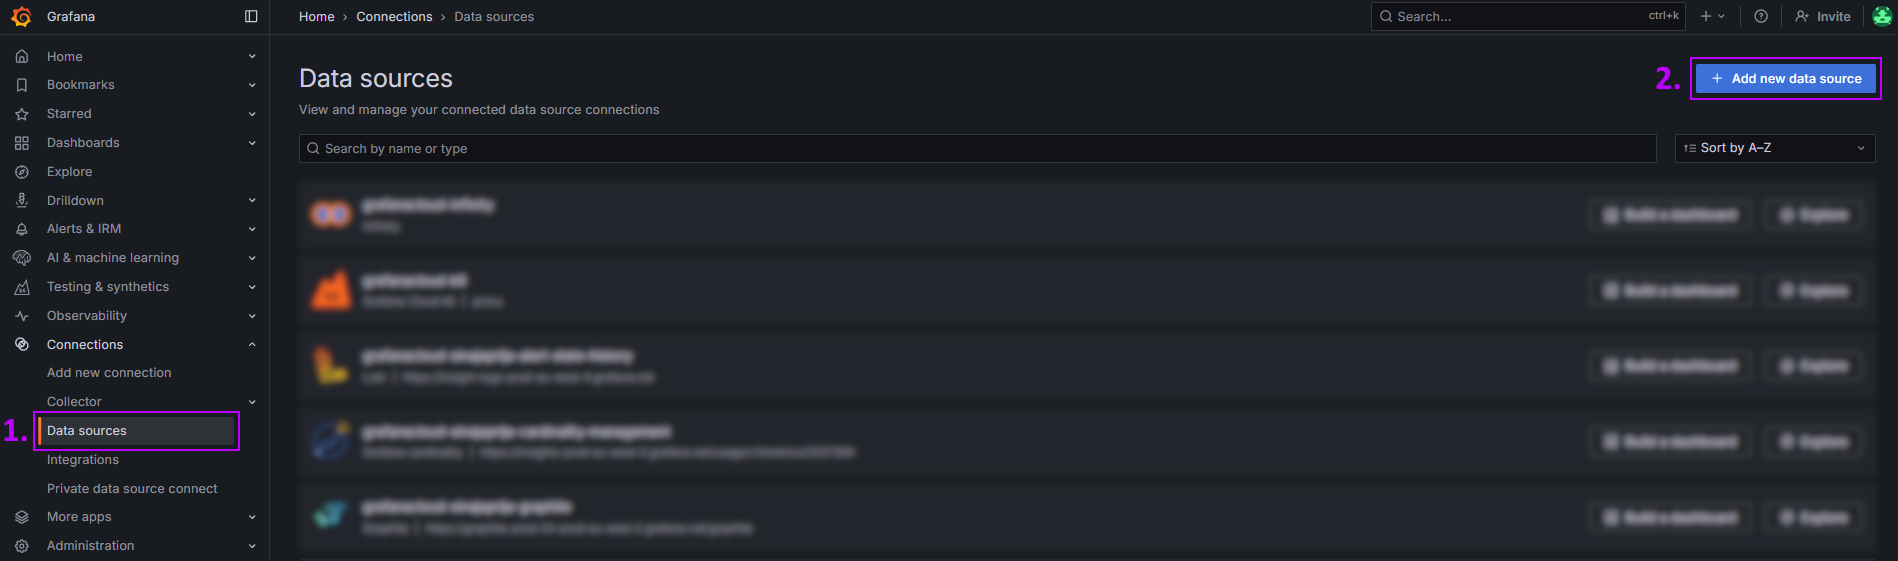
Add new data source
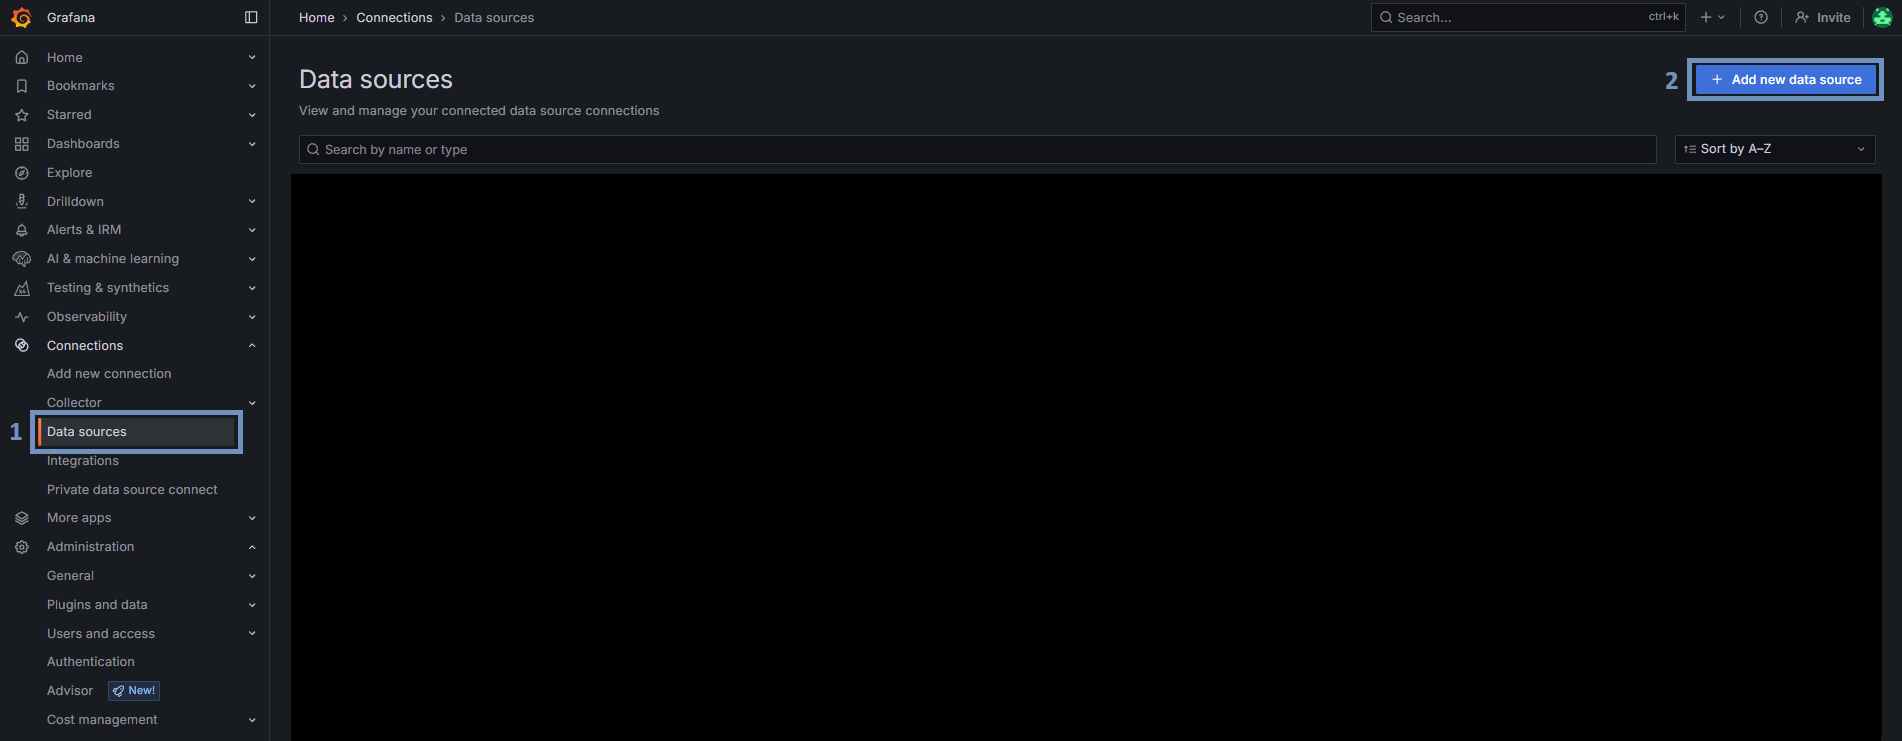
Go to Data sources
Click on Add new data source
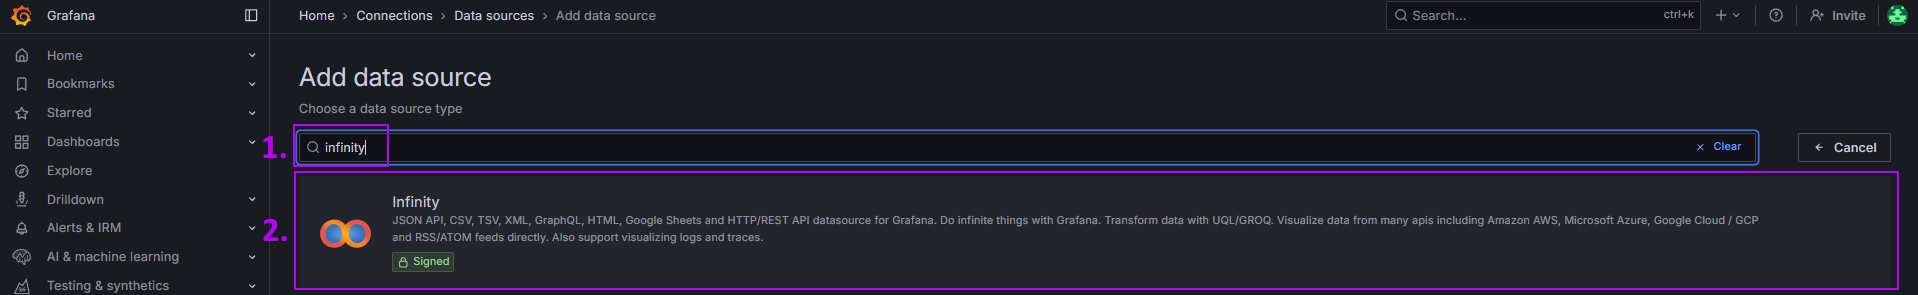
Search for Infinity
Click on the result Infinity
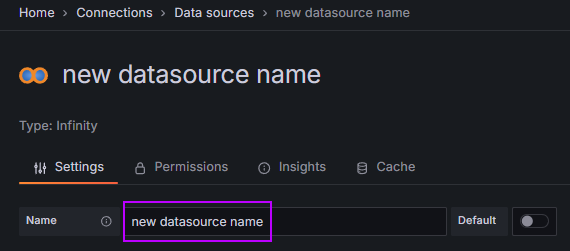
Choose a name for the Data Source.
You should configure one data source per organization unit.
The name will help you later to identify which organization are you querying.Setup Authentication
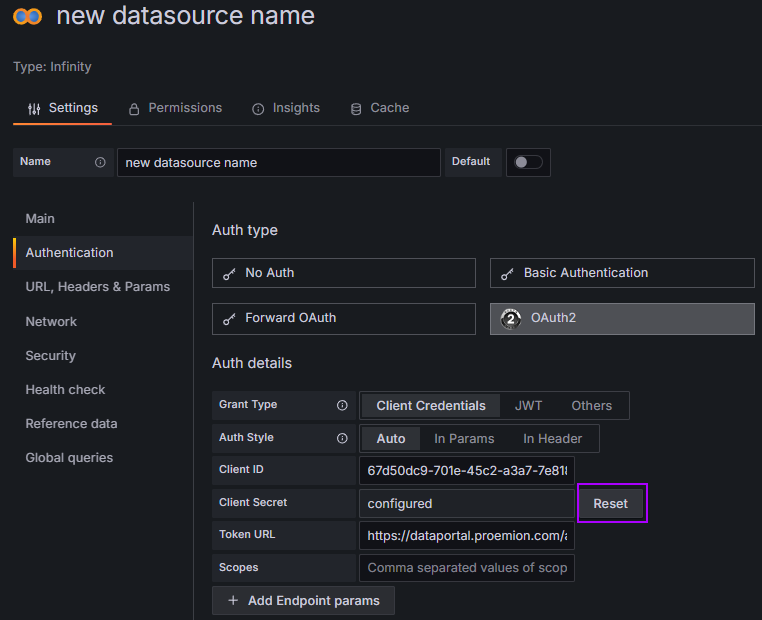
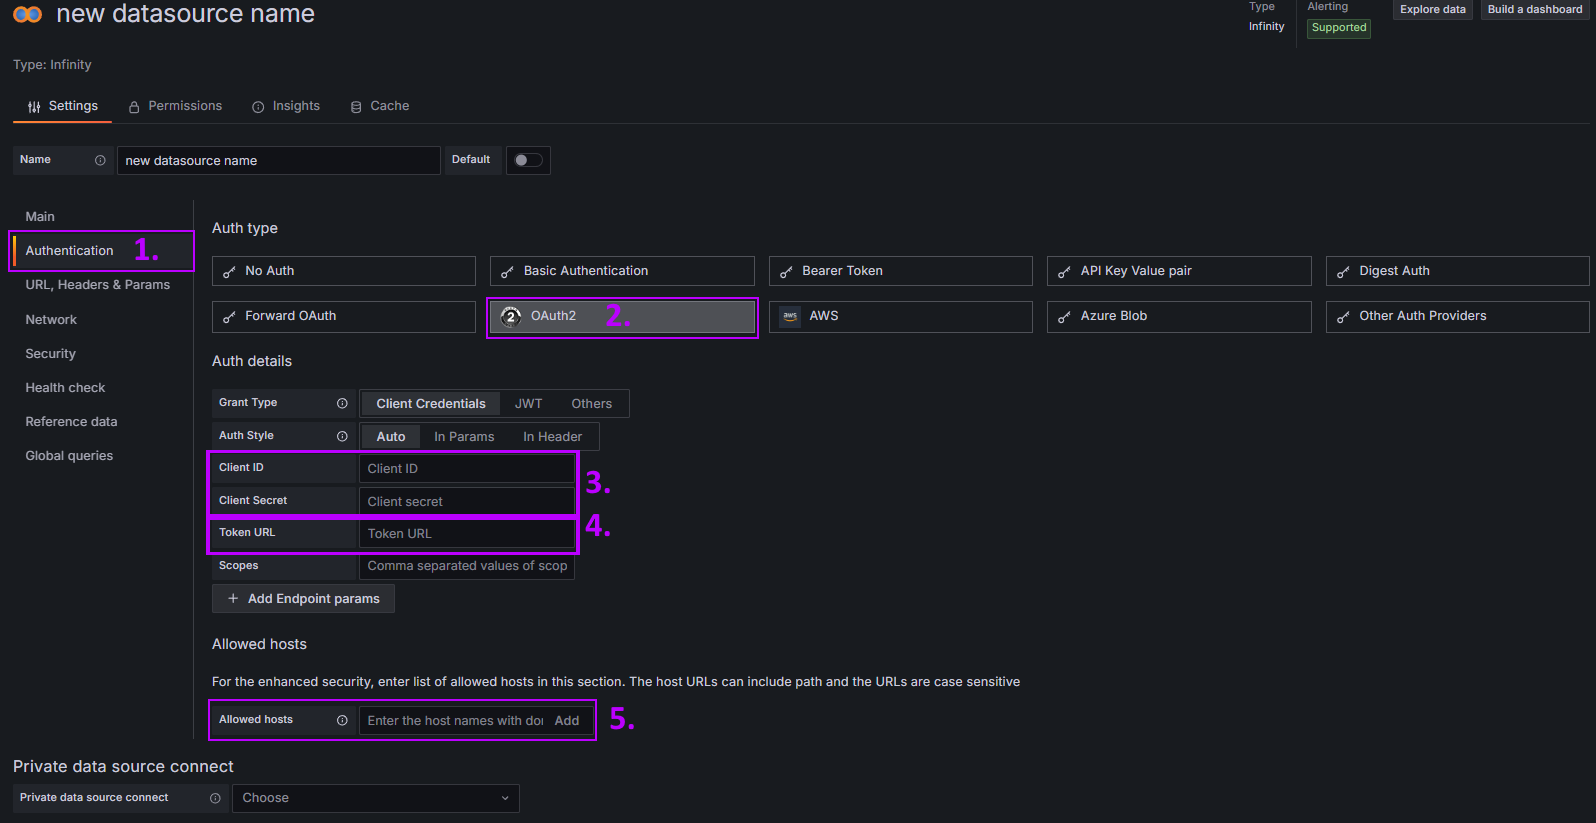
- Chose Authentication
- Choose OAuth2
- Enter your Client ID and Client Secret
Note: it is highly recommended for security reasons to reset the Client Secret after every Usage of the Dashboards! - Enter the Token URL: https://dataportal.proemion.com/api/v25.7.0/auth/token
Note: Adjust the api version defined in /v25.7.0/ according to the newest api version we provide. You can check that by visiting https://status.proemion.com/ and clicking on SUBSCRIBE TO UPDATES - You will be notified when a new api version is provided. This goes for every URL that contains the api version. - Enter the allowed host: https://dataportal.proemion.com
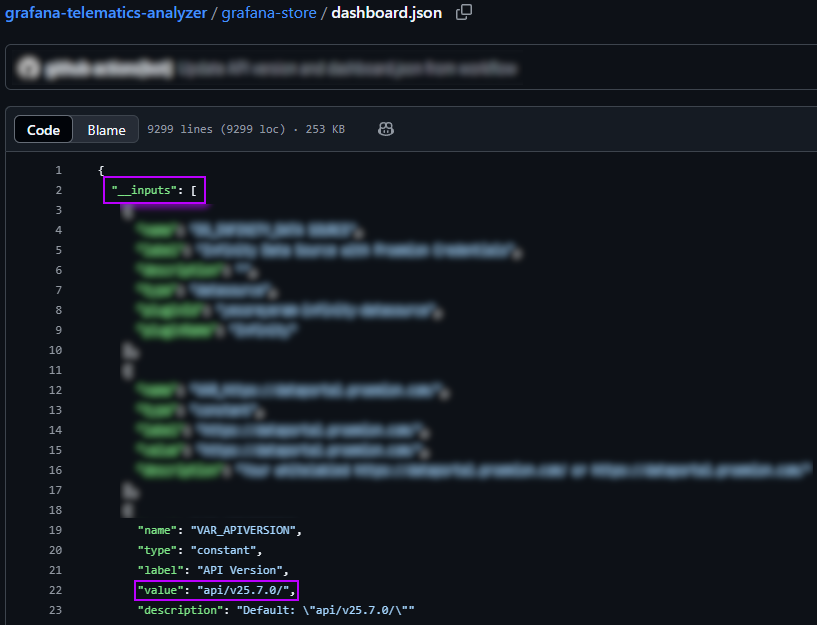
Note: In order to check the api version used in your dashboard, you can have a look at the .json file of the dashboard.
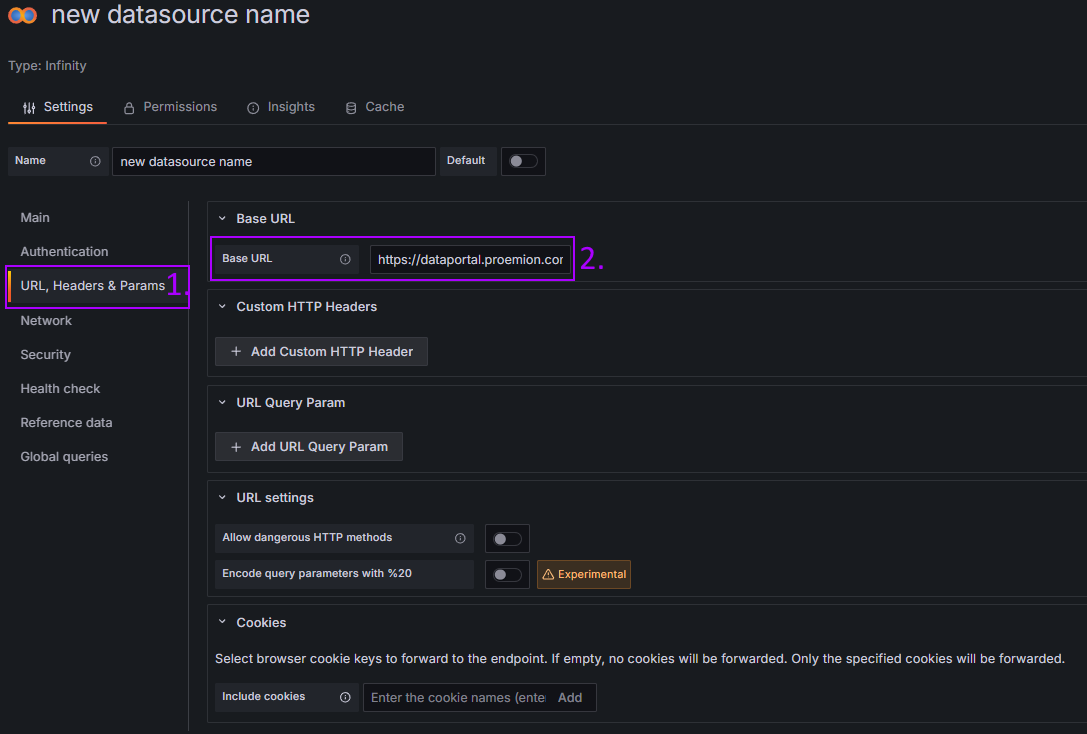
Setup Base URL
- Navigate to URL, Headers & Params
- Enter for Base URL: https://dataportal.proemion.com/
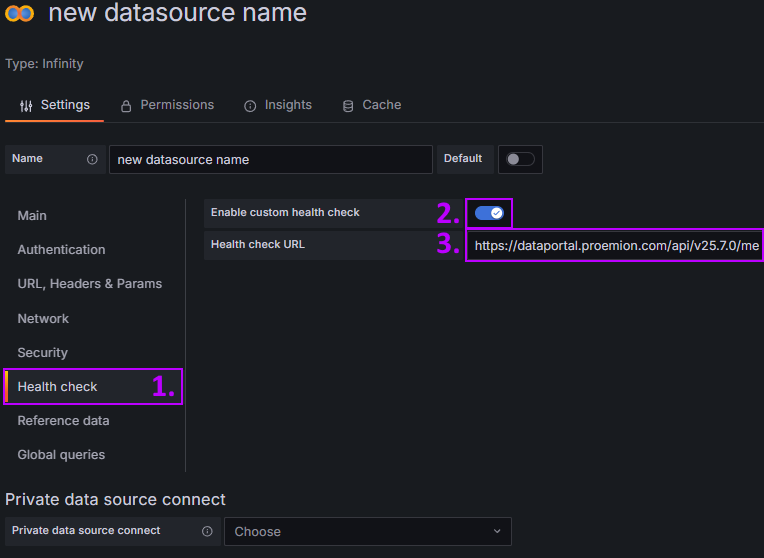
Setup Health Check
- Navigate to Health Check
- Enable custom health check
- Enter Health check URL: https://dataportal.proemion.com/api/v25.7.0/me
Make sure that the api version is the same that was entered in the Token URL for authentication.
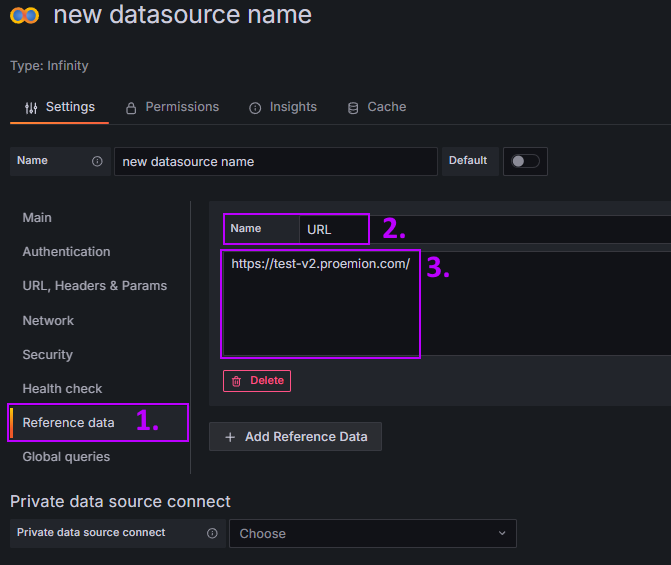
Setup Reference Data
- Navigate to Reference data
- Enter as Name URL
- Enter below https://dataportal.proemion.com/ as URL
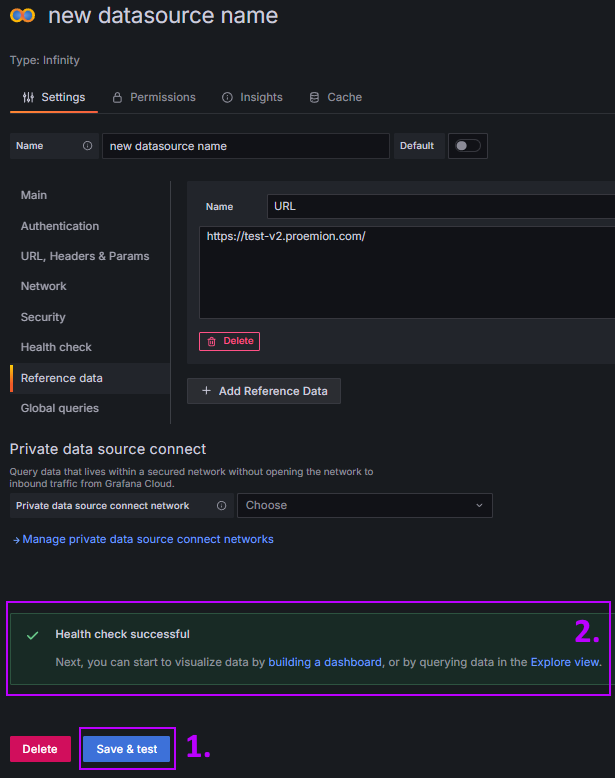
Save and Test
- Now press Save and test
- if everything was setup correctly, then the Health Check should be successfull.


Import the Dashboard
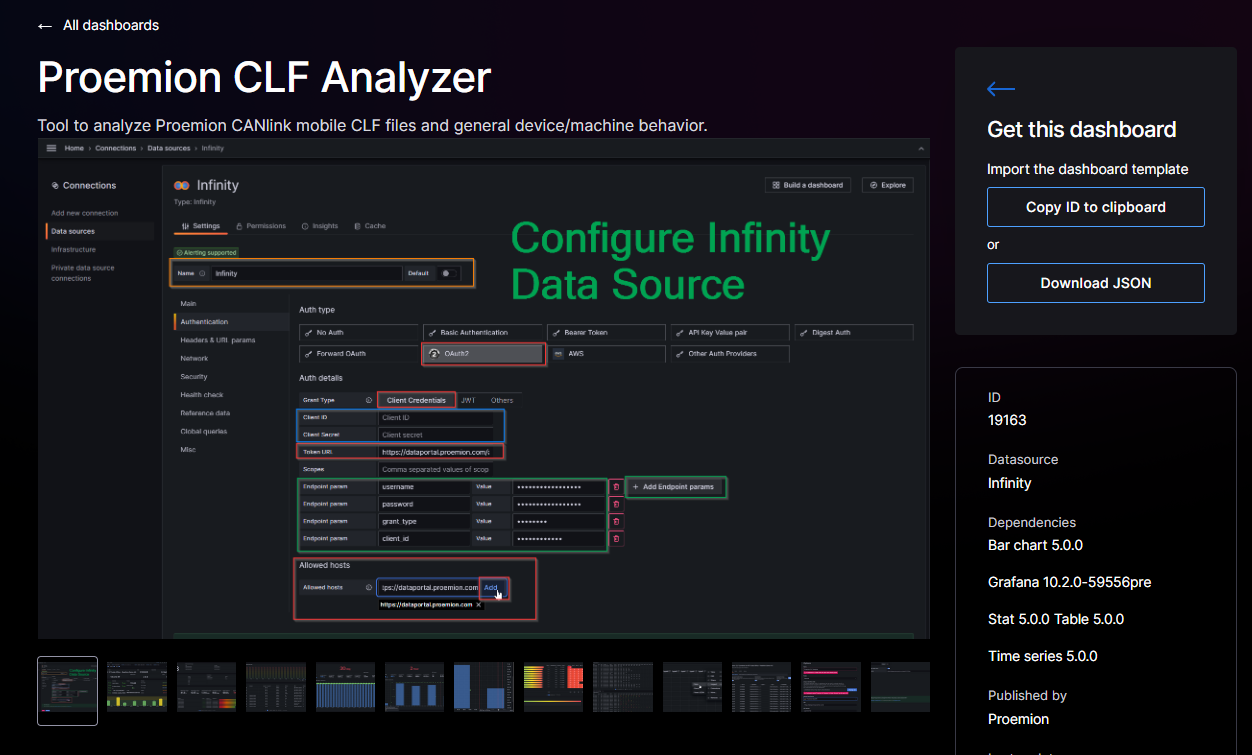
Visit https://grafana.com/grafana/dashboards/24060-proemion-telematics-analyzer/ in a new tab
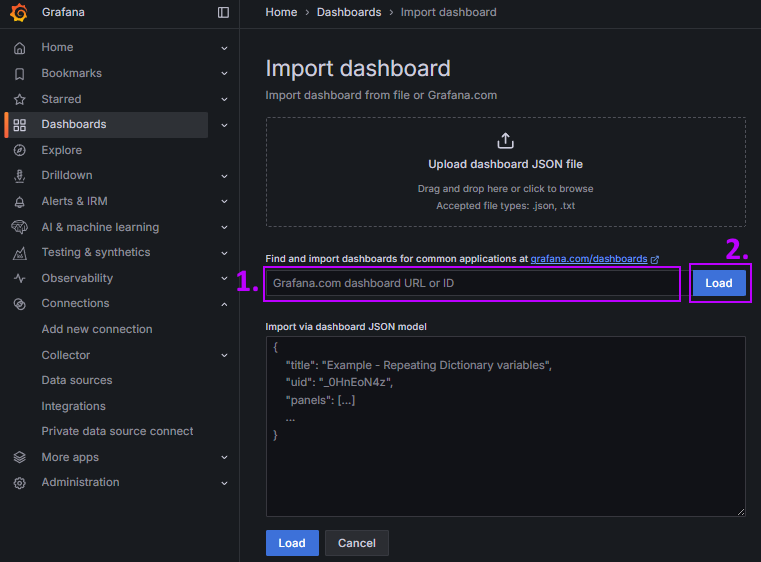
Click Copy ID to clipboard in order to copy the dashboard id
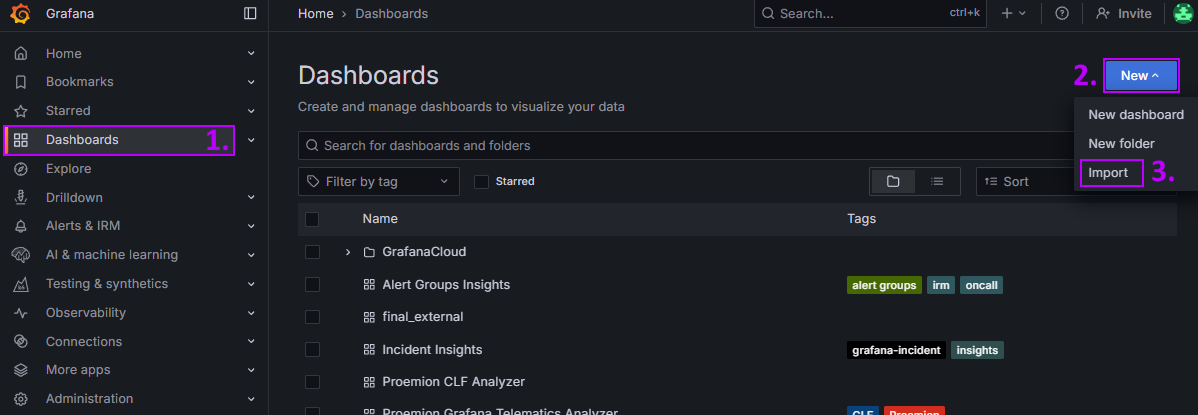
Go back to Grafana and navigate to Dashboards
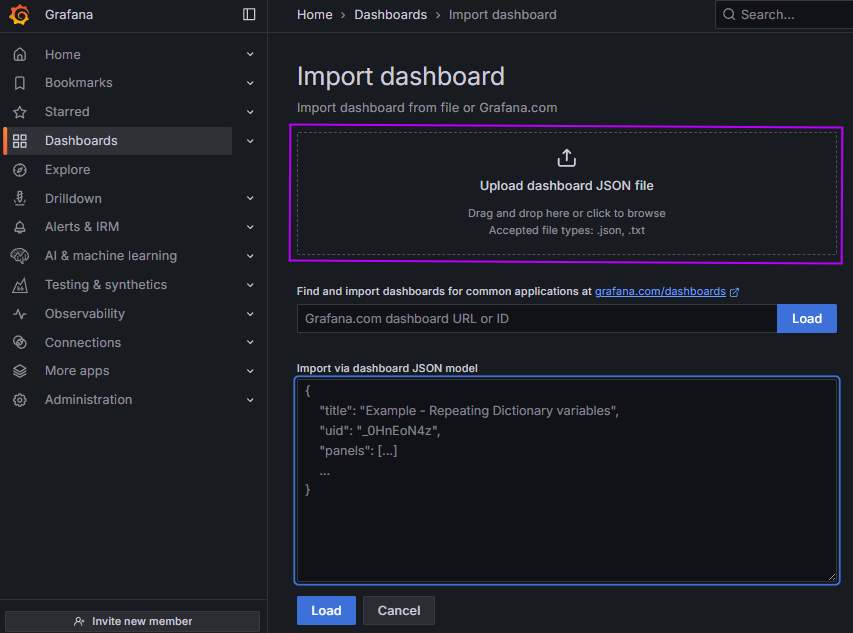
Click on New to open the dropwown and then click on Import
Paste the previously copied Dashboard id
Press Load
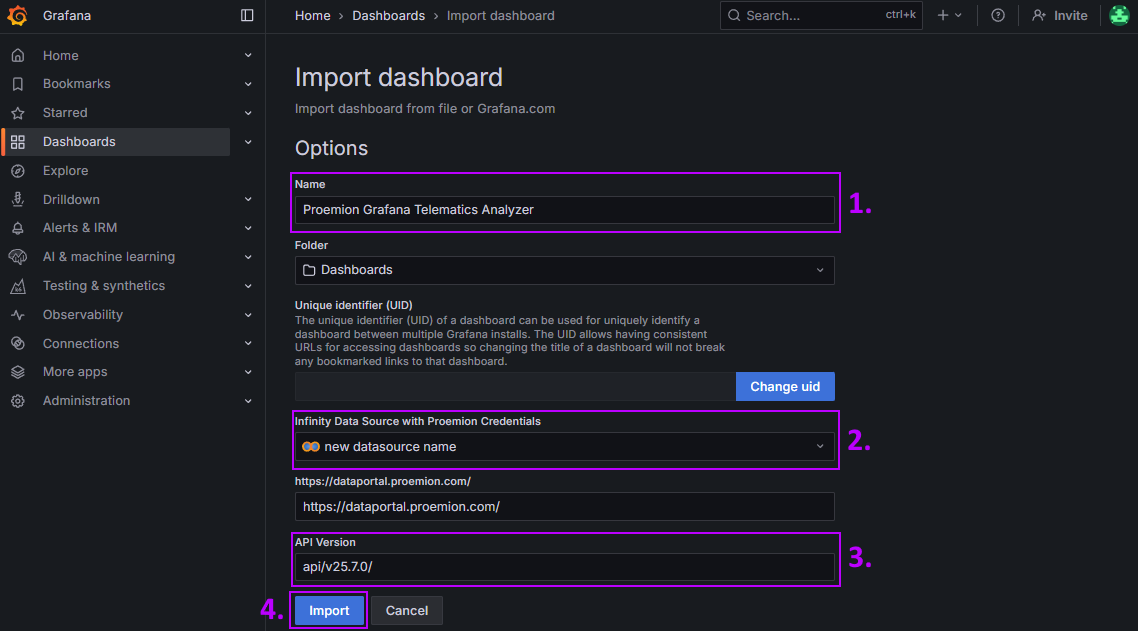
Make sure to name it accordingly and to select the datasource you created before.
You can also check if this dashboard contains the right api version.Click on Import
The Dashboard loads then automatically


How to find your Dashboard later
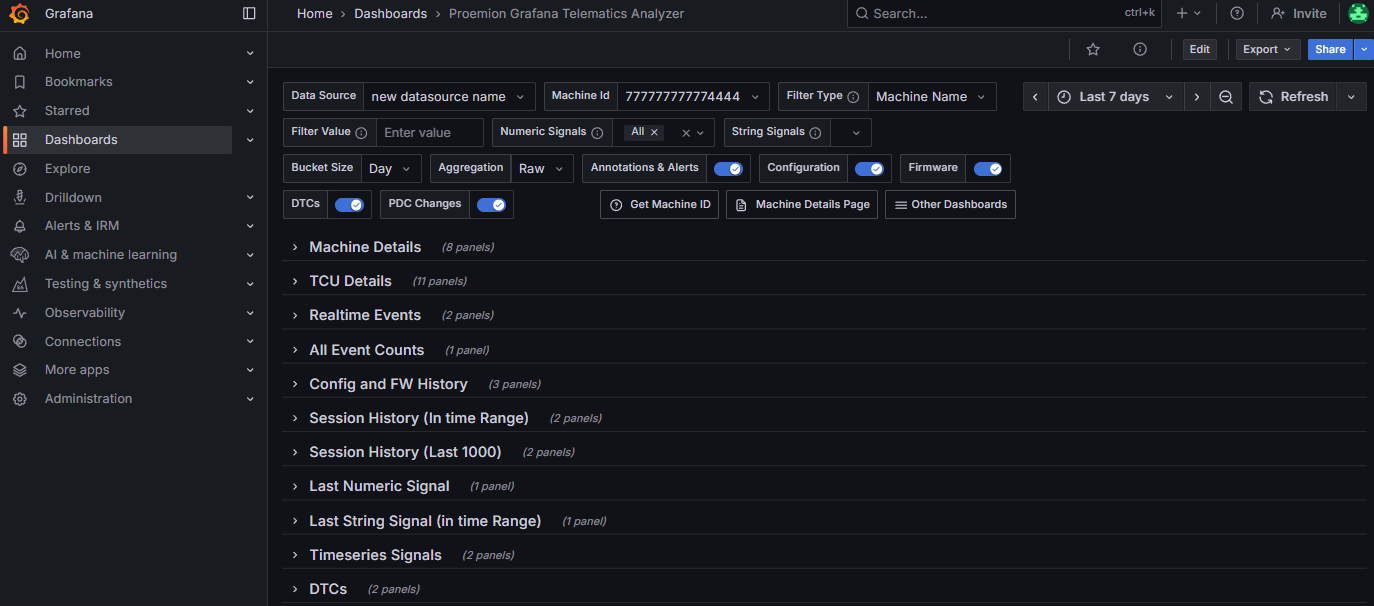
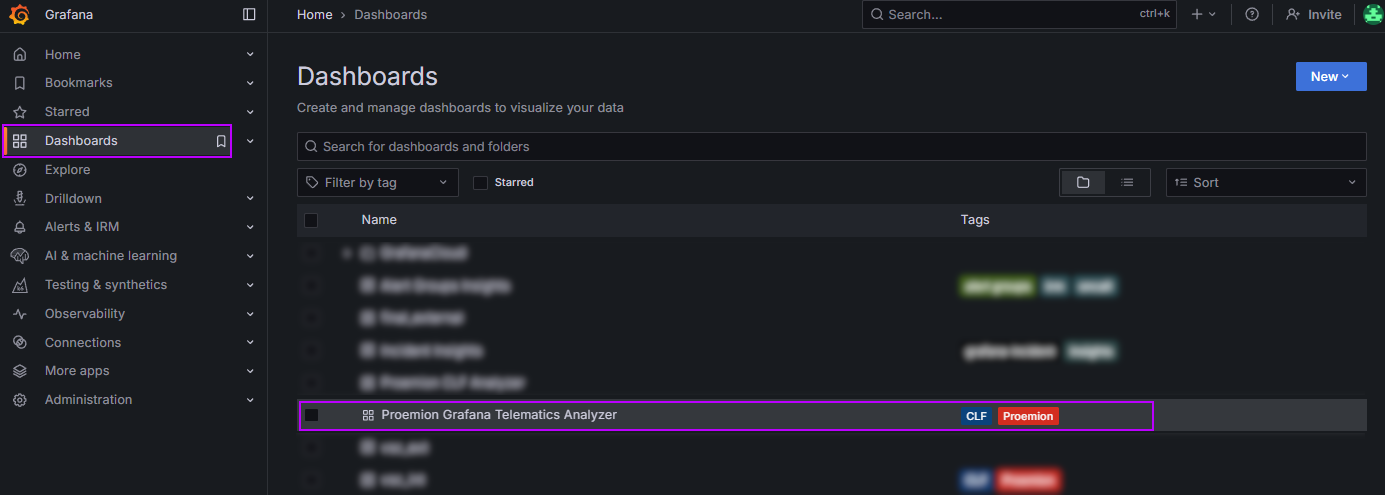
Navigate to Dashboards
Select the dashboard you imported
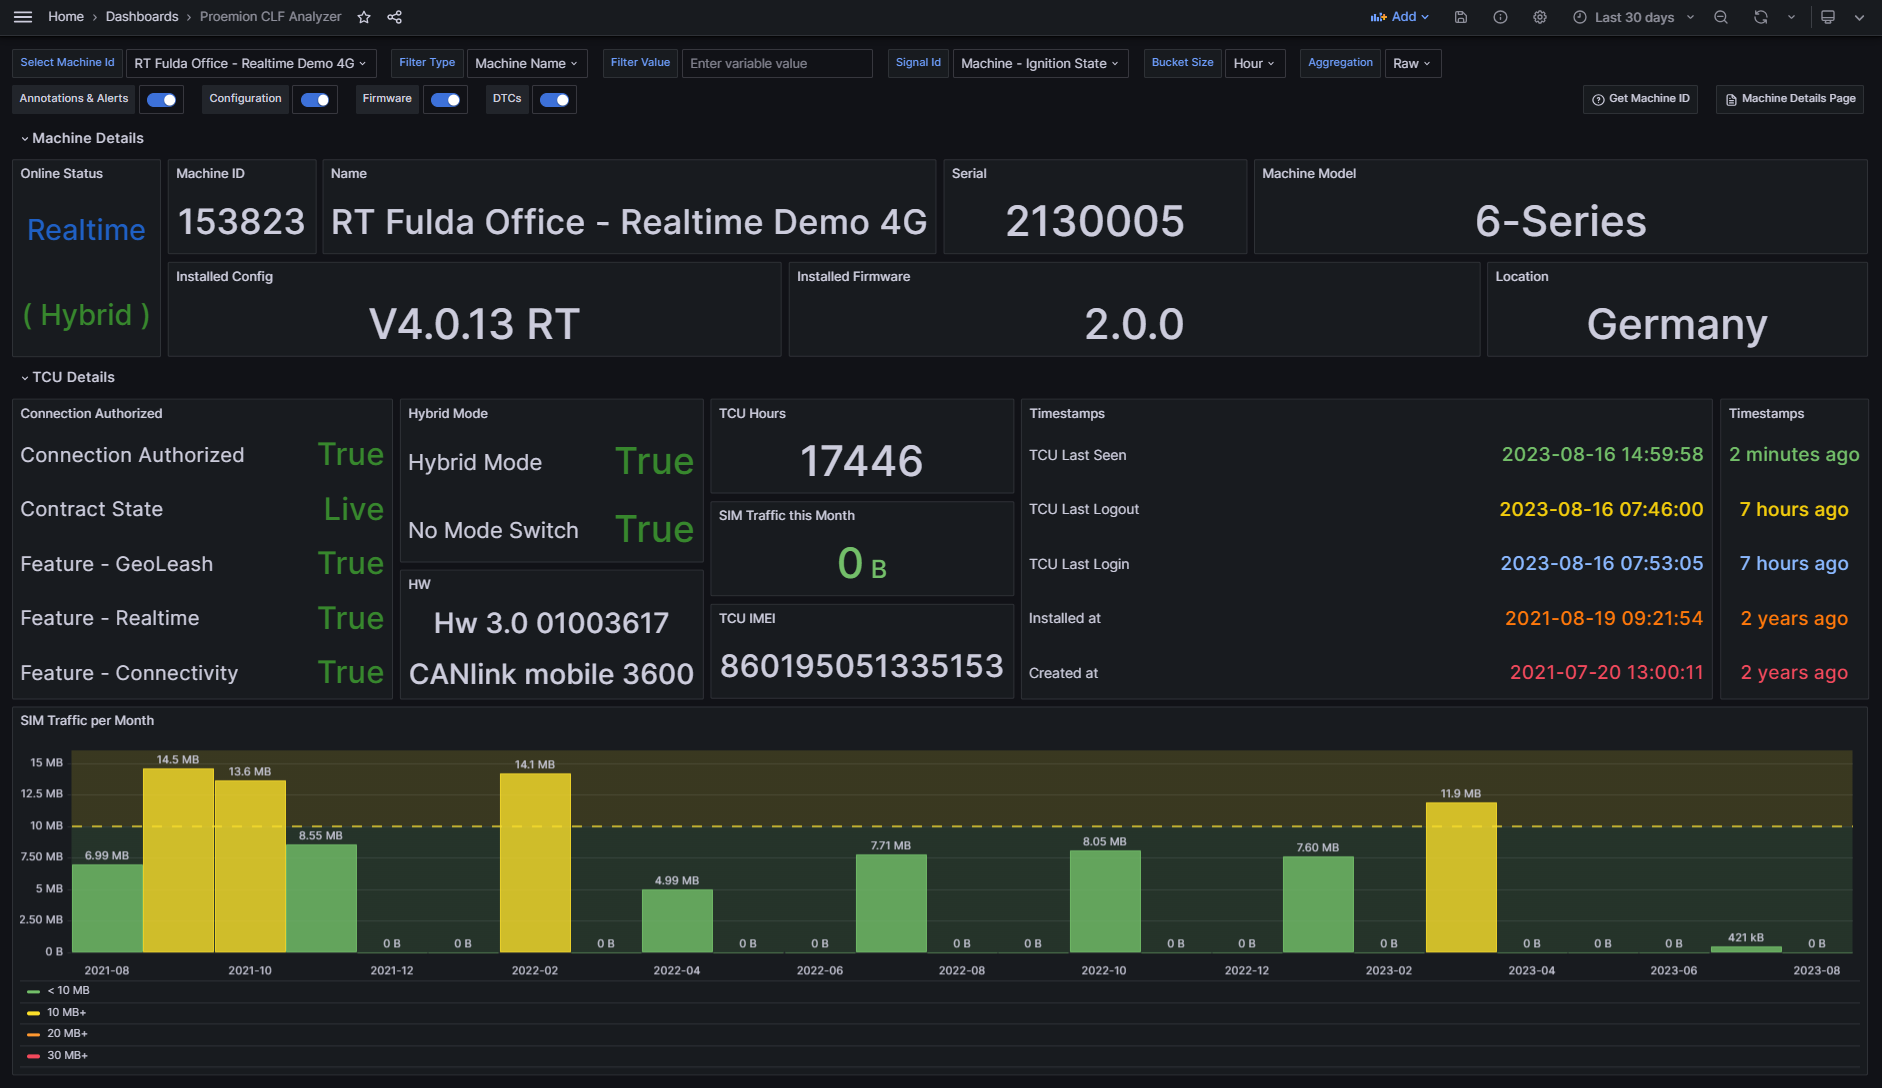
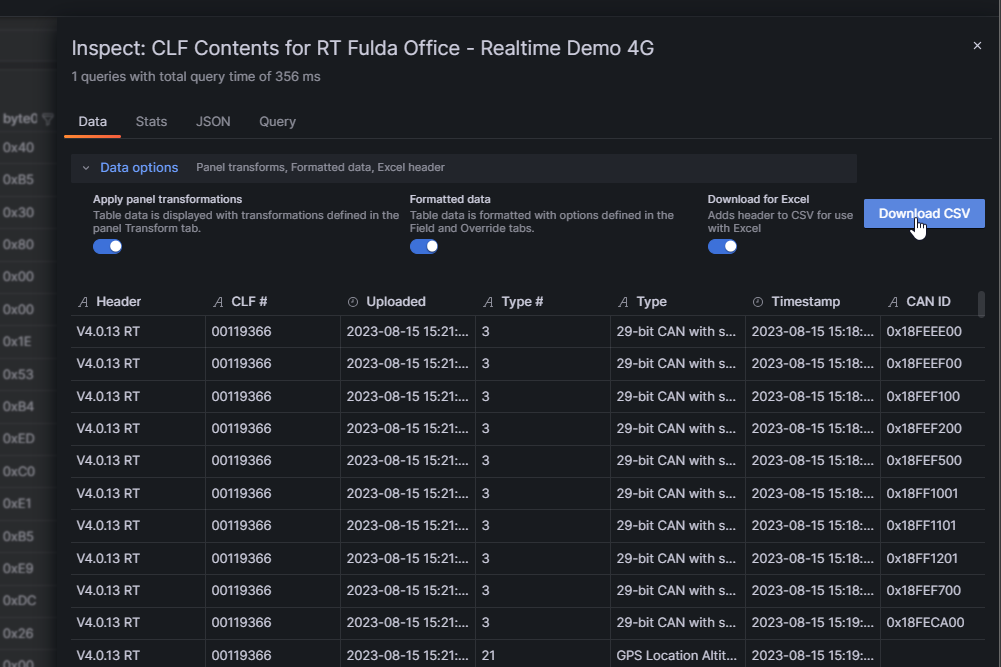
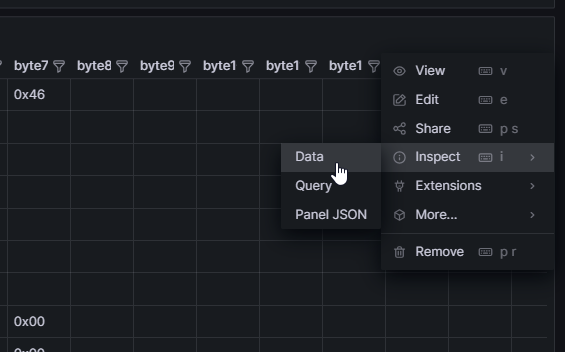
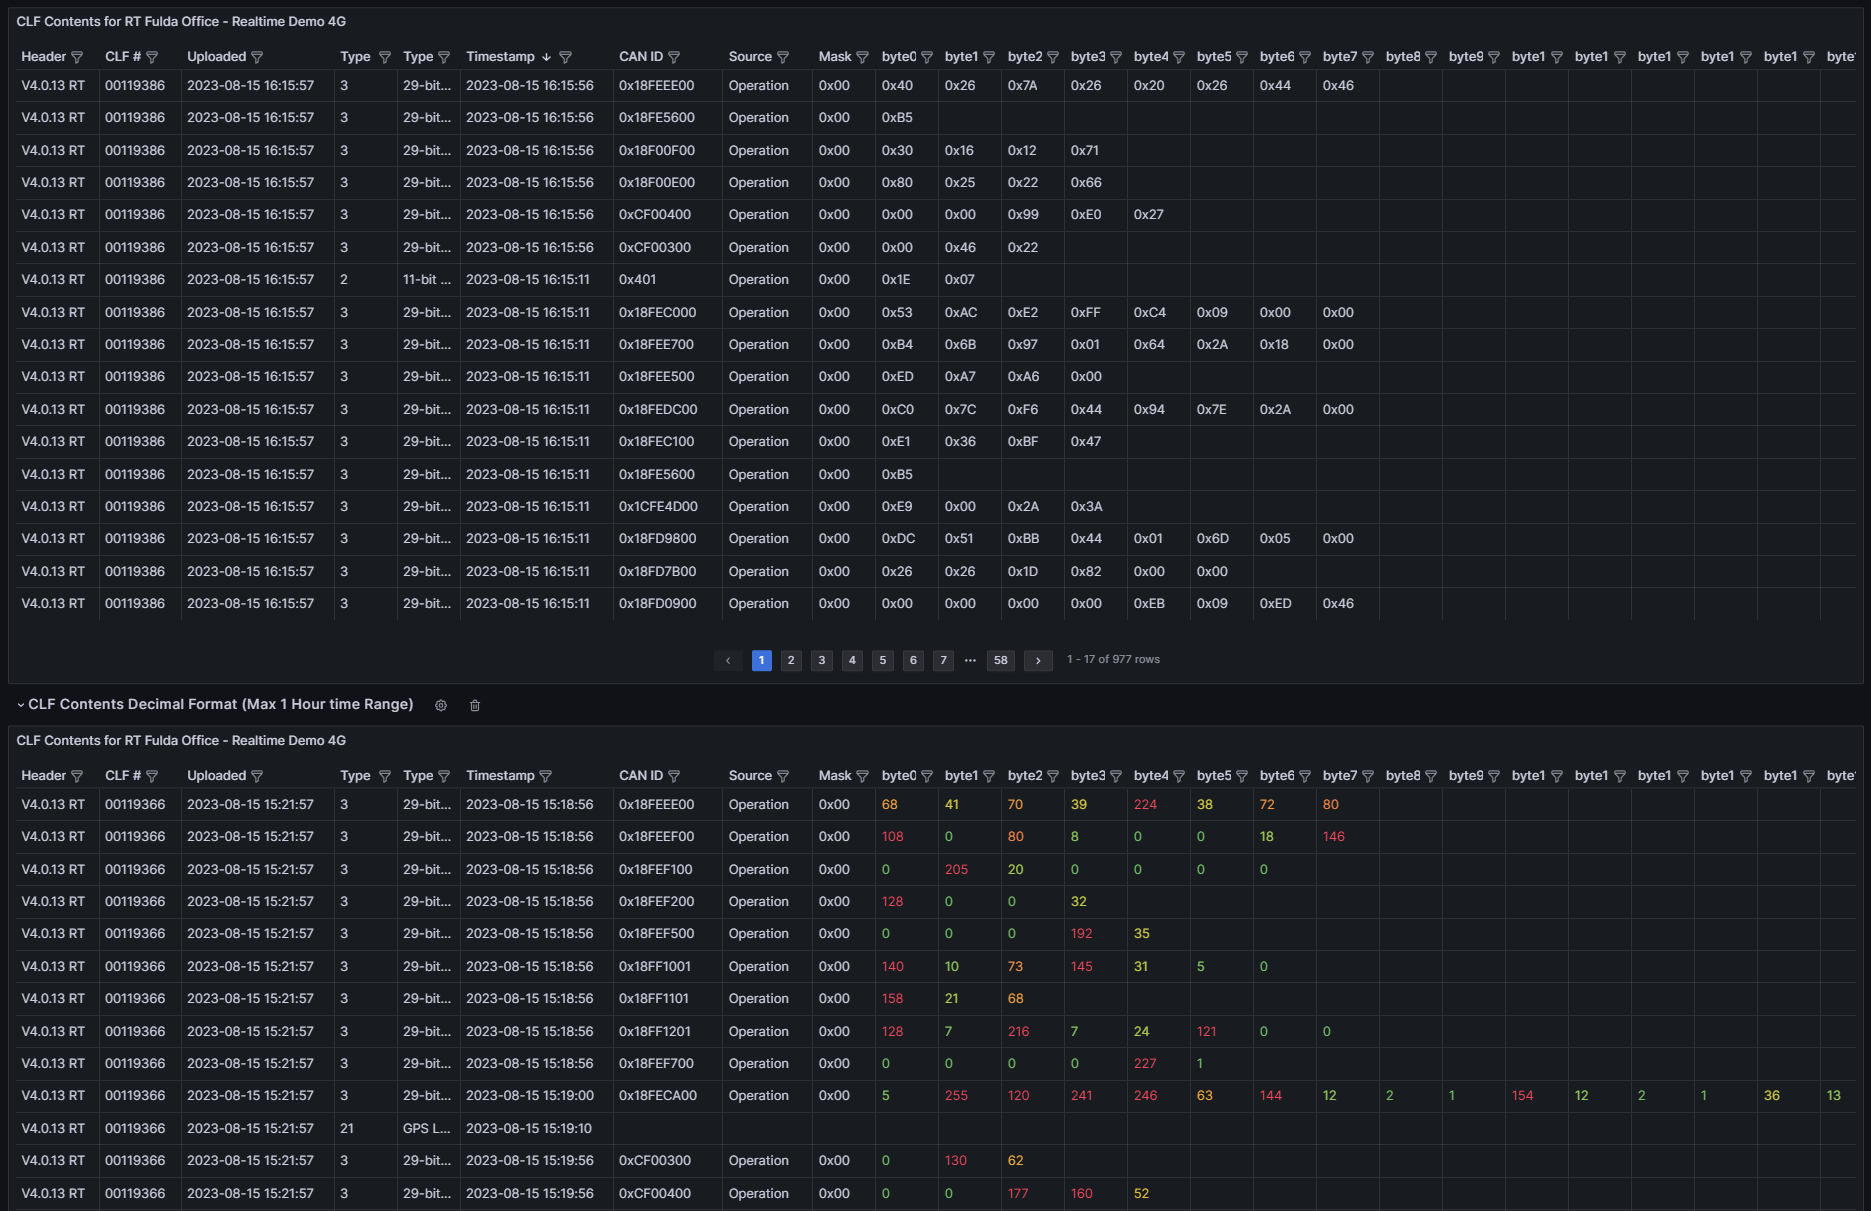
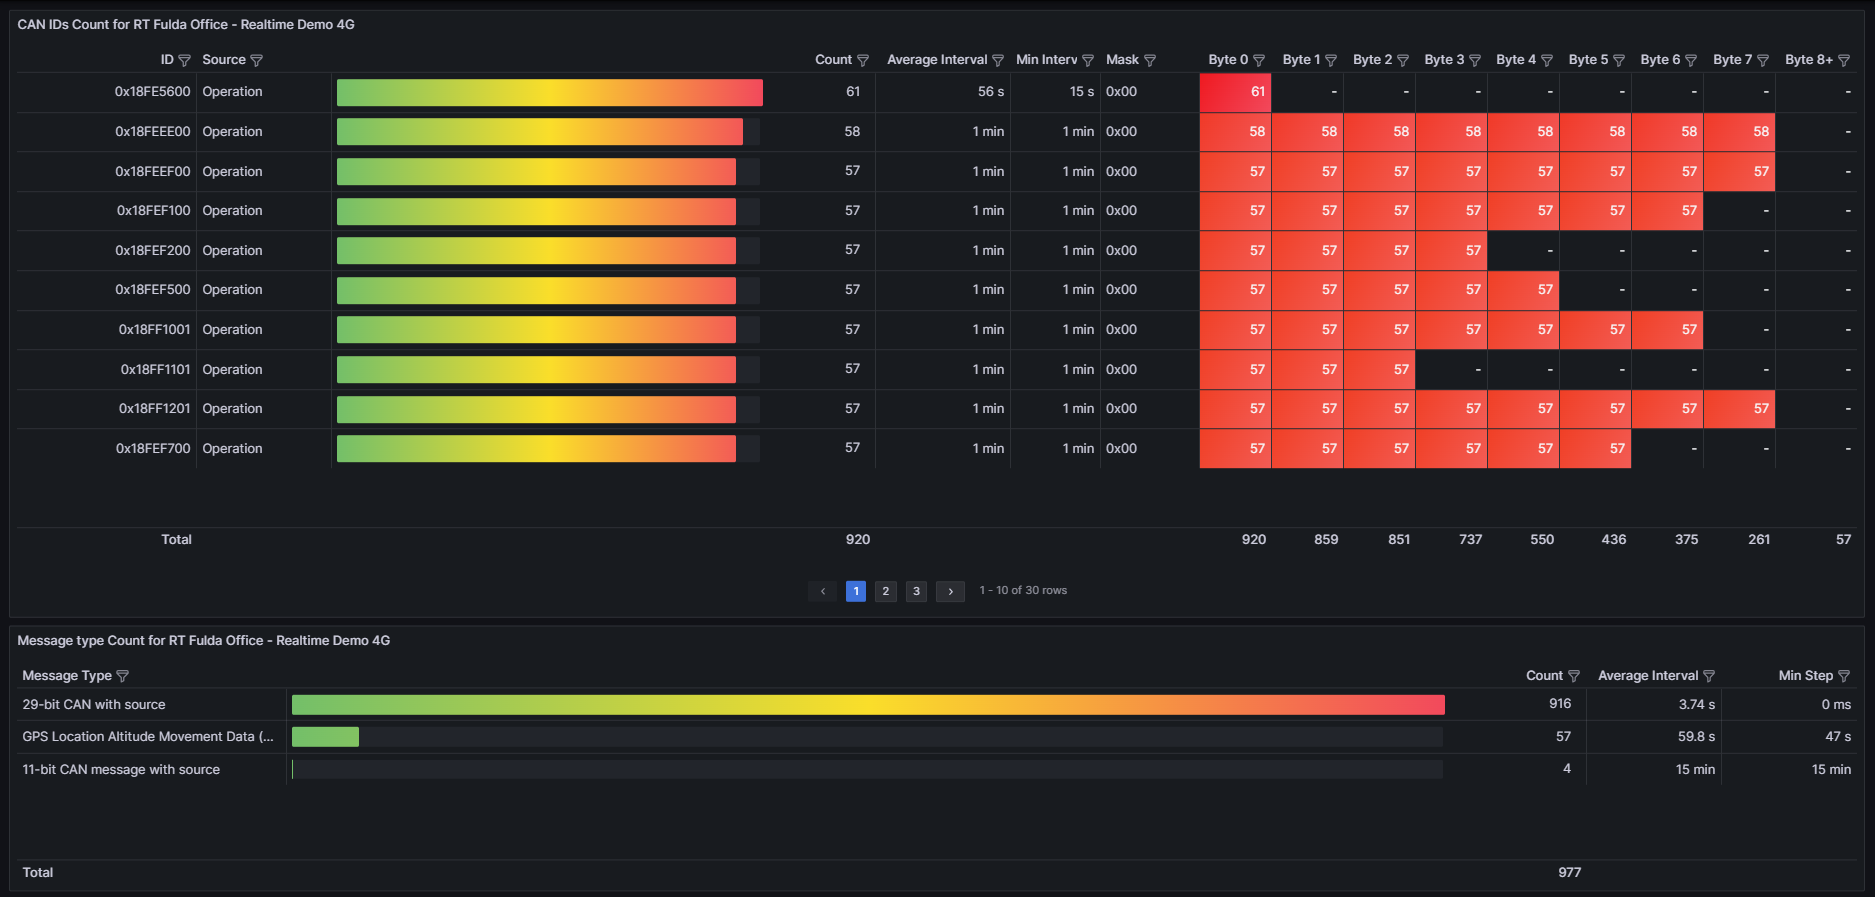
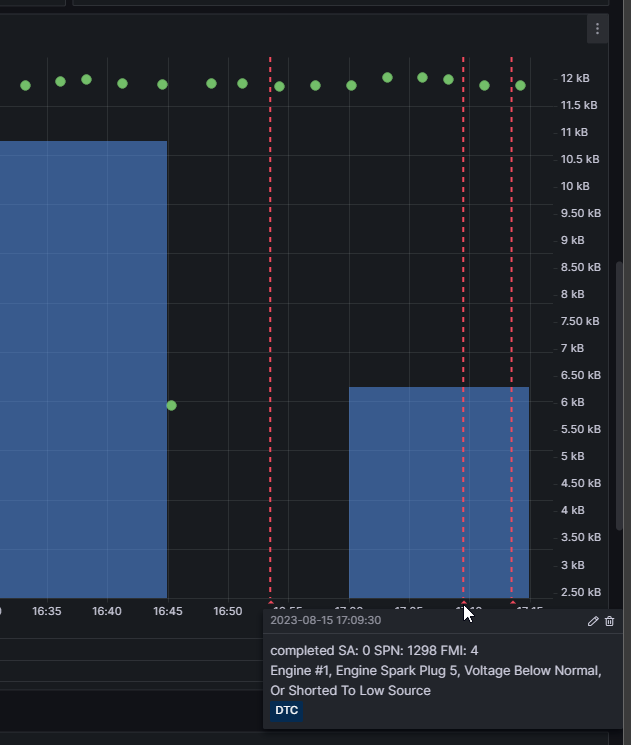
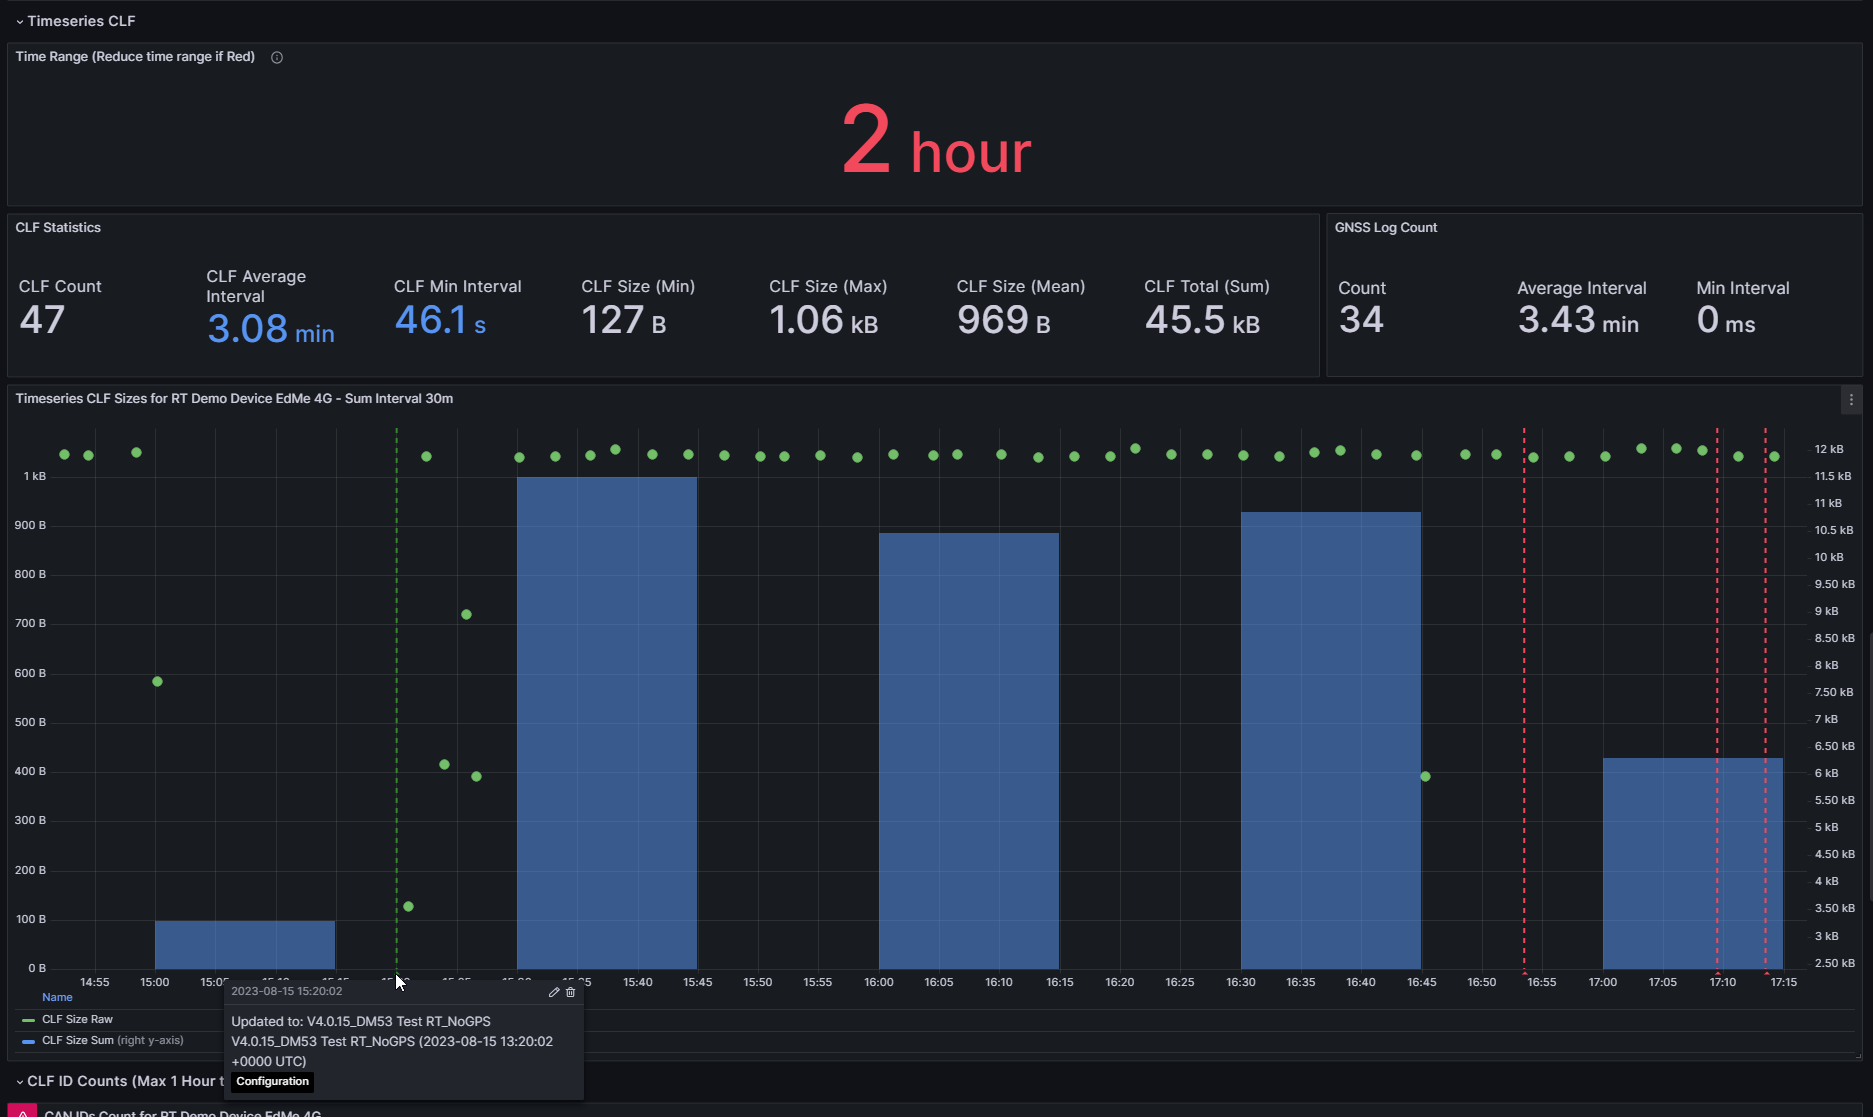
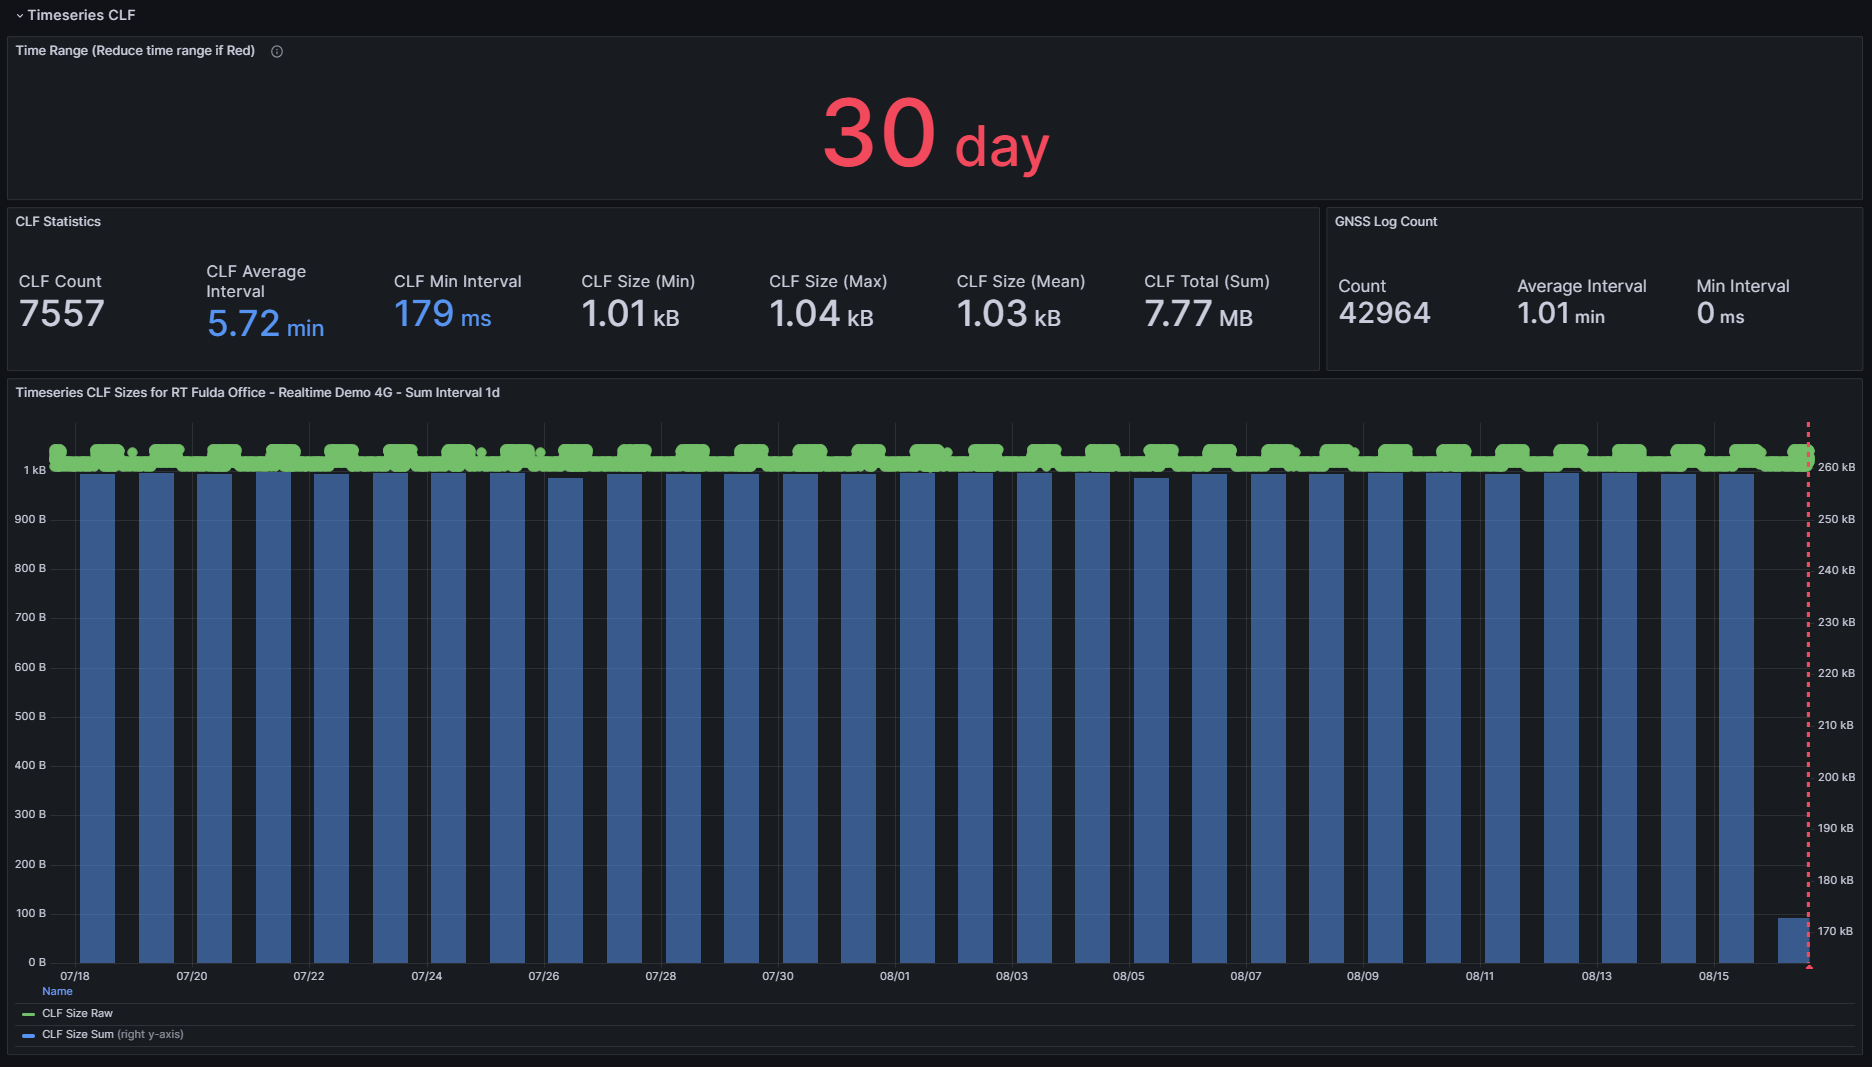
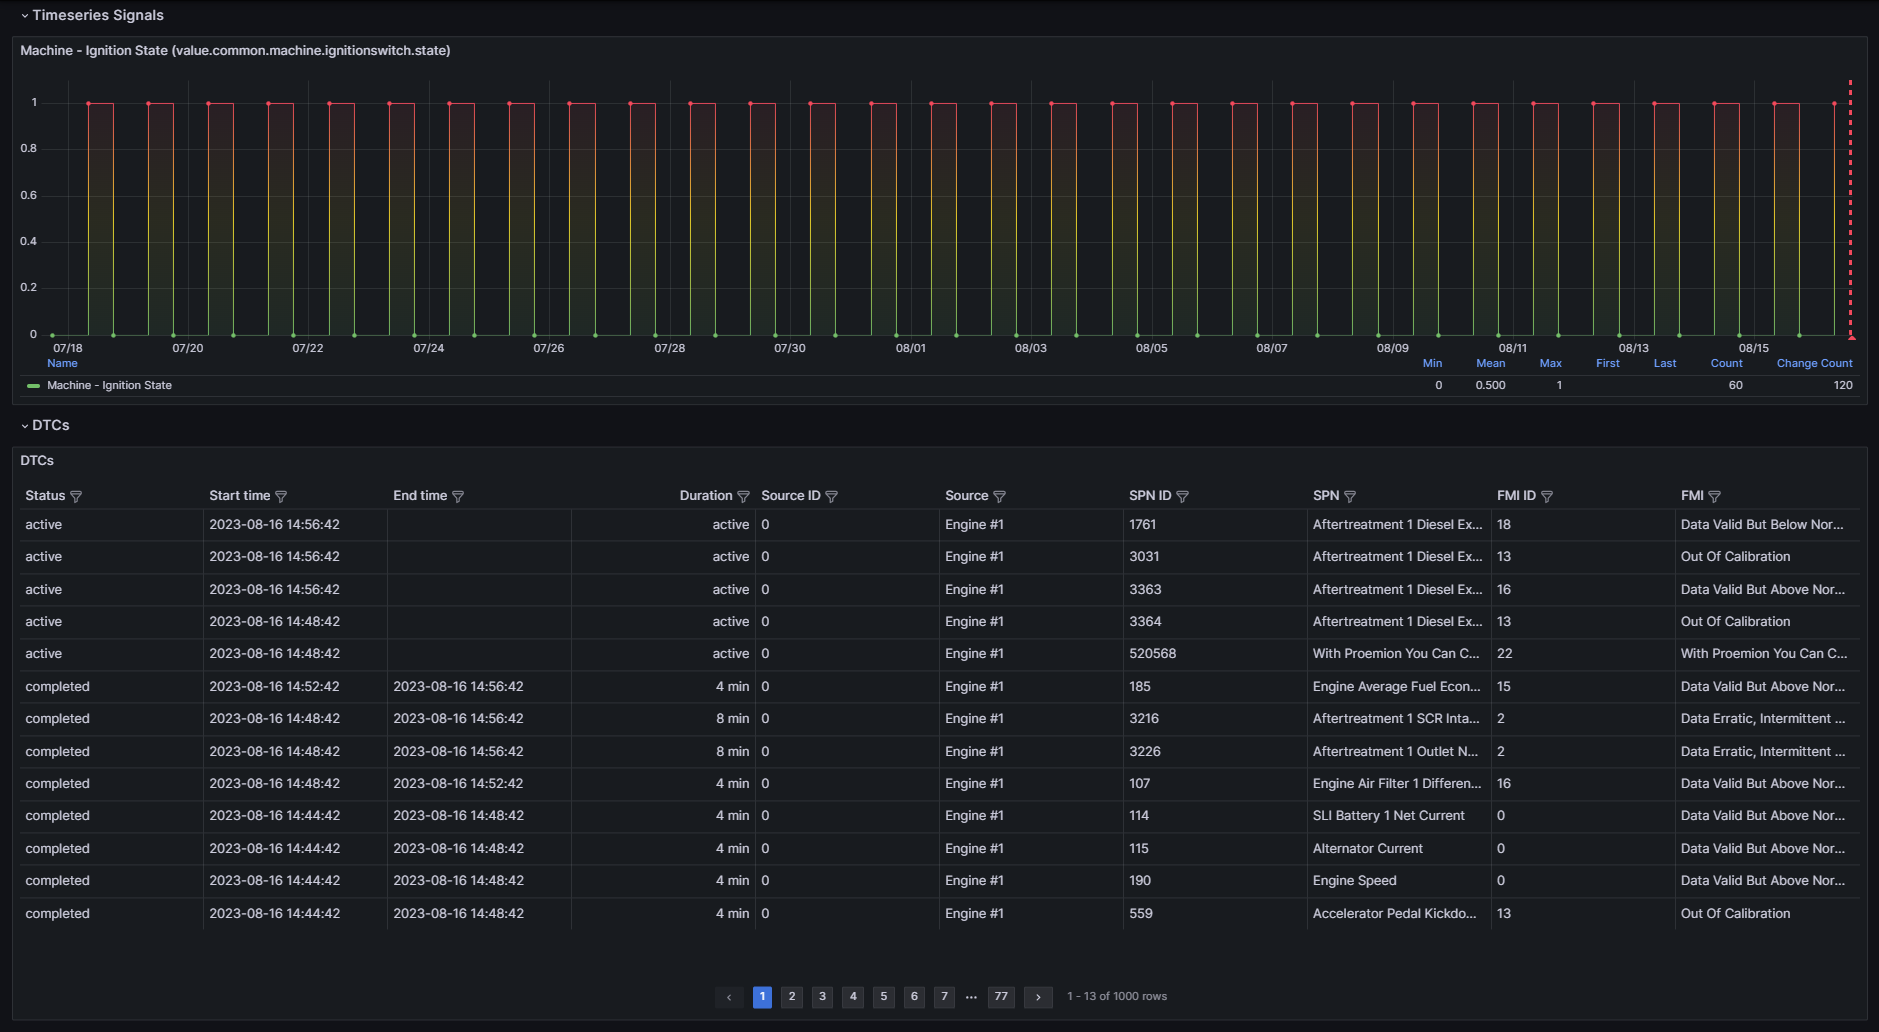
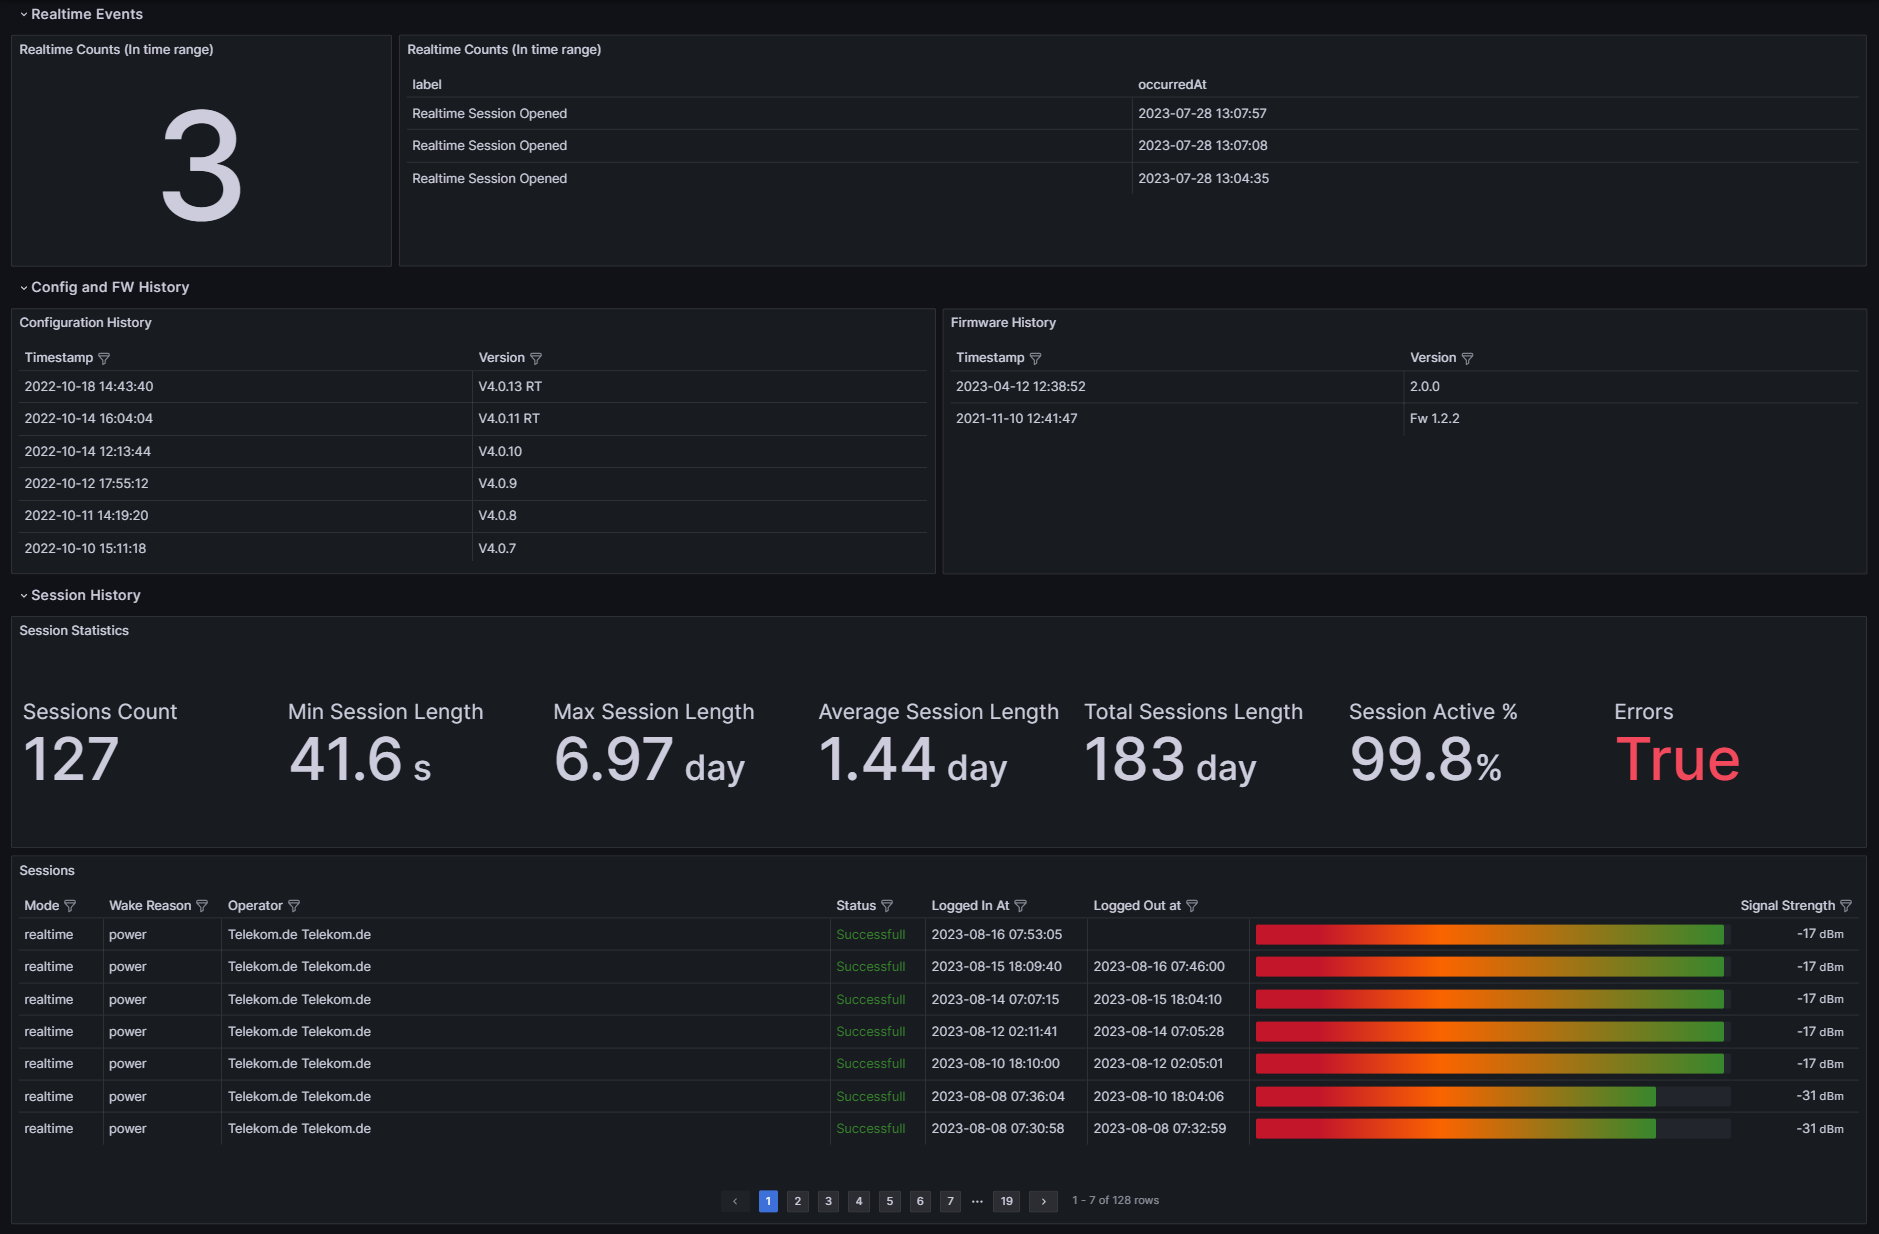
Now you can inspect the data!

If you migrate from the Proemion CLF Analyzer Dashboard
Adjust data source
Go to Data sources
Click on your chosen Datasource
Setup Authentication
- Enter the Token URL: https://dataportal.proemion.com/api/v25.7.0/auth/token
Note: Adjust the api version defined in /v25.7.0/ according to the api version you want. In our API Versioning you can always lookup the latest version.
- Enter the Token URL: https://dataportal.proemion.com/api/v25.7.0/auth/token
Setup Base URL
- Navigate to URL, Headers & Params
- Enter for Base URL: https://dataportal.proemion.com/
Setup Health Check
- Navigate to Health Check
- Enable custom health check
- Enter Health check URL: https://dataportal.proemion.com/api/v25.7.0/me
Make sure that the api version is the same that was entered in the Token URL for authentication.
Setup Reference Data
- Navigate to Reference data
- Enter as Name URL
- Enter below https://dataportal.proemion.com/ as URL
Save and Test
- Now press Save and test
- if everything was setup correctly, then the Health Check should be successfull.
Import the Dashboard
Visit https://grafana.com/grafana/dashboards/24060-proemion-telematics-analyzer/ in a new tab
Click Copy ID to clipboard in order to copy the dashboard id
Go back to Grafana and navigate to Dashboards
Click on New to open the dropdown and then click on Import
Paste the previously copied Dashboard id
Press Load
Make sure to name it accordingly and to select the datasource you created before.
You can also check if this dashboard contains the right api version.Click on Import
The Dashboard loads then automatically
How to find the Dashboard later
Navigate to Dashboards
Select the dashboard you imported
Now you can inspect the data!
Data source config
Collector config:
Upload an updated version of an exported dashboard.json file from Grafana
| Revision | Description | Created | |
|---|---|---|---|
| Download |