
System Performance Metrics (MetricsHub)
General OS performance metrics to assess the availability and performance of Linux and Windows systems. Leverages OpenTelemetry metrics collected with MetricsHub and stored in Prometheus.
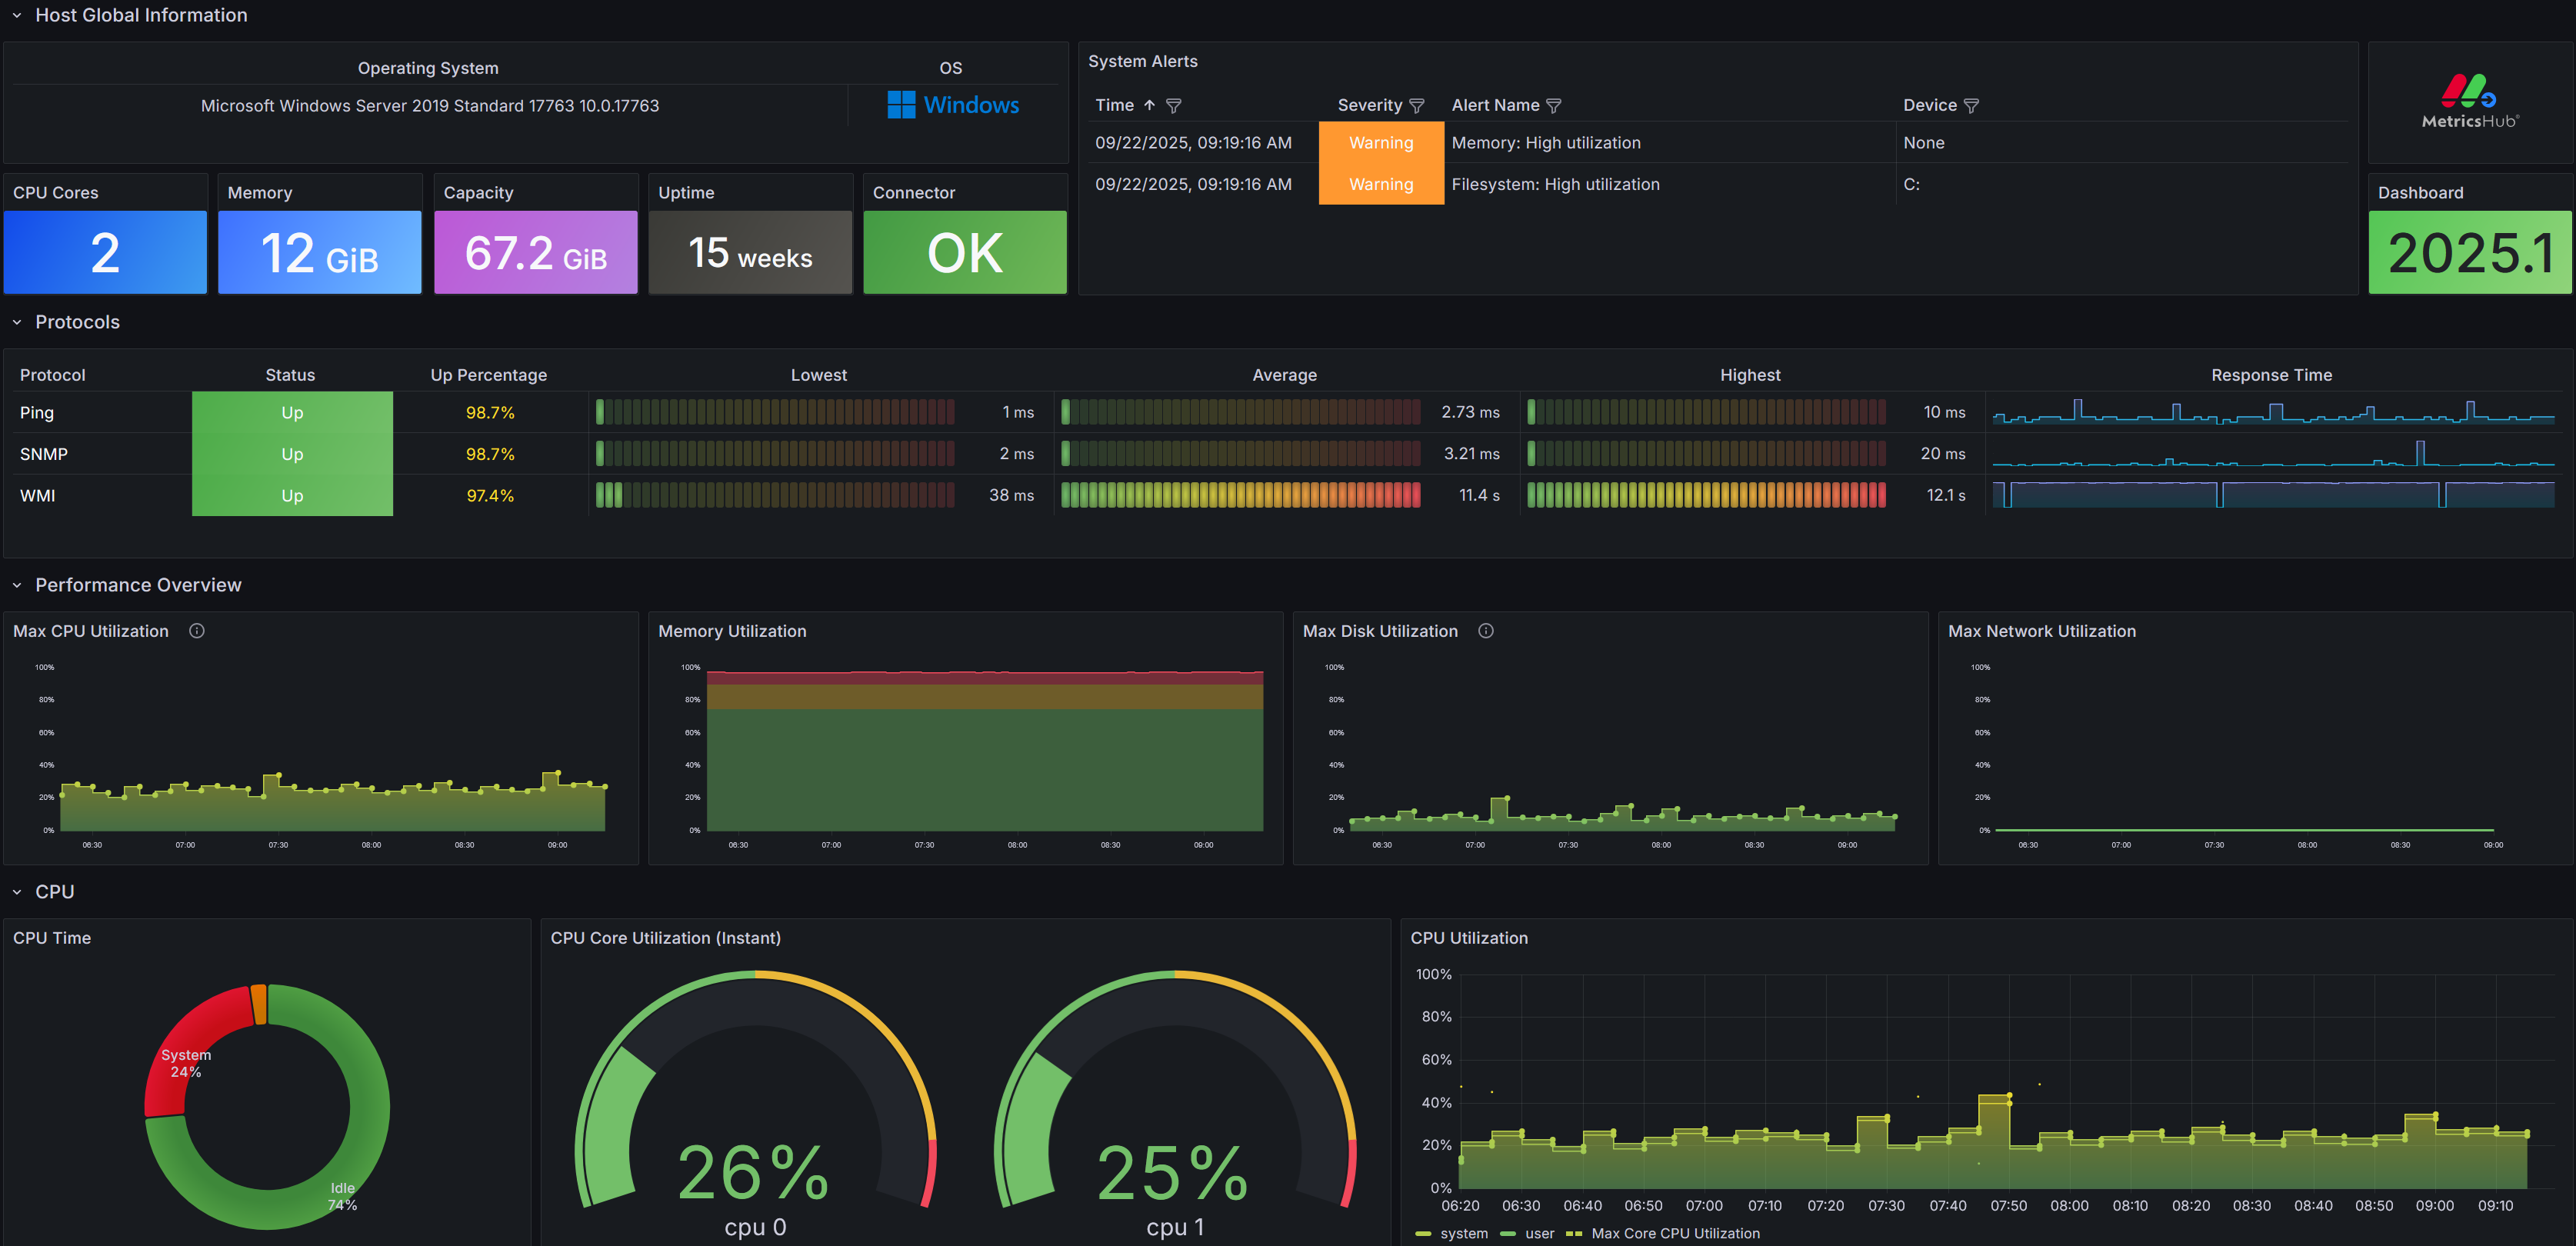
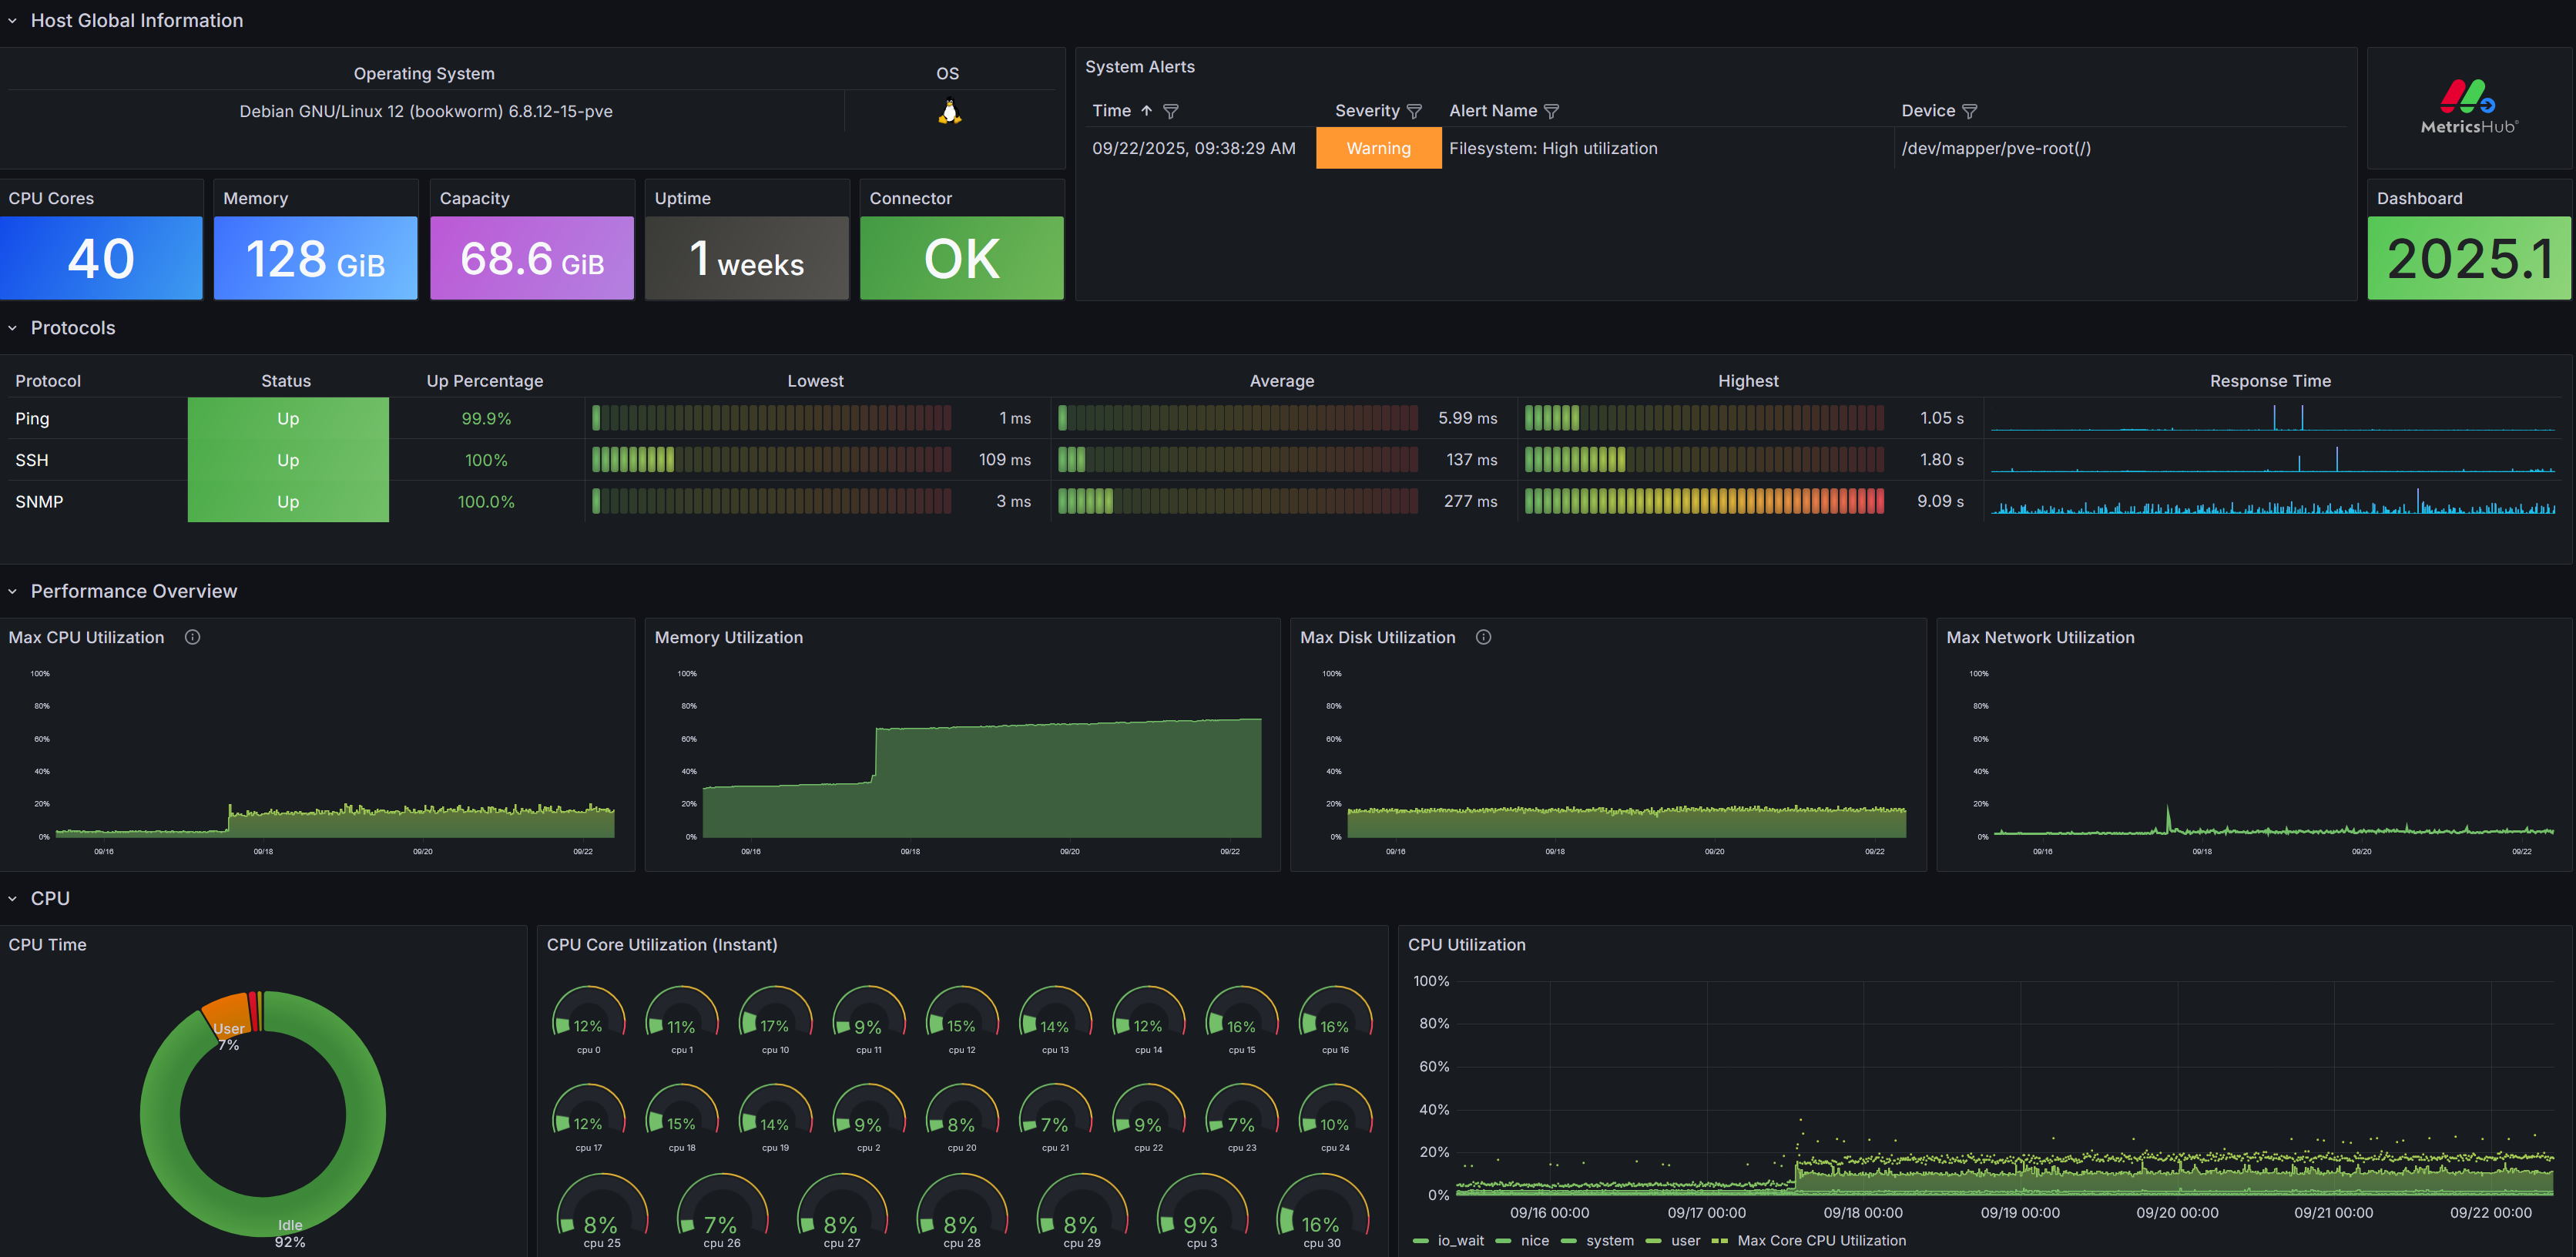
Visualize key performance indicators from Linux and Windows systems, including CPU utilization, memory consumption, file system capacity, network traffic, and protocol response times. All metrics are collected by MetricsHub® and presented in a clear, meaningful, and actionable dashboard.
Use Cases
- Track the availability and utilization of servers
- Detect performance bottlenecks
- Forecast resource needs based on trends in CPU, memory, and disk utilization
Prerequisites
- MetricsHub installed and configured
- A Prometheus server configured to expose the collected metrics
- The System Performance Metrics (MetricsHub®) Grafana dashboard
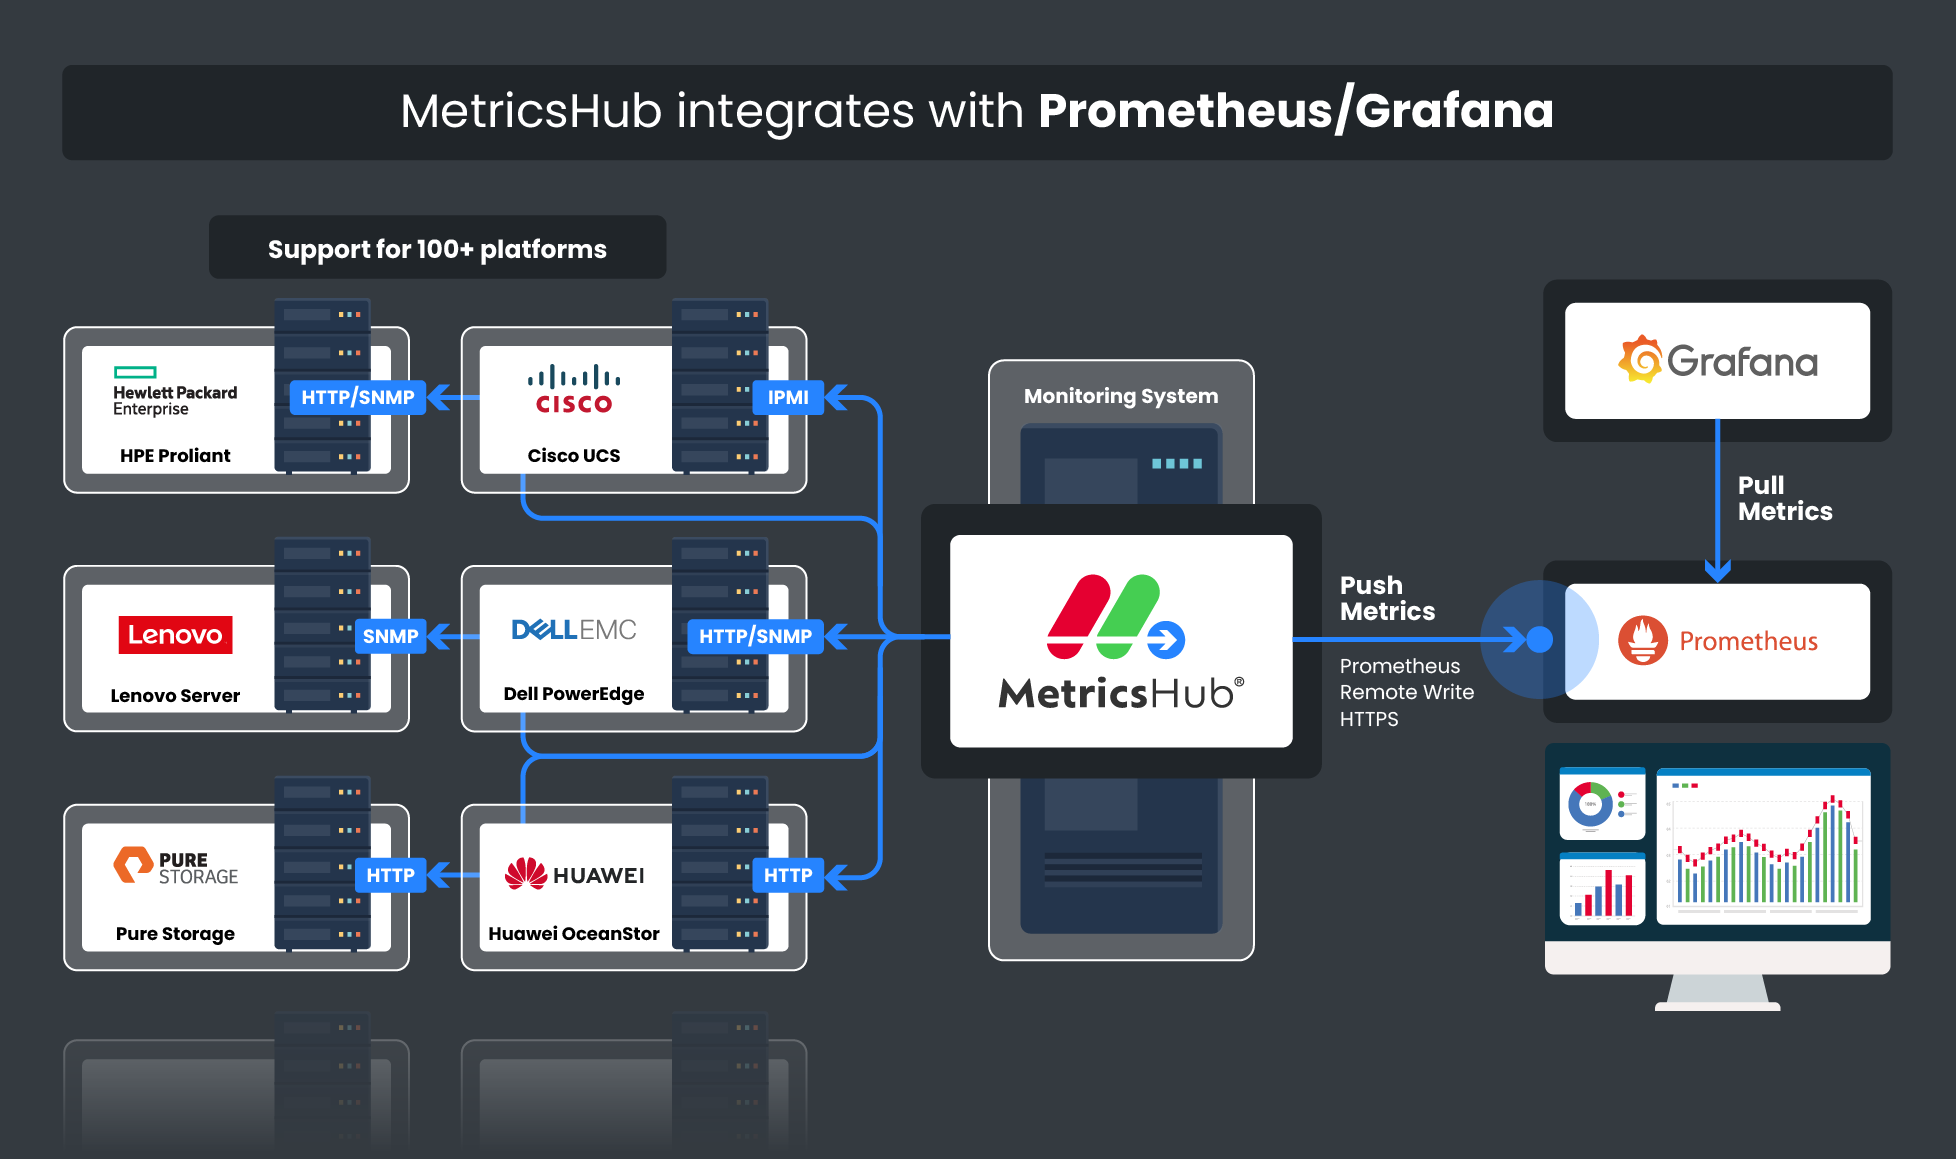
MetricsHub Overview
MetricsHub is a universal metrics collection agent for OpenTelemetry that extracts metrics from any local or remote resource - such as a host, service, or application - and sends the data to Grafana.
It is available in two editions: the Community Edition (free) and the Enterprise Edition (licensed). Both provide system monitoring capabilities; the Enterprise Edition adds seamless integration for advanced environments. You can try the Enterprise Edition free for 30 days to explore its full capabilities. Compare both editions
Key Features of System Performance Metrics (MetricsHub®) Dashboard
- Cross-platform monitoring: Visualize performance metrics from both Linux and Windows systems through a unified Grafana dashboard
- Comprehensive host overview: Access key system information at a glance, including uptime, number of CPU cores, memory size, disk capacity, and connector status.
- Protocol health and responsiveness: Monitor the availability and response times of key protocols like HTTP, Ping, SNMP, SSH, WBEM, and WMI.
- Detailed performance metrics: Gain insight into CPU usage, memory usage, filesystem usage, and network traffic.
Setup and Configuration
Data source config
Collector config:
Upload an updated version of an exported dashboard.json file from Grafana
| Revision | Description | Created | |
|---|---|---|---|
| Download |