
Crowdsec monitoring
CrowdSec monitoring dashboard with real-time insights on blocked pods, attack scenarios, banned IPs, and security decisions.
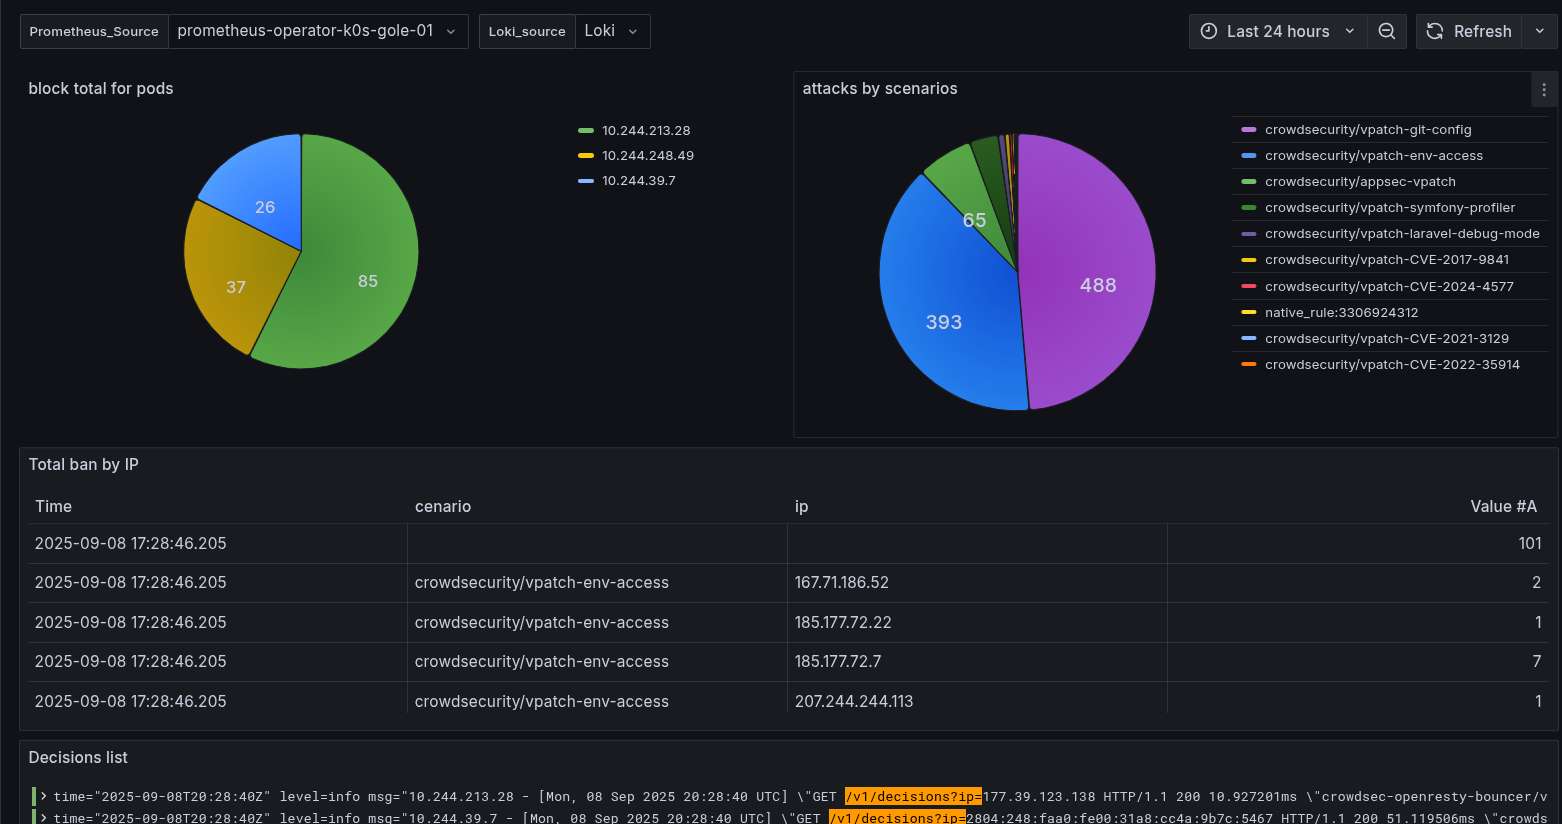
This Grafana dashboard provides a comprehensive overview of CrowdSec activity within the monitored environment. It visualizes blocked connections, attack scenarios, and IP-based bans in real-time.
Block Total for Pods: Displays the number of blocked attempts per pod, helping to identify which pods are under the most attack.
Attacks by Scenarios: Shows the distribution of attacks based on CrowdSec detection scenarios, giving insights into the most frequent threat types.
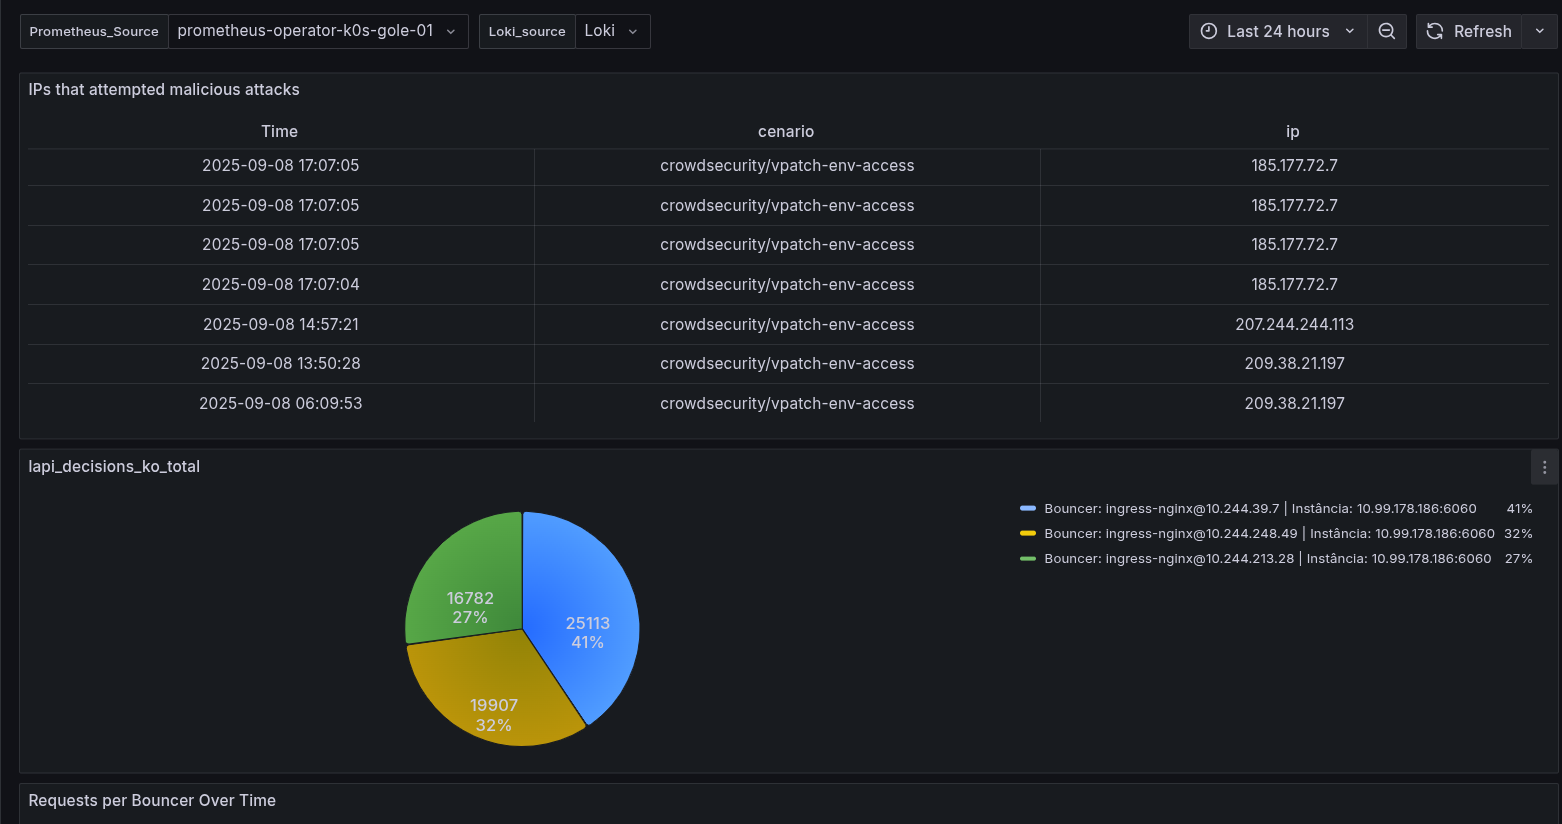
Total Ban by IP: Lists the IP addresses that have been blocked along with the scenario and total occurrences, enabling easy tracking of malicious sources.
Decisions Log: Captures detailed decision logs with timestamps and request data, providing full transparency of CrowdSec actions.
This dashboard is essential for security teams to quickly monitor, analyze, and respond to potential threats in the infrastructure.
Data source config
Collector config:
Upload an updated version of an exported dashboard.json file from Grafana
| Revision | Description | Created | |
|---|---|---|---|
| Download |