
AI Foundry
Visualization for monitoring Azure AI Foundry usage and latency across model deployments in a single Grafana dashboard.

AI Foundry
Visulization for monitoring Azure AI Foundry usage and latency across model deployments in a single Grafana dashboard. Try this for free inside Azure portal: http://aka.ms/amg/dash/ai-foundry
Screenshots


Issues and feedback
https://github.com/1w2w3y/grafana-dashboards/issues
Features
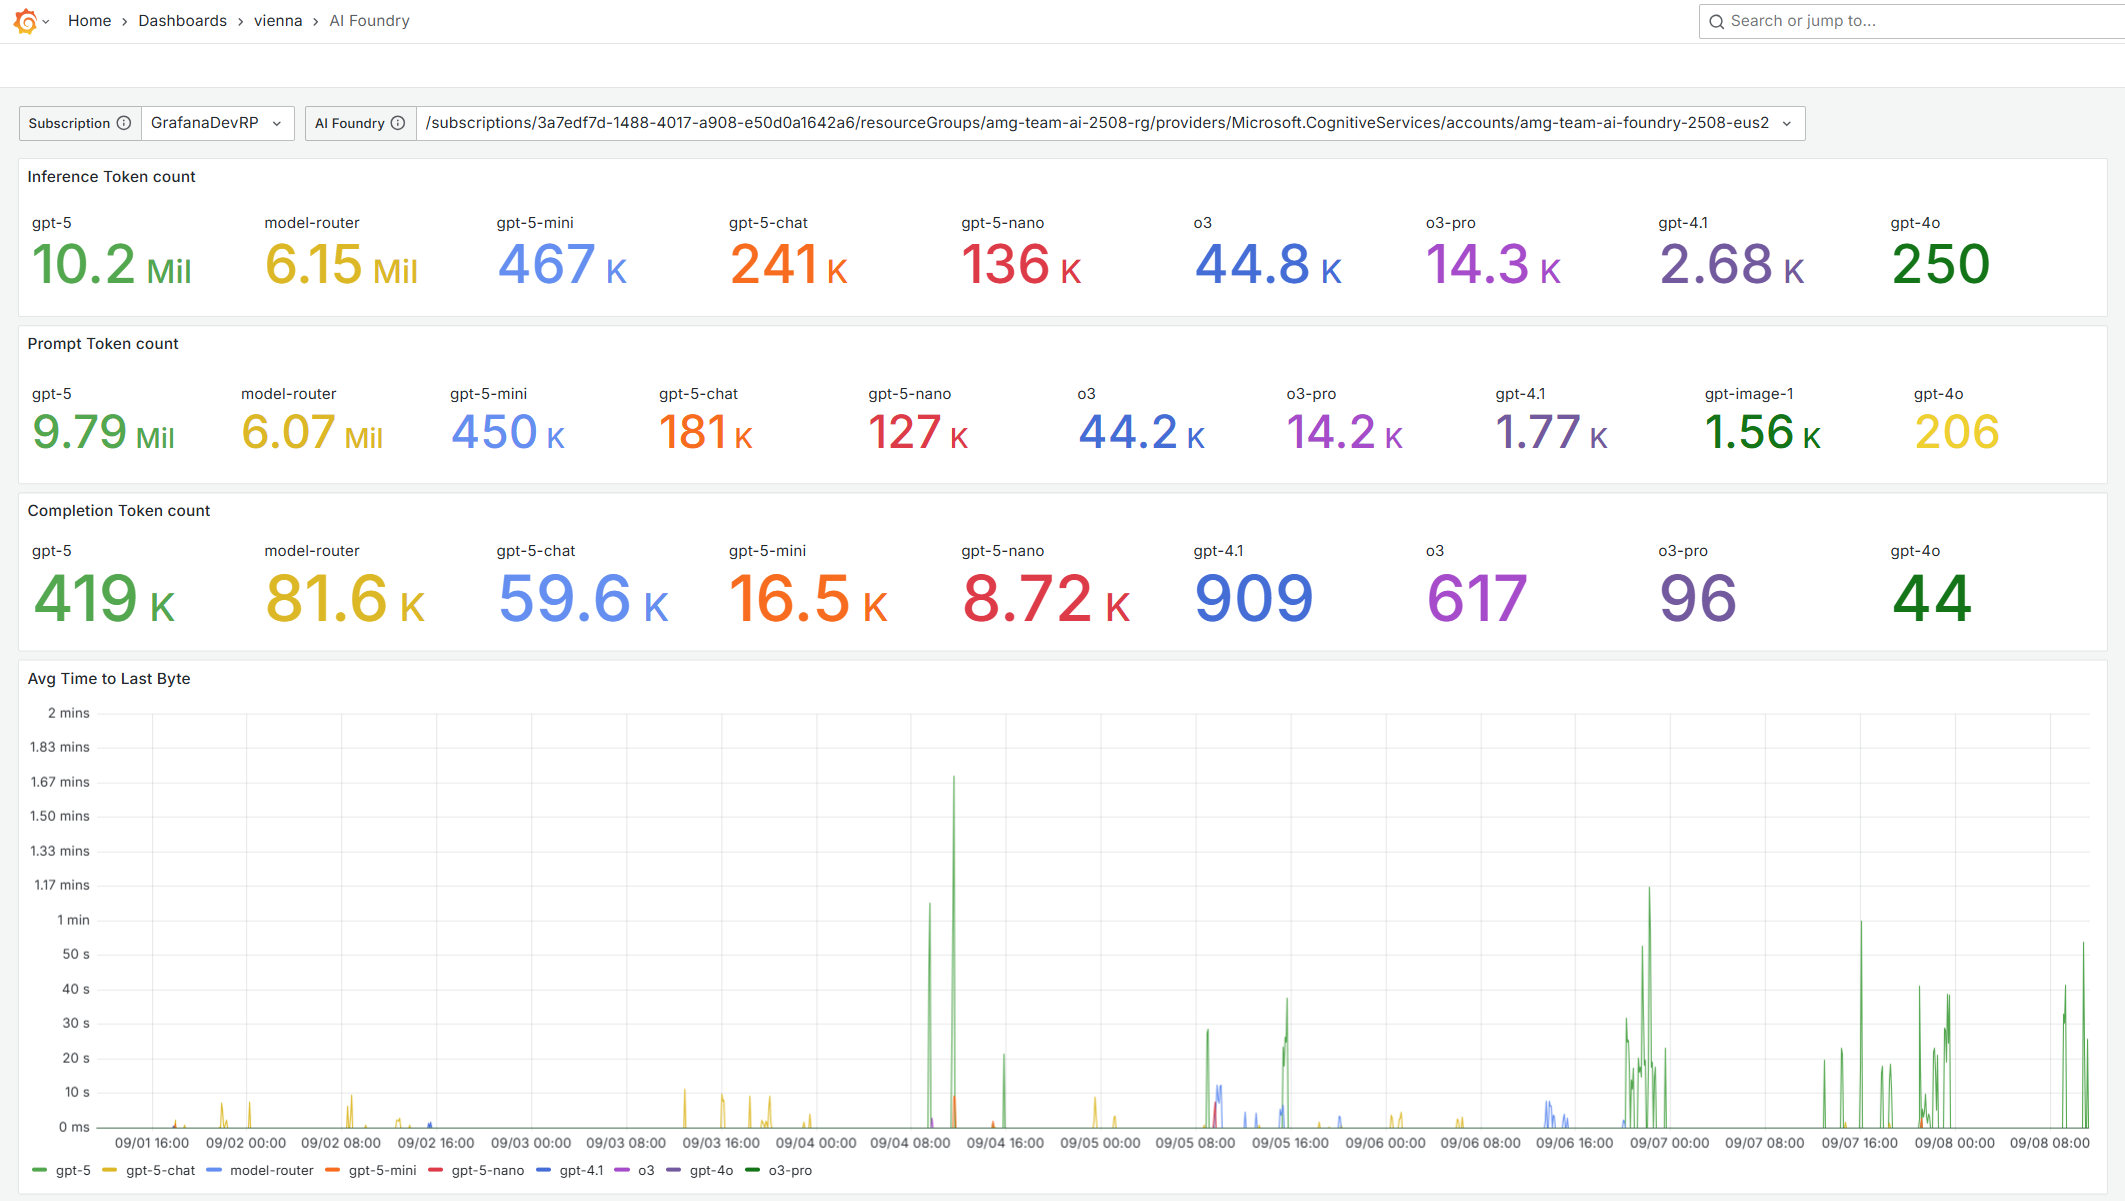
- Totals at a glance
- Inference Token count (Azure Monitor metric
TokenTransaction) - Prompt Token count (metric
ProcessedPromptTokens) - Completion Token count (metric
GeneratedTokens)
- Inference Token count (Azure Monitor metric
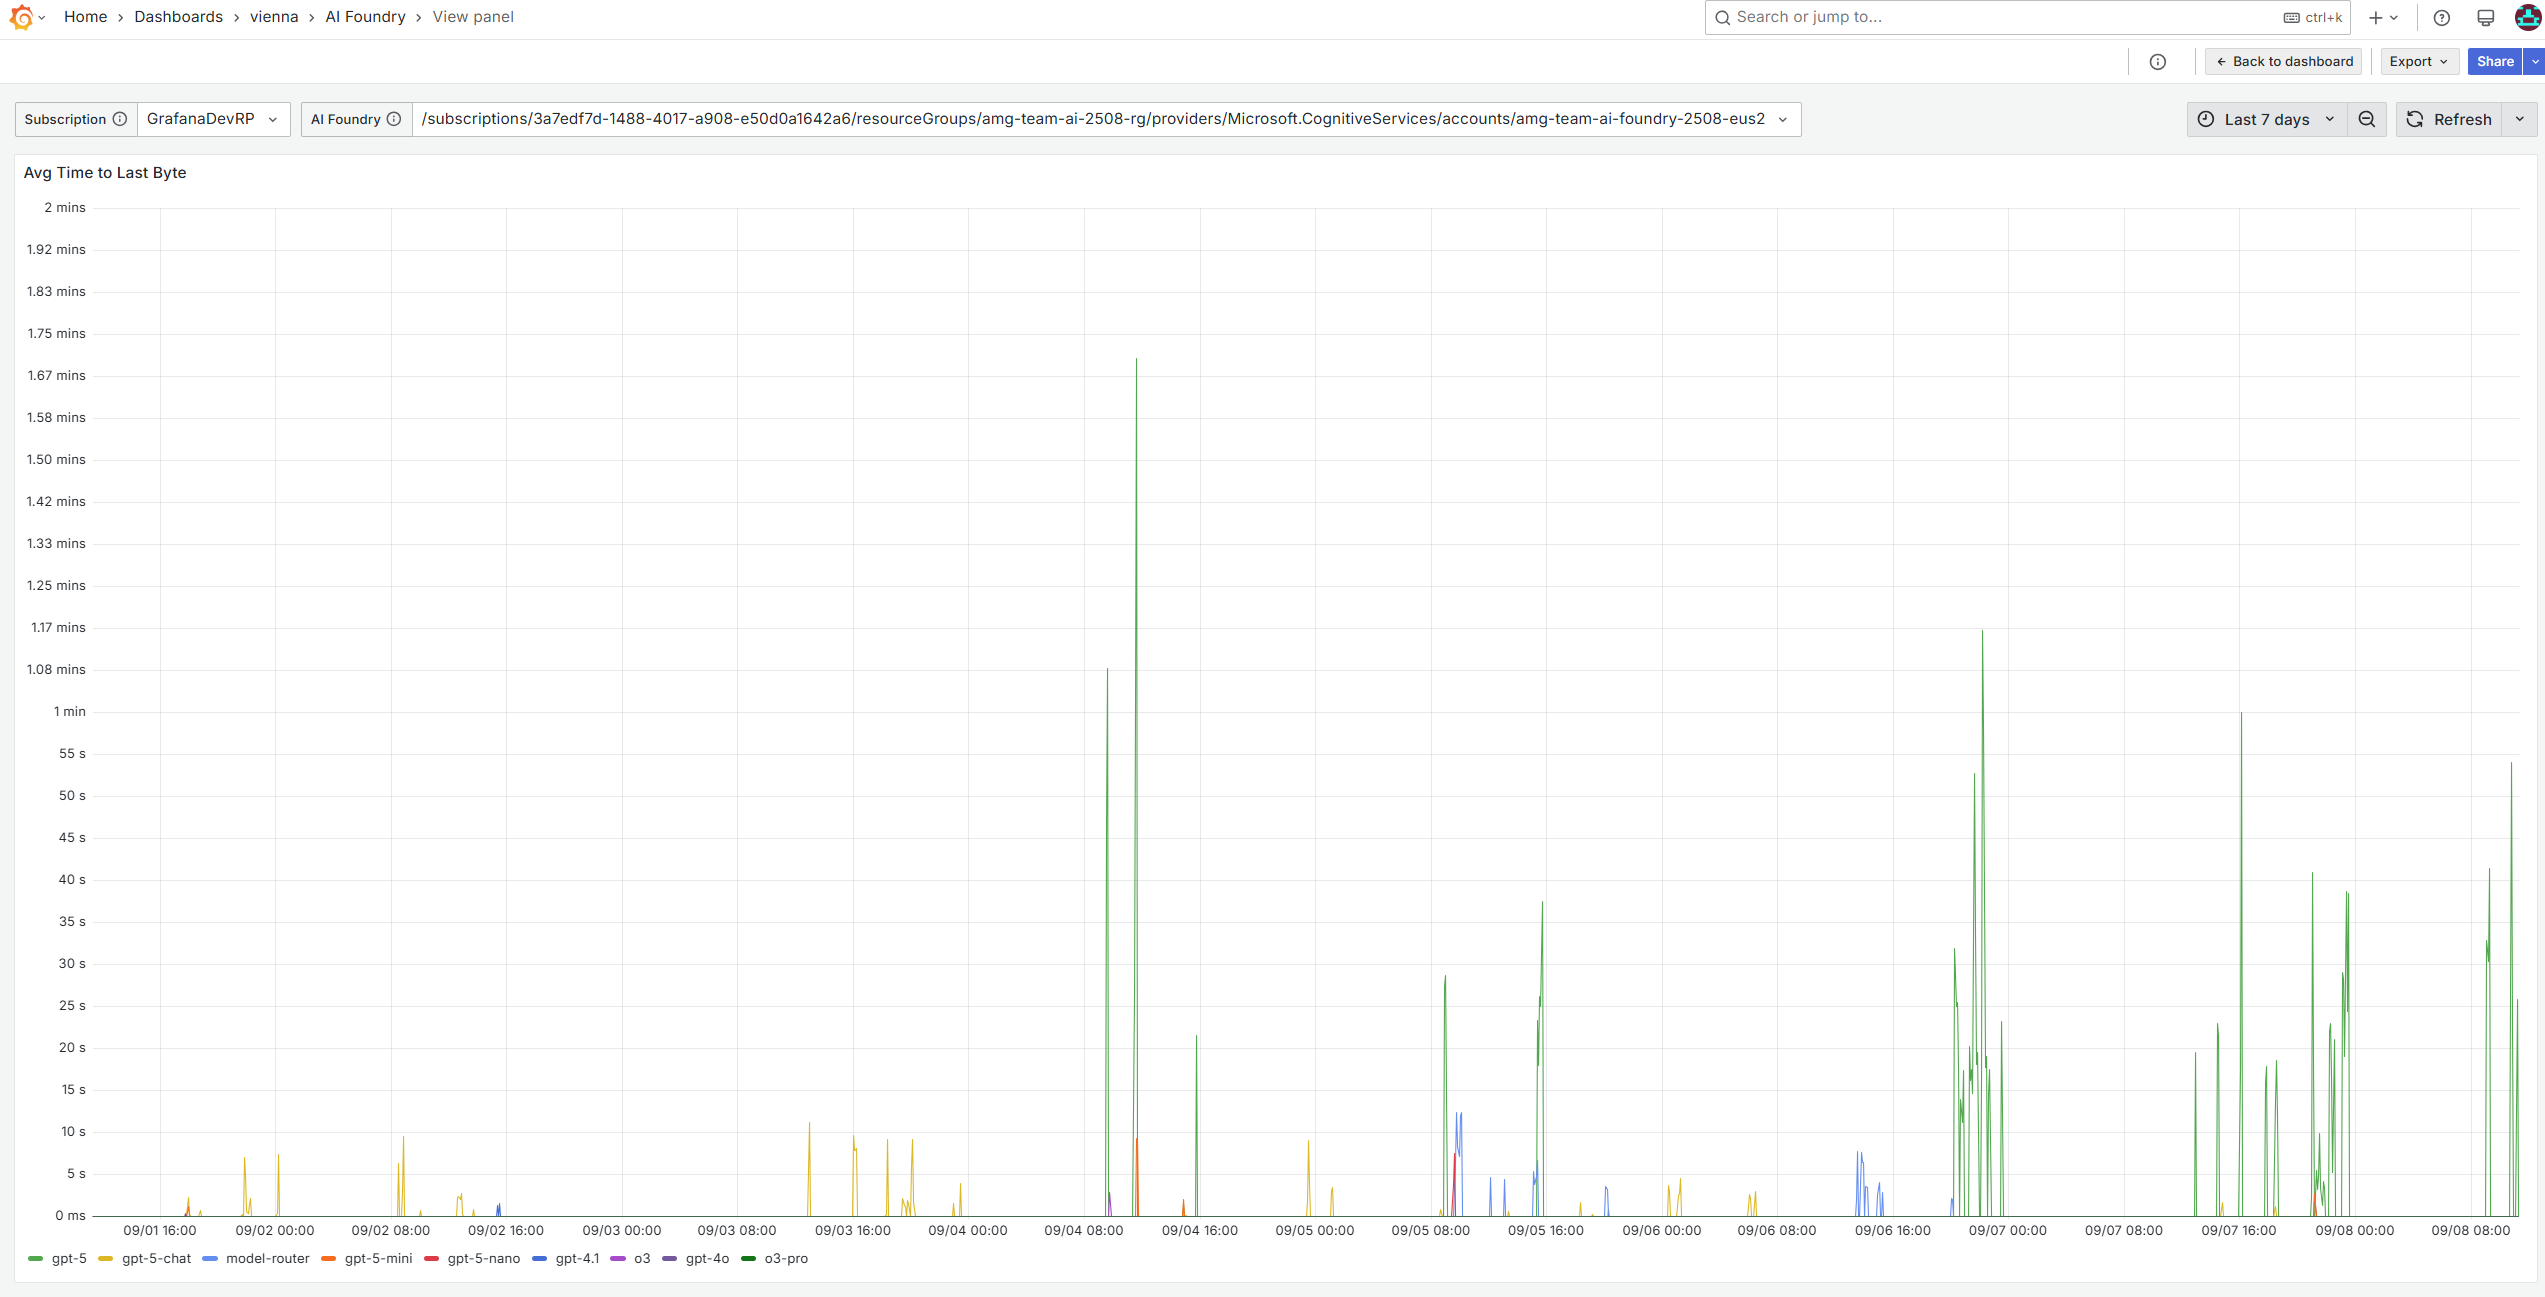
- Latency trend
- Average Time to Last Byte (metric
AzureOpenAITTLTInMS) to observe end‑to‑end response latency by model deployment.
- Average Time to Last Byte (metric
- Request and token trends
- Time series for Requests (metric
AzureOpenAIRequests) - Time series for Inference, Prompt, and Completion tokens over time
- Time series for Requests (metric
- Per‑deployment breakdown
- All counters and time series are split by
ModelDeploymentName, so you can compare individual deployments (for example:gpt-5,gpt-4.1,o3, etc.).
- All counters and time series are split by
- Flexible scoping
- Dashboard variables let you pick the Subscription and the target AI Foundry resource. The dashboard automatically derives the resource group, name, and region for accurate metric queries.
- Defaults optimized for operations
- Default time range is the last 7 days, with legends and units configured for quick triage.
How it works?
- Grafana queries Azure Monitor Metrics for the Azure AI Foundry (Cognitive Services) account using the Grafana Azure Monitor data source.
- The dashboard targets the
Microsoft.CognitiveServices/accountsresource type and reads the following metrics:AzureOpenAIRequests— number of requests received.TokenTransaction— processed inference tokens.ProcessedPromptTokens— prompt tokens processed.GeneratedTokens— completion tokens generated.AzureOpenAITTLTInMS— average time to last byte in milliseconds.
- All queries group by the
ModelDeploymentNamedimension so you can see usage and performance per model deployment. - Variables:
subscriptionId— selected subscription.aiFoundryResourceId— the Azure AI Foundry resource (resolved via Azure Resource Graph).- Hidden helper variables (
resourceGroup,resourceName,region) are resolved automatically from the selected resource.
- Aggregations:
- Token and request panels use
Totalover the selected time range. - Latency uses
Average.
- Token and request panels use
Requirements
- Grafana 11.6+ with the Azure Monitor data source configured with access to the subscription that contains your AI Foundry account.
Change history
- 9/8/2025 Initial version for Grafana 11.6
- 9/30/2025 Update to more suitable metrics and improved layout
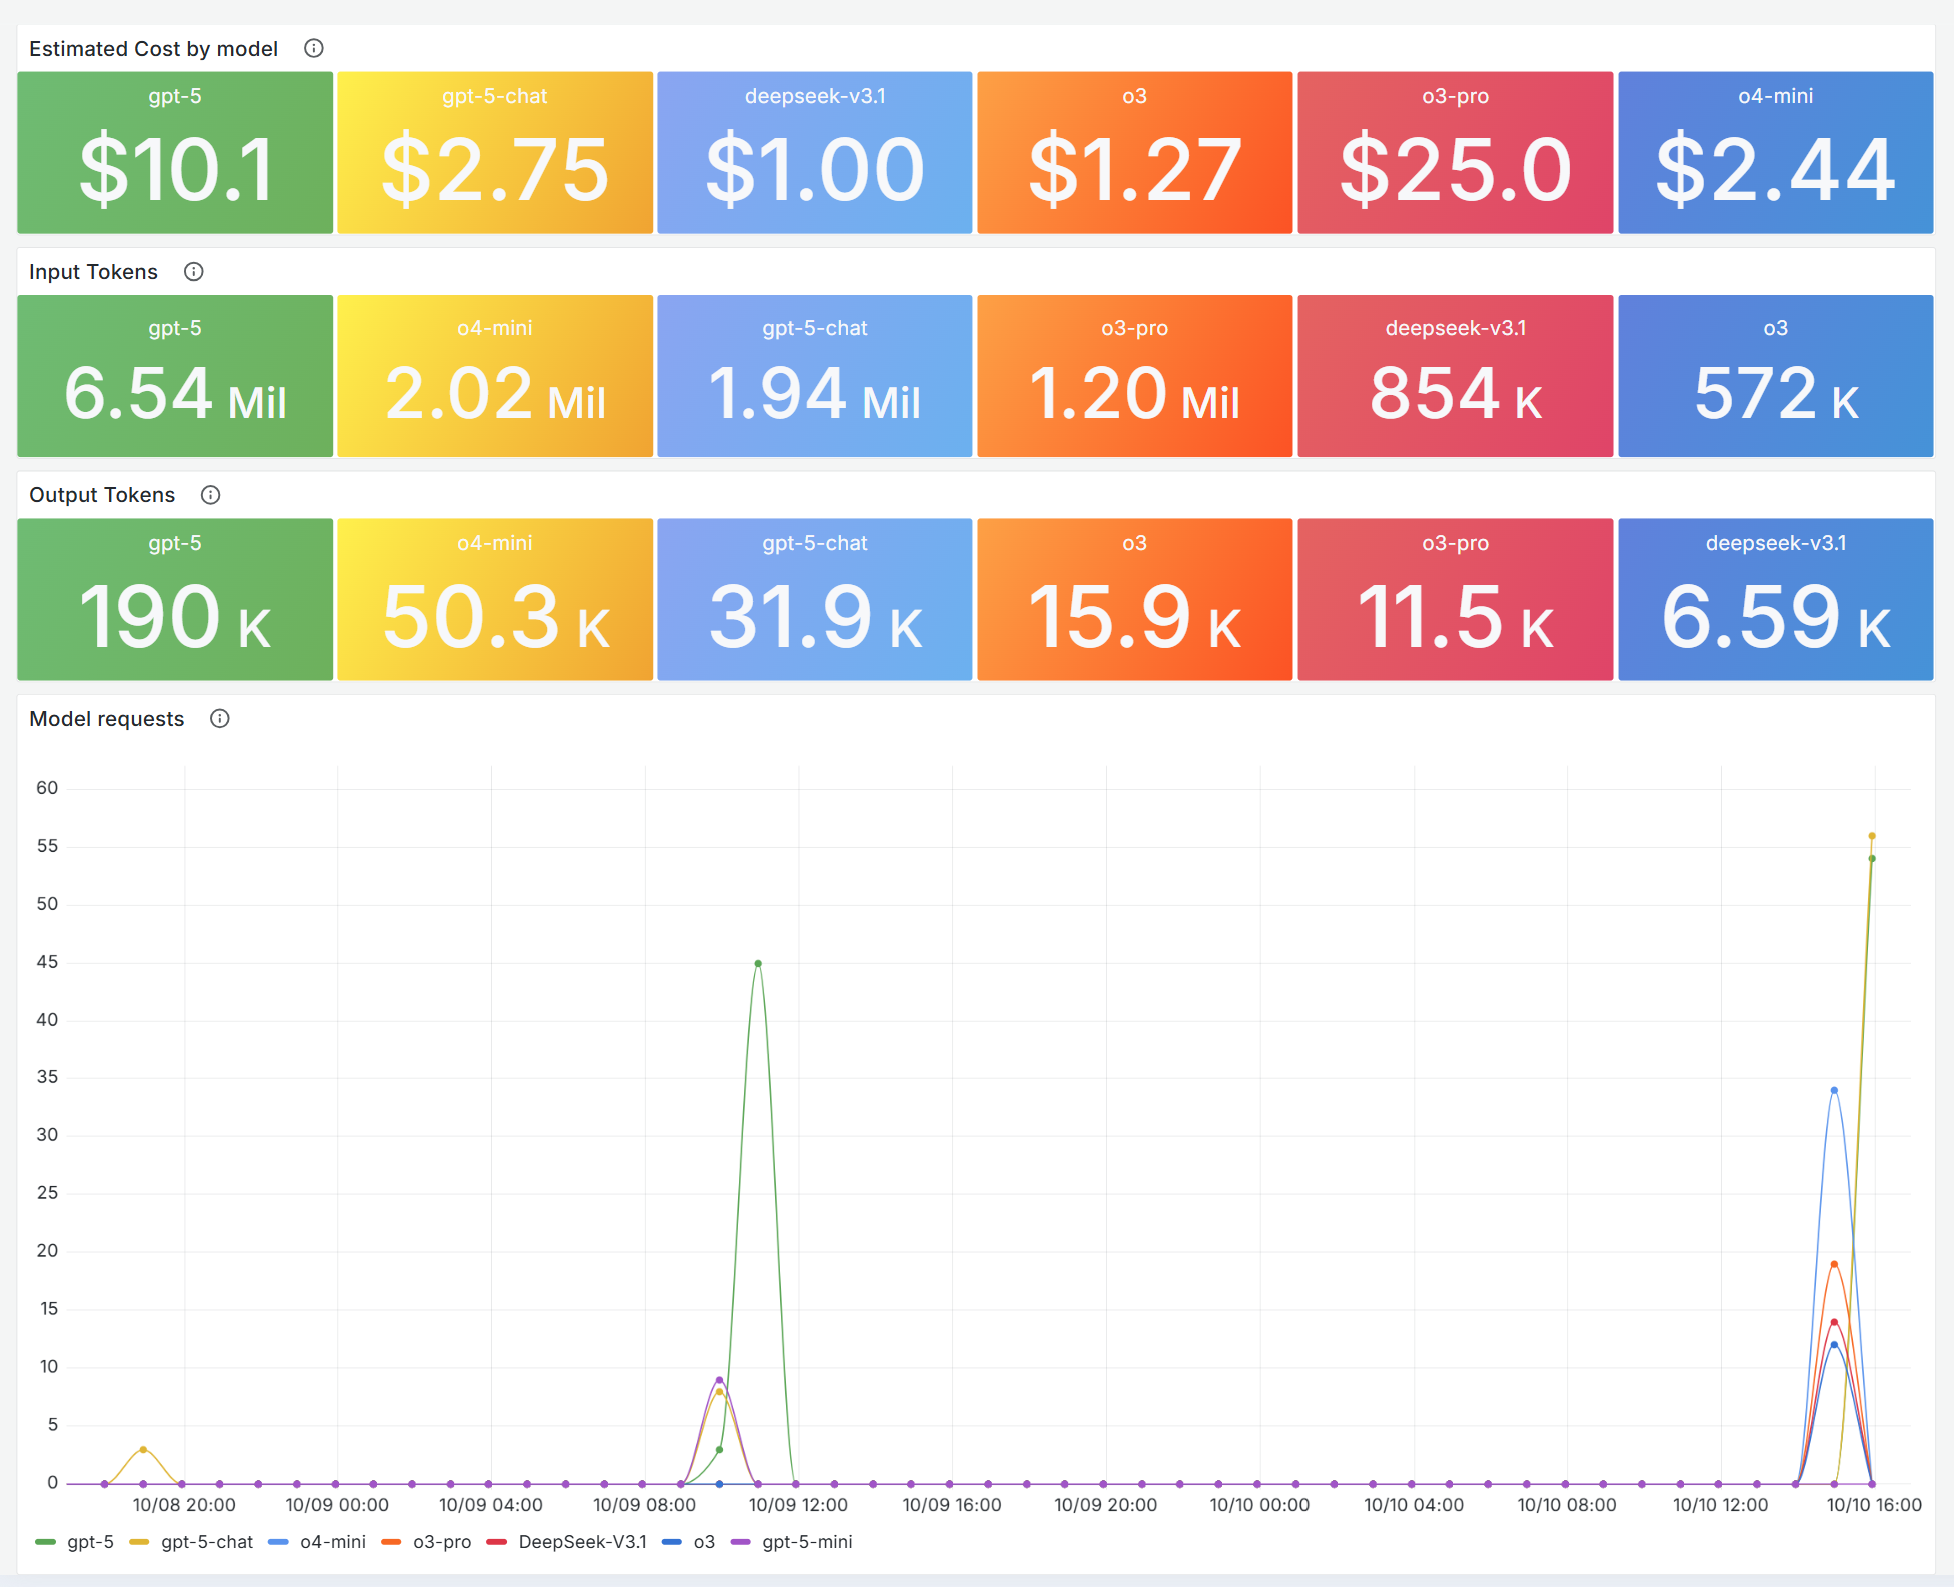
- 10/10/2025 add estimated cost panel
- 1/5/2026 update estimated cost with more models like GPT-5.2 and Claude Opus 4.5; add a price scale variable for adjusting cost estimates based on negotiated pricing.
- 1/15/2026 add cost calculation for GPT-5.2-codex; add labels with values for each panel
Data source config
Collector type:
Collector plugins:
Collector config:
Revisions
Upload an updated version of an exported dashboard.json file from Grafana
| Revision | Description | Created | |
|---|---|---|---|
| Download |