
Google Cloud Build
Unified dashboard for metrics about CI/CD pipelines in Grafana (https://github.com/GoogleCloudPlatform/cloud-build-notifiers/pull/225)
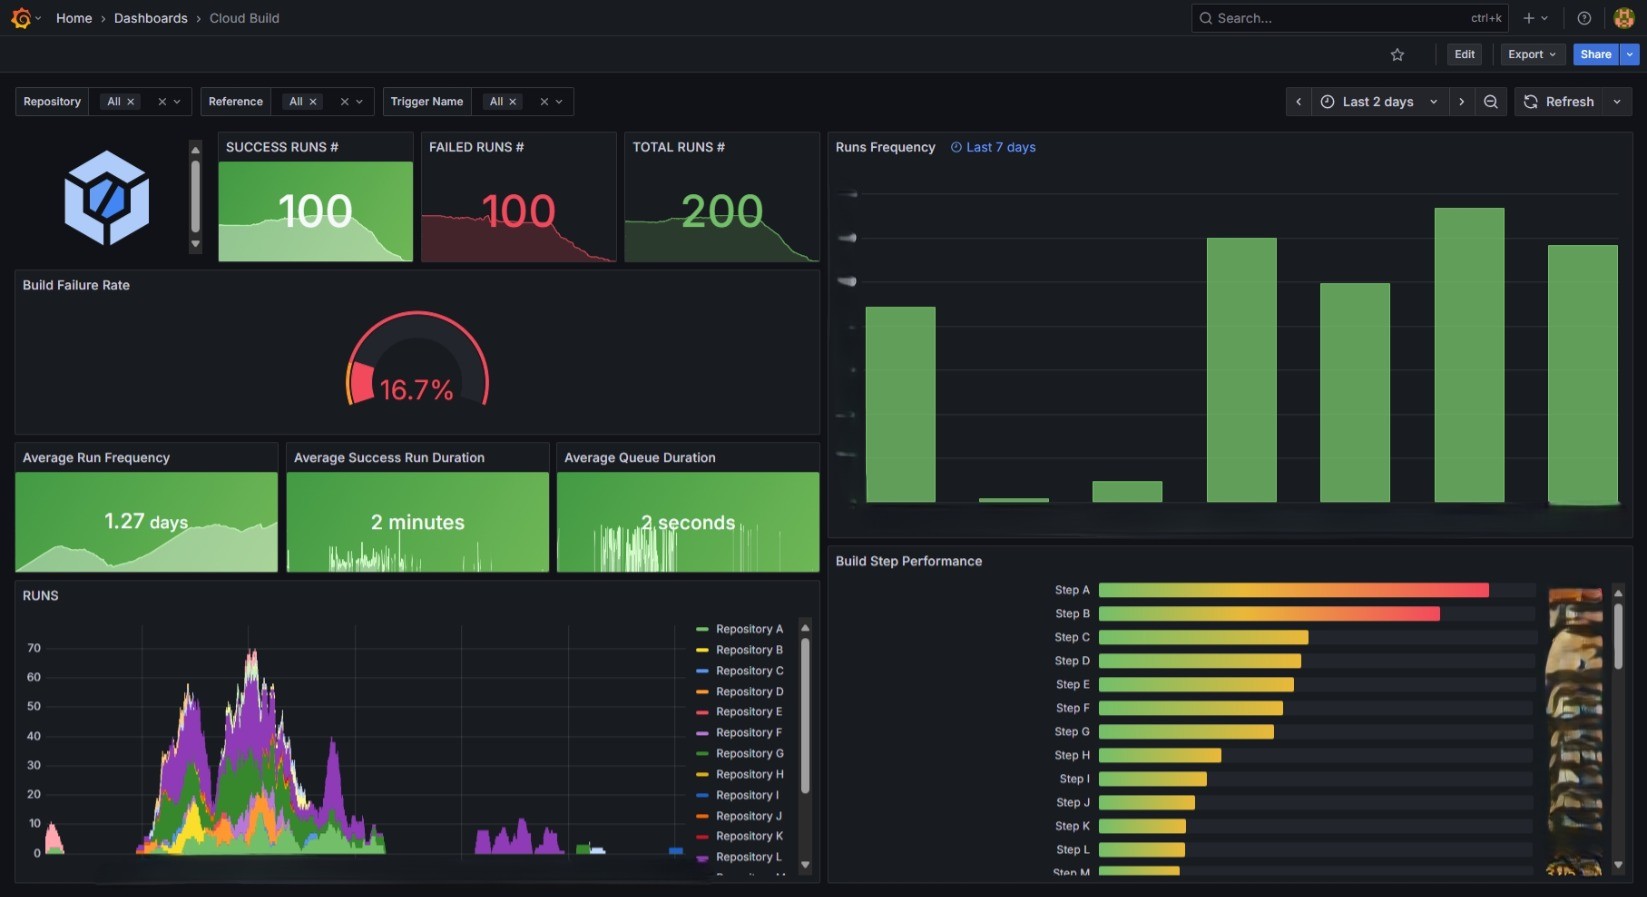
The Google Cloud Build dashboard uses the prometheus data source to create a Grafana dashboard with the barchart, bargauge, gauge, stat, text and timeseries panels.
Data source config
Collector type:
Collector plugins:
Collector config:
Revisions
Upload an updated version of an exported dashboard.json file from Grafana
| Revision | Description | Created | |
|---|---|---|---|
| Download |
Google Cloud Observability with Grafana Cloud
Easily visualize and alert on Google Cloud Service resources using the fully managed Grafana Cloud platform.
Learn more