
Kafka Broker Overview
Comprehensive Grafana dashboard for monitoring Kafka brokers (KRaft).
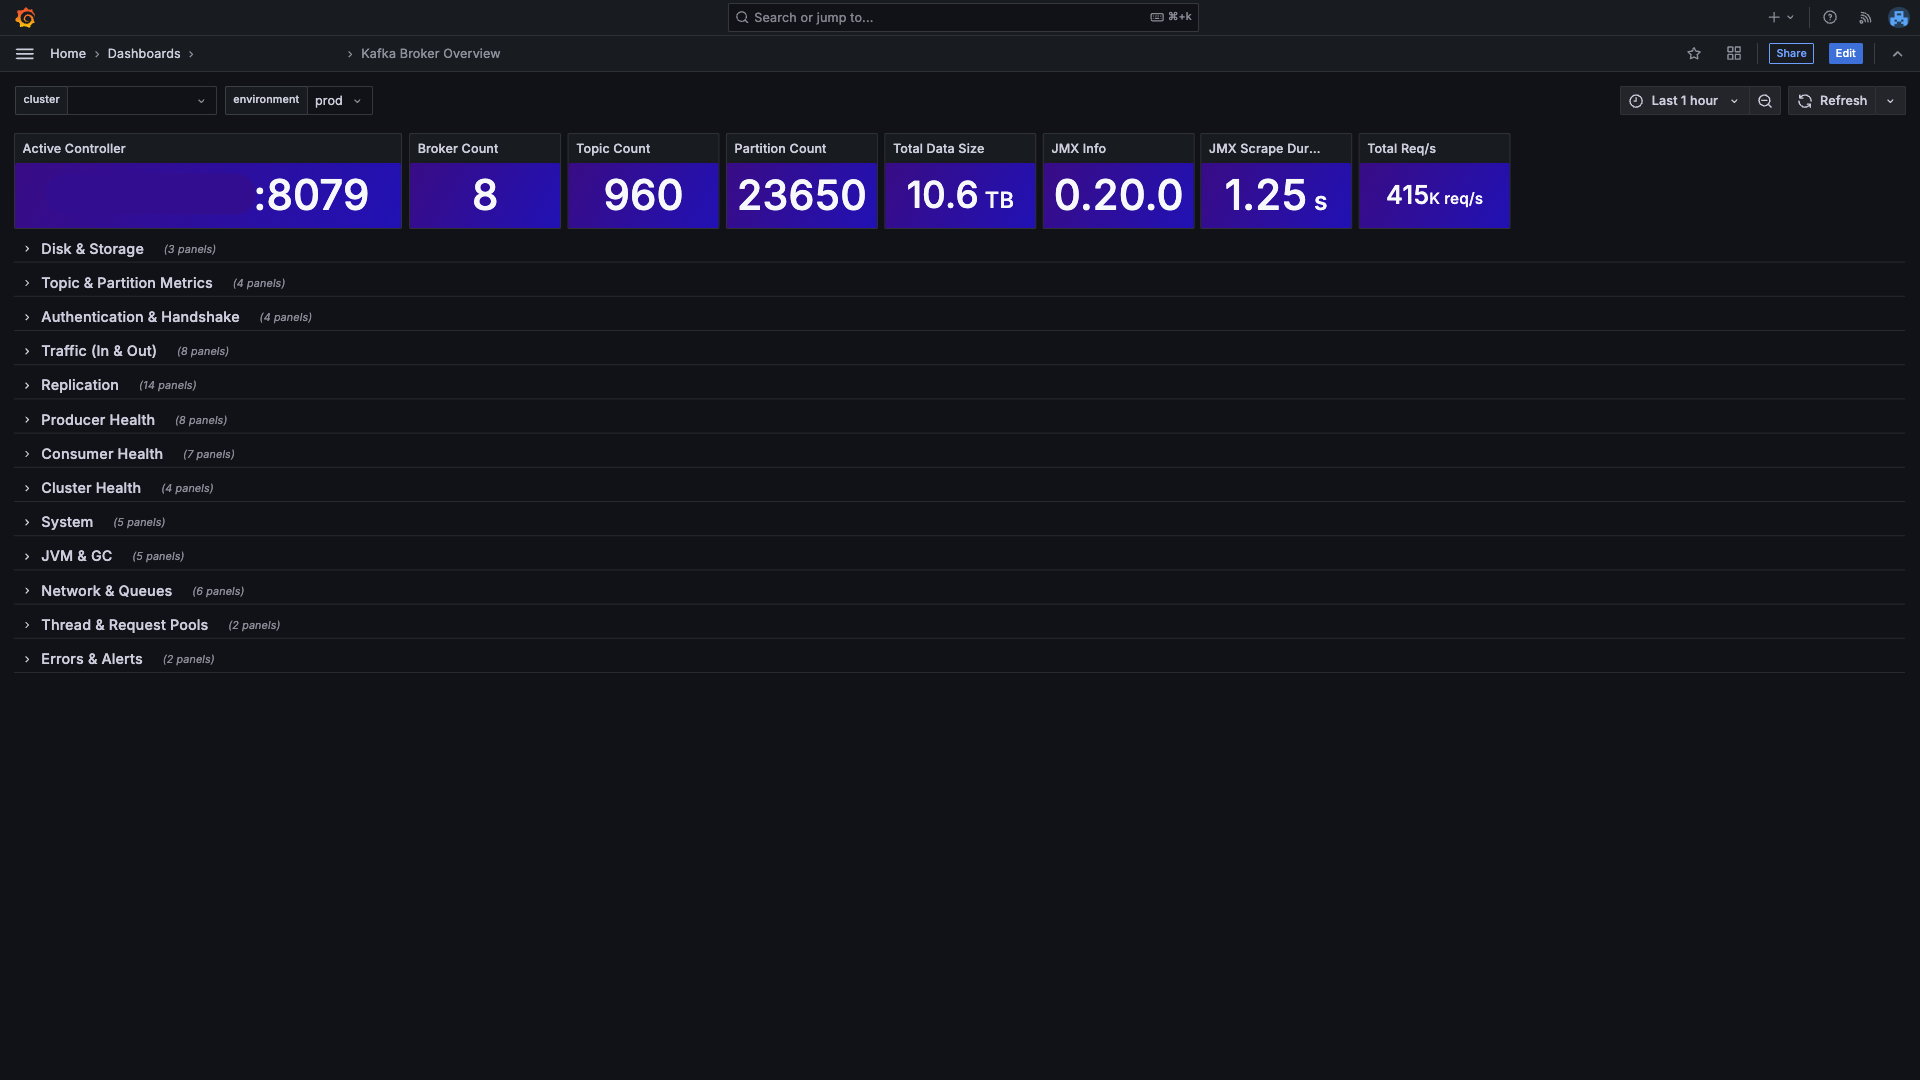
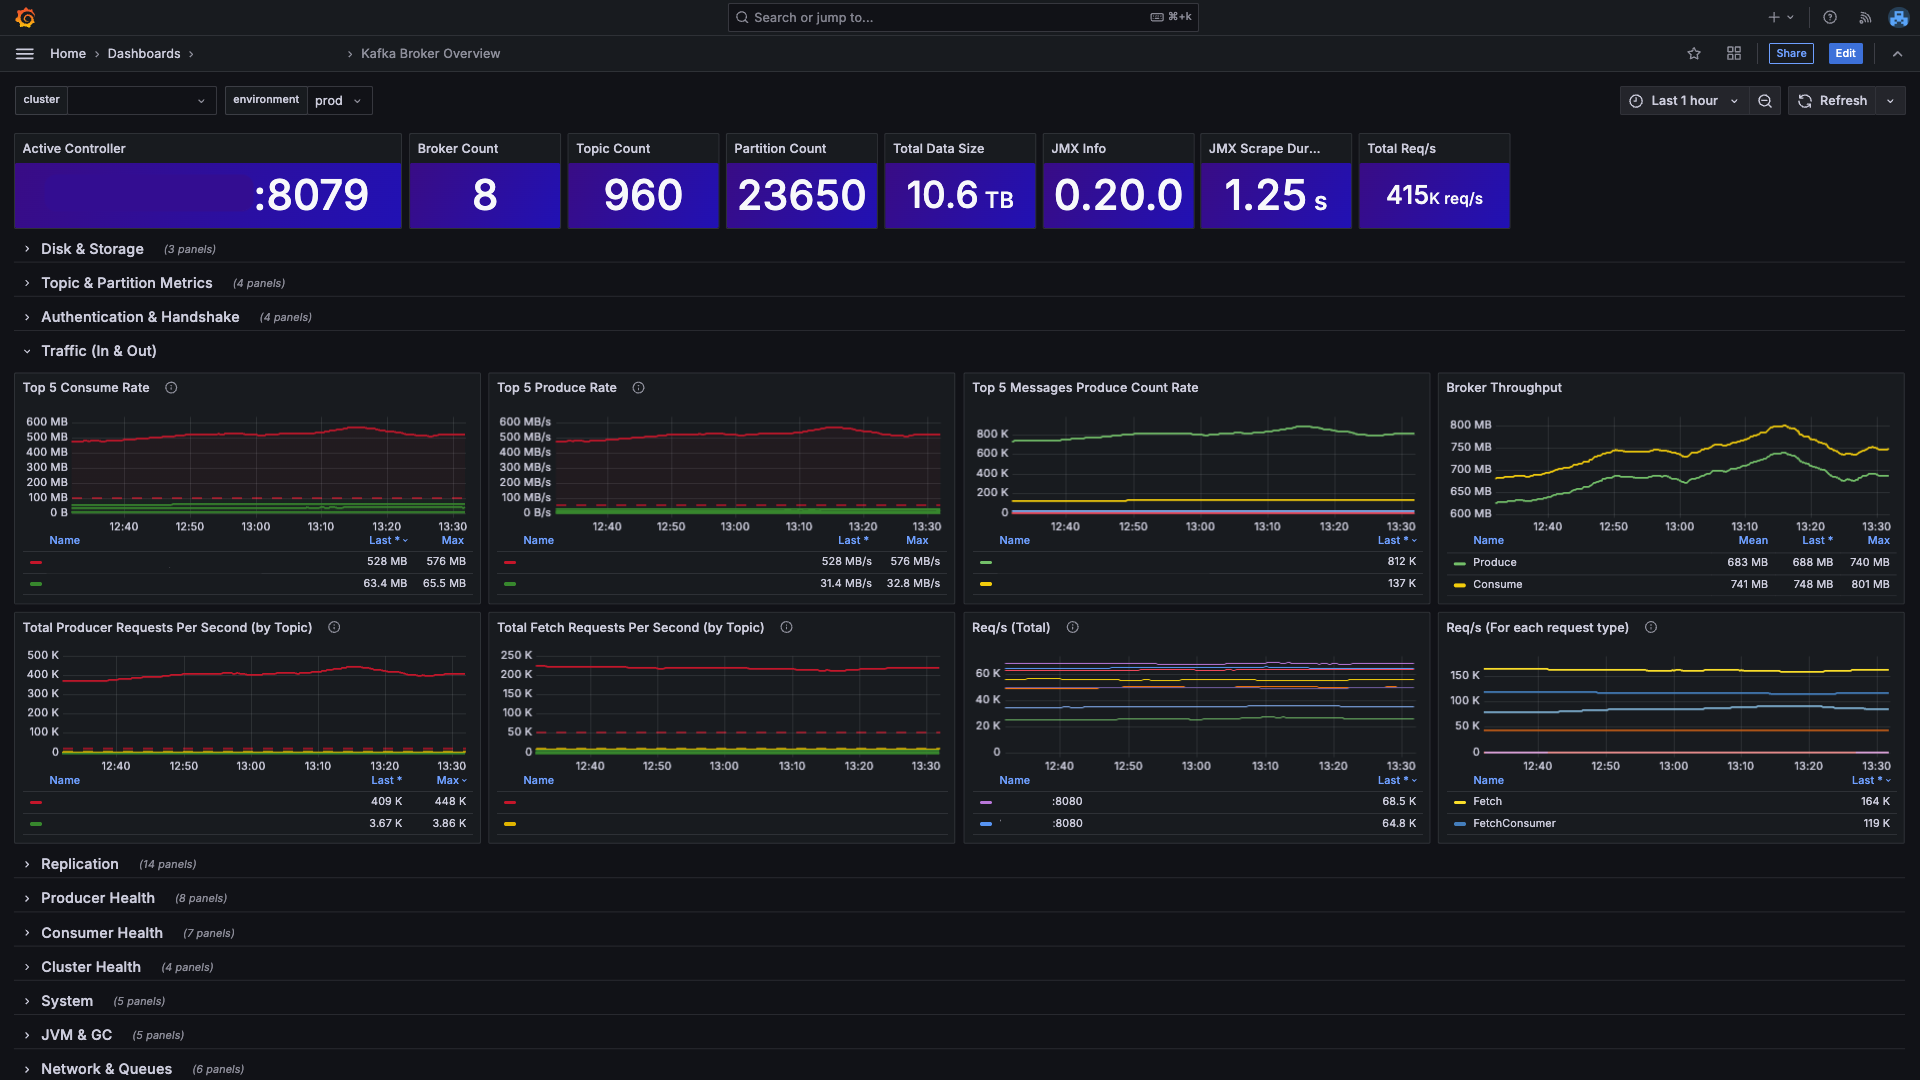
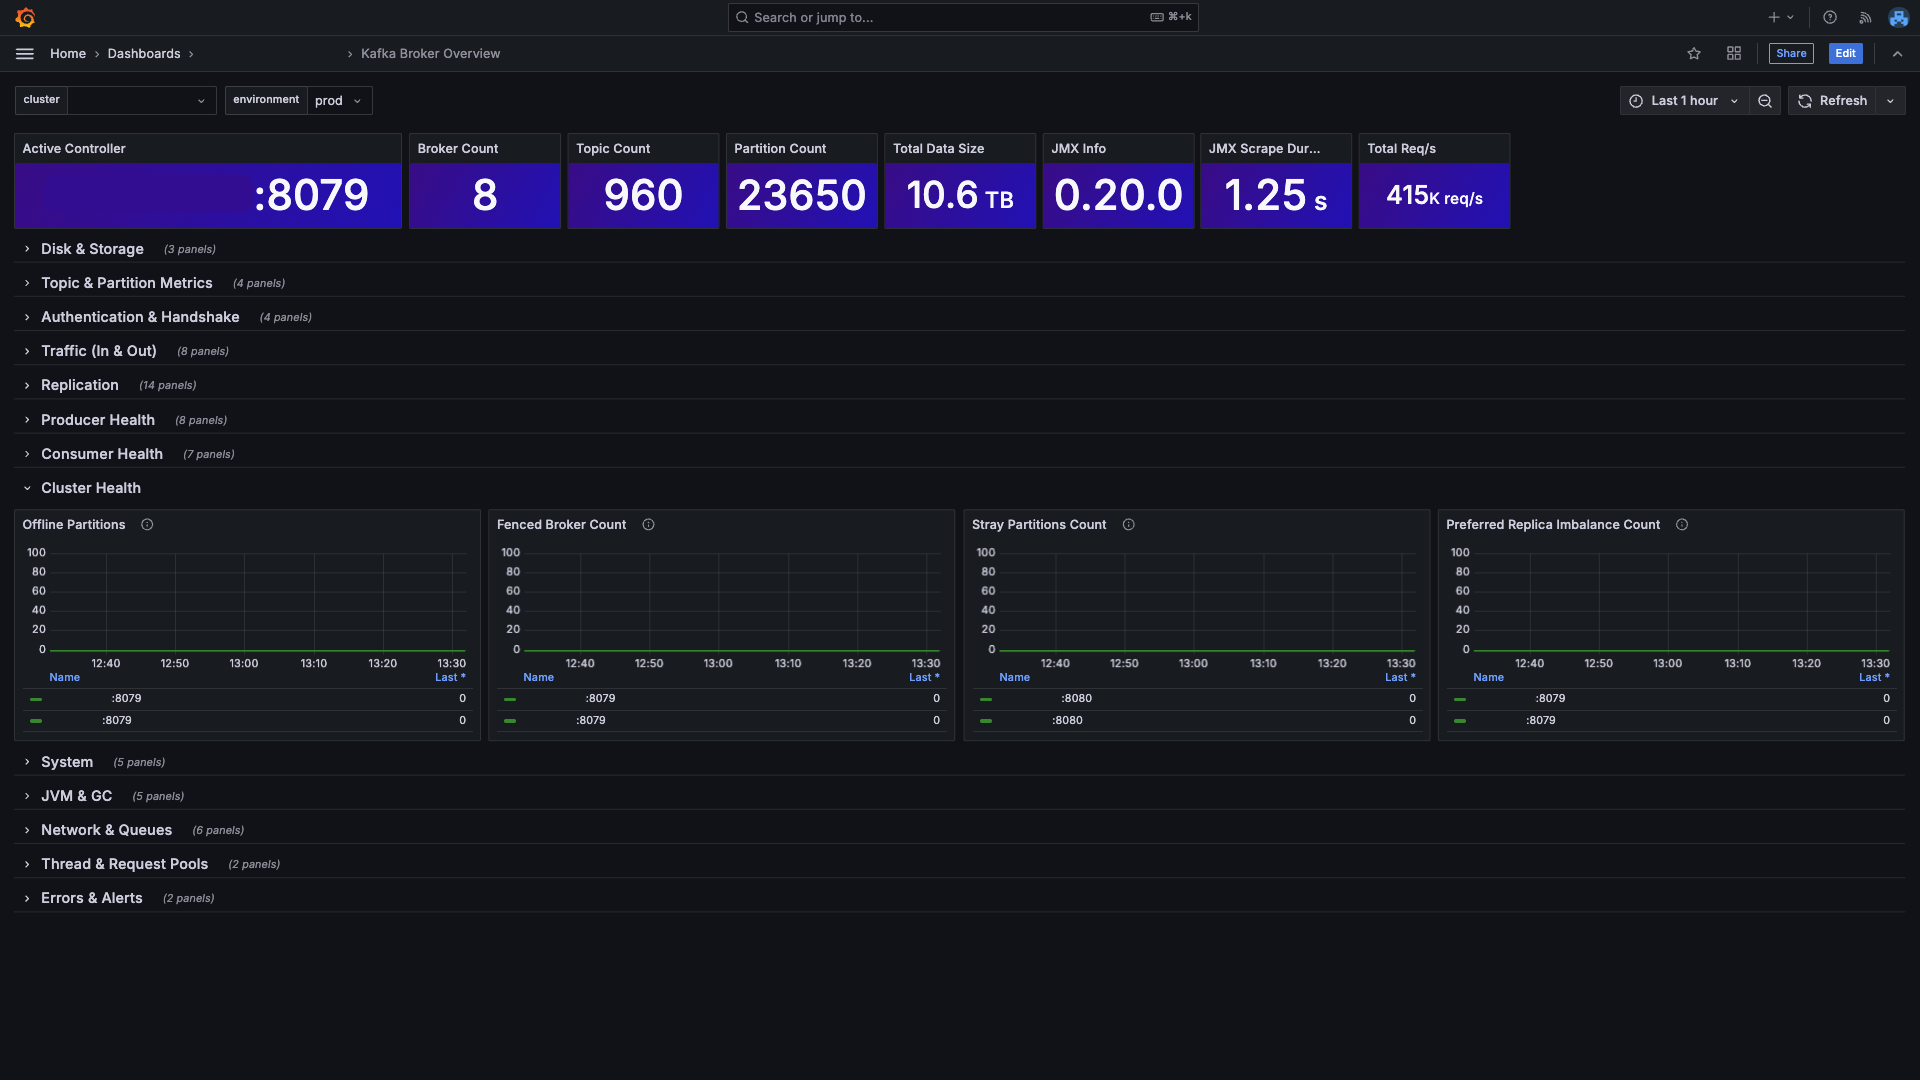
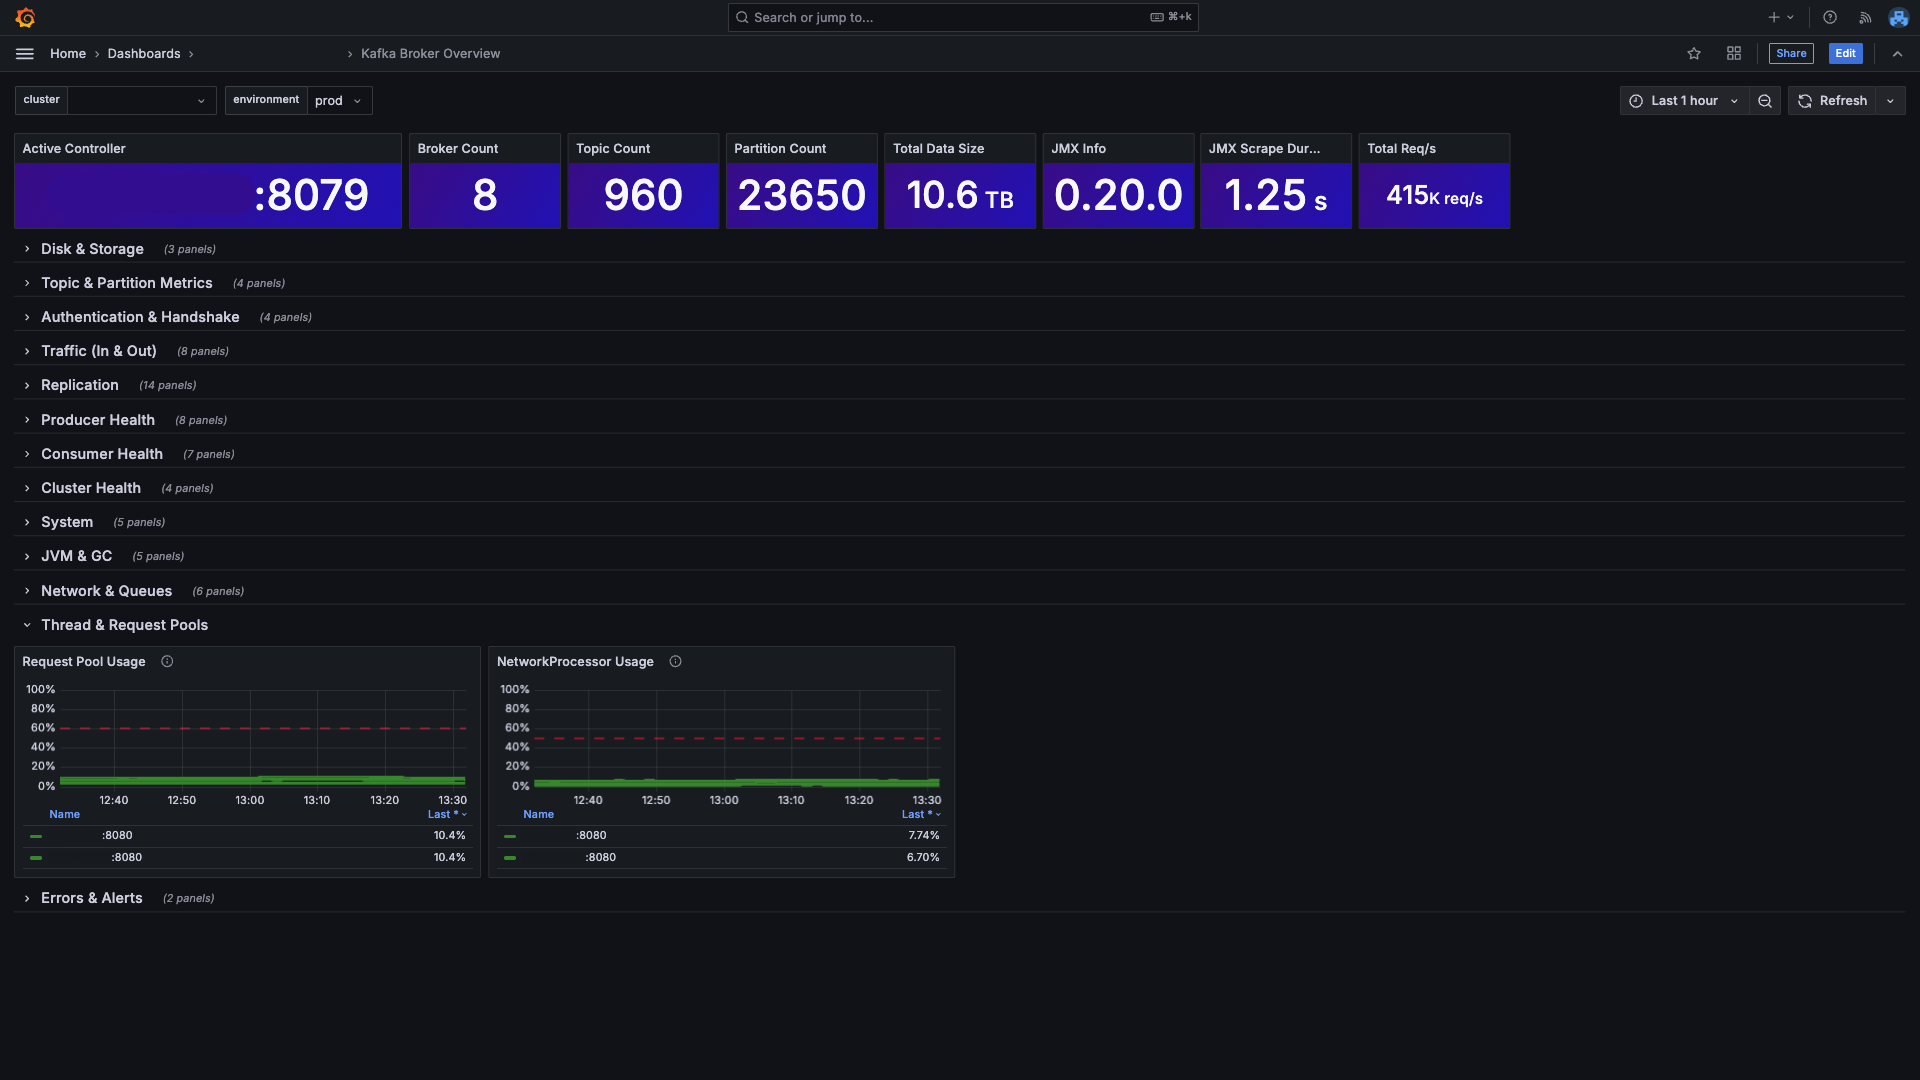
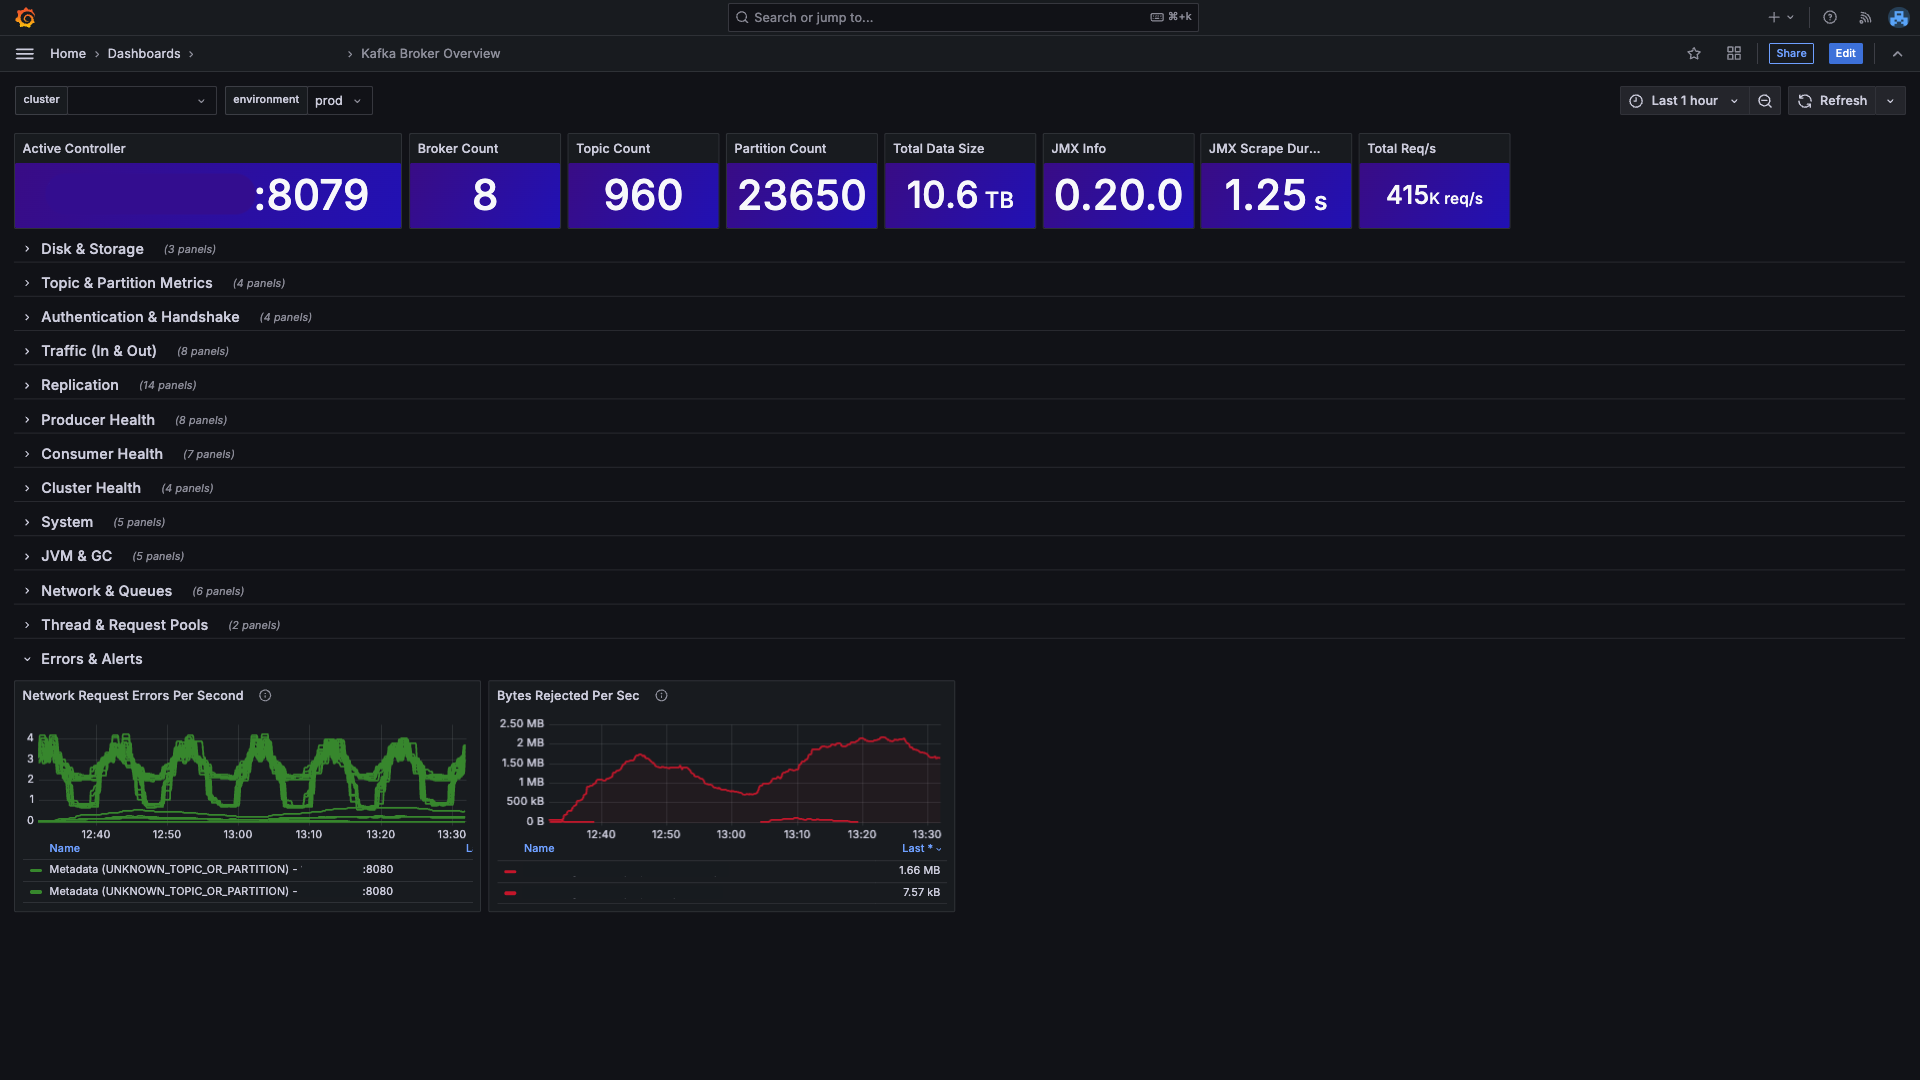
This Grafana dashboard provides a comprehensive view of Kafka brokers running in KRaft mode.
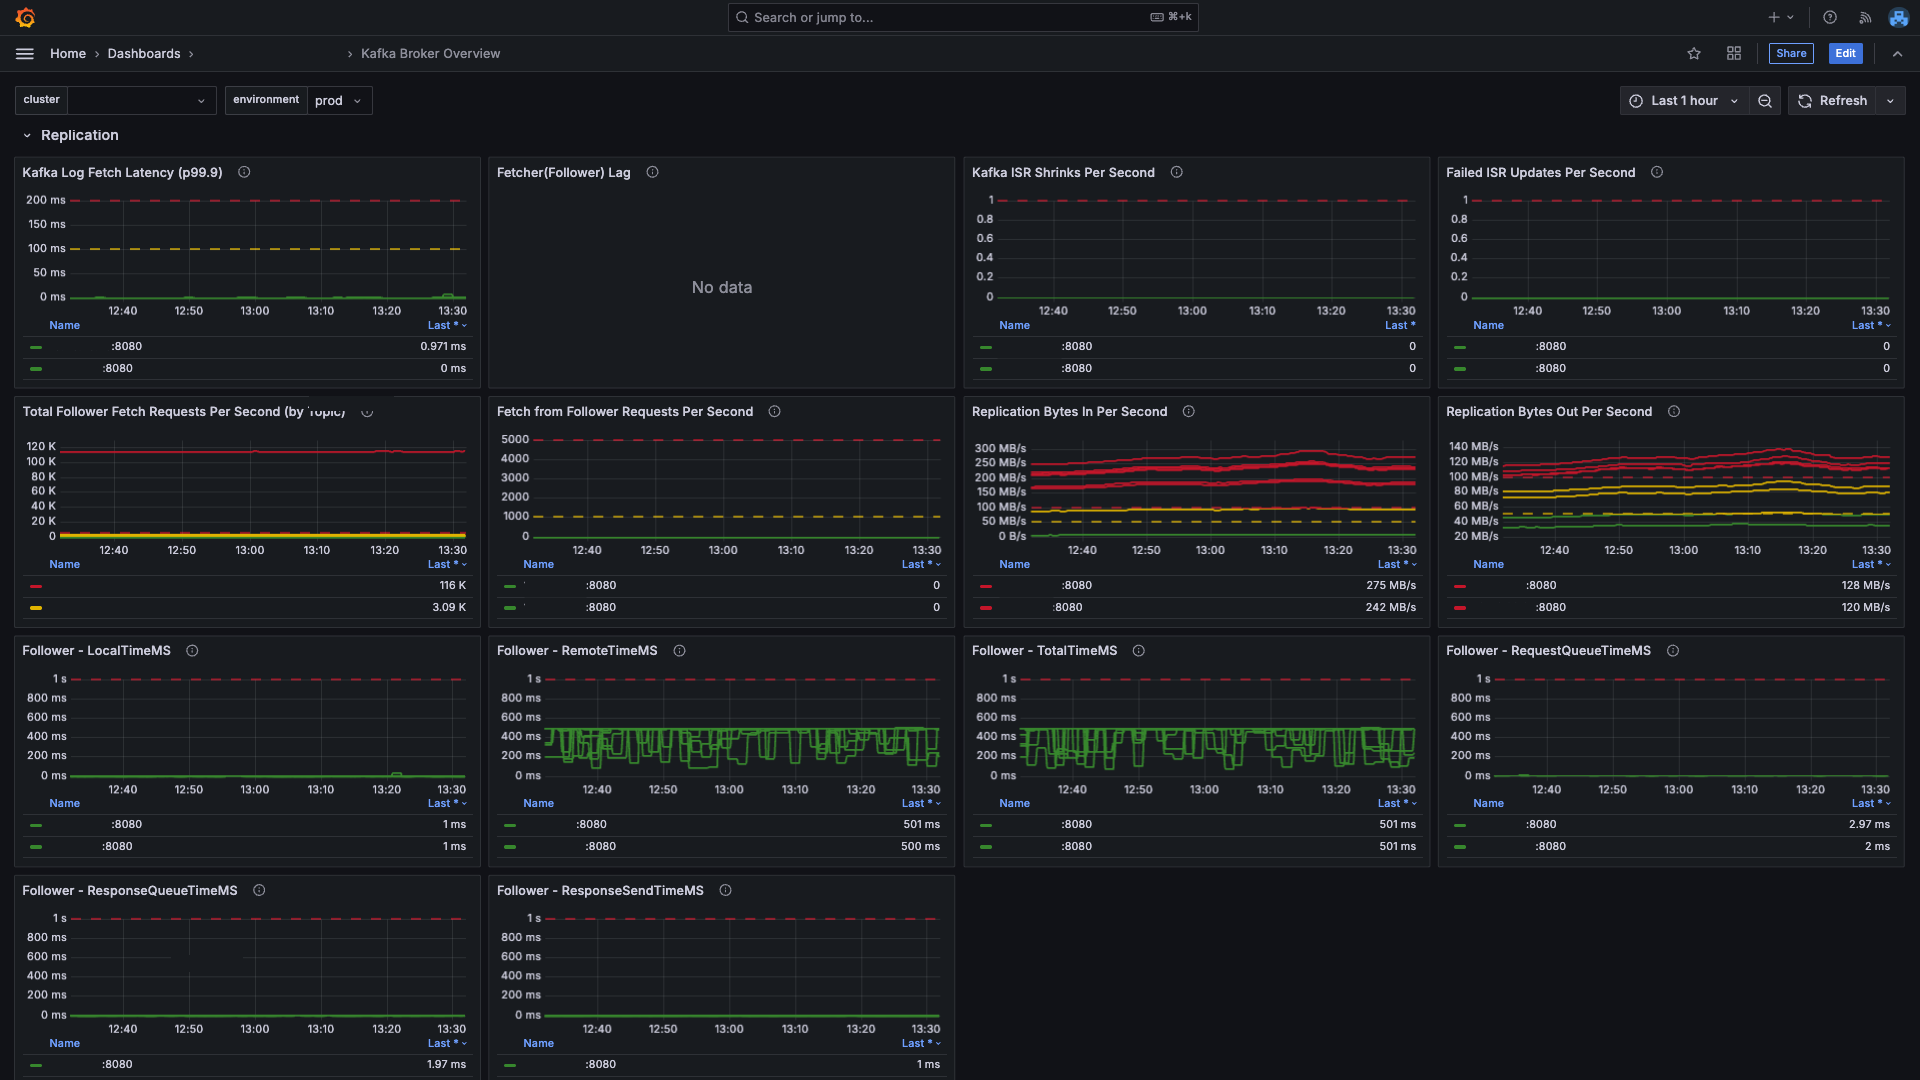
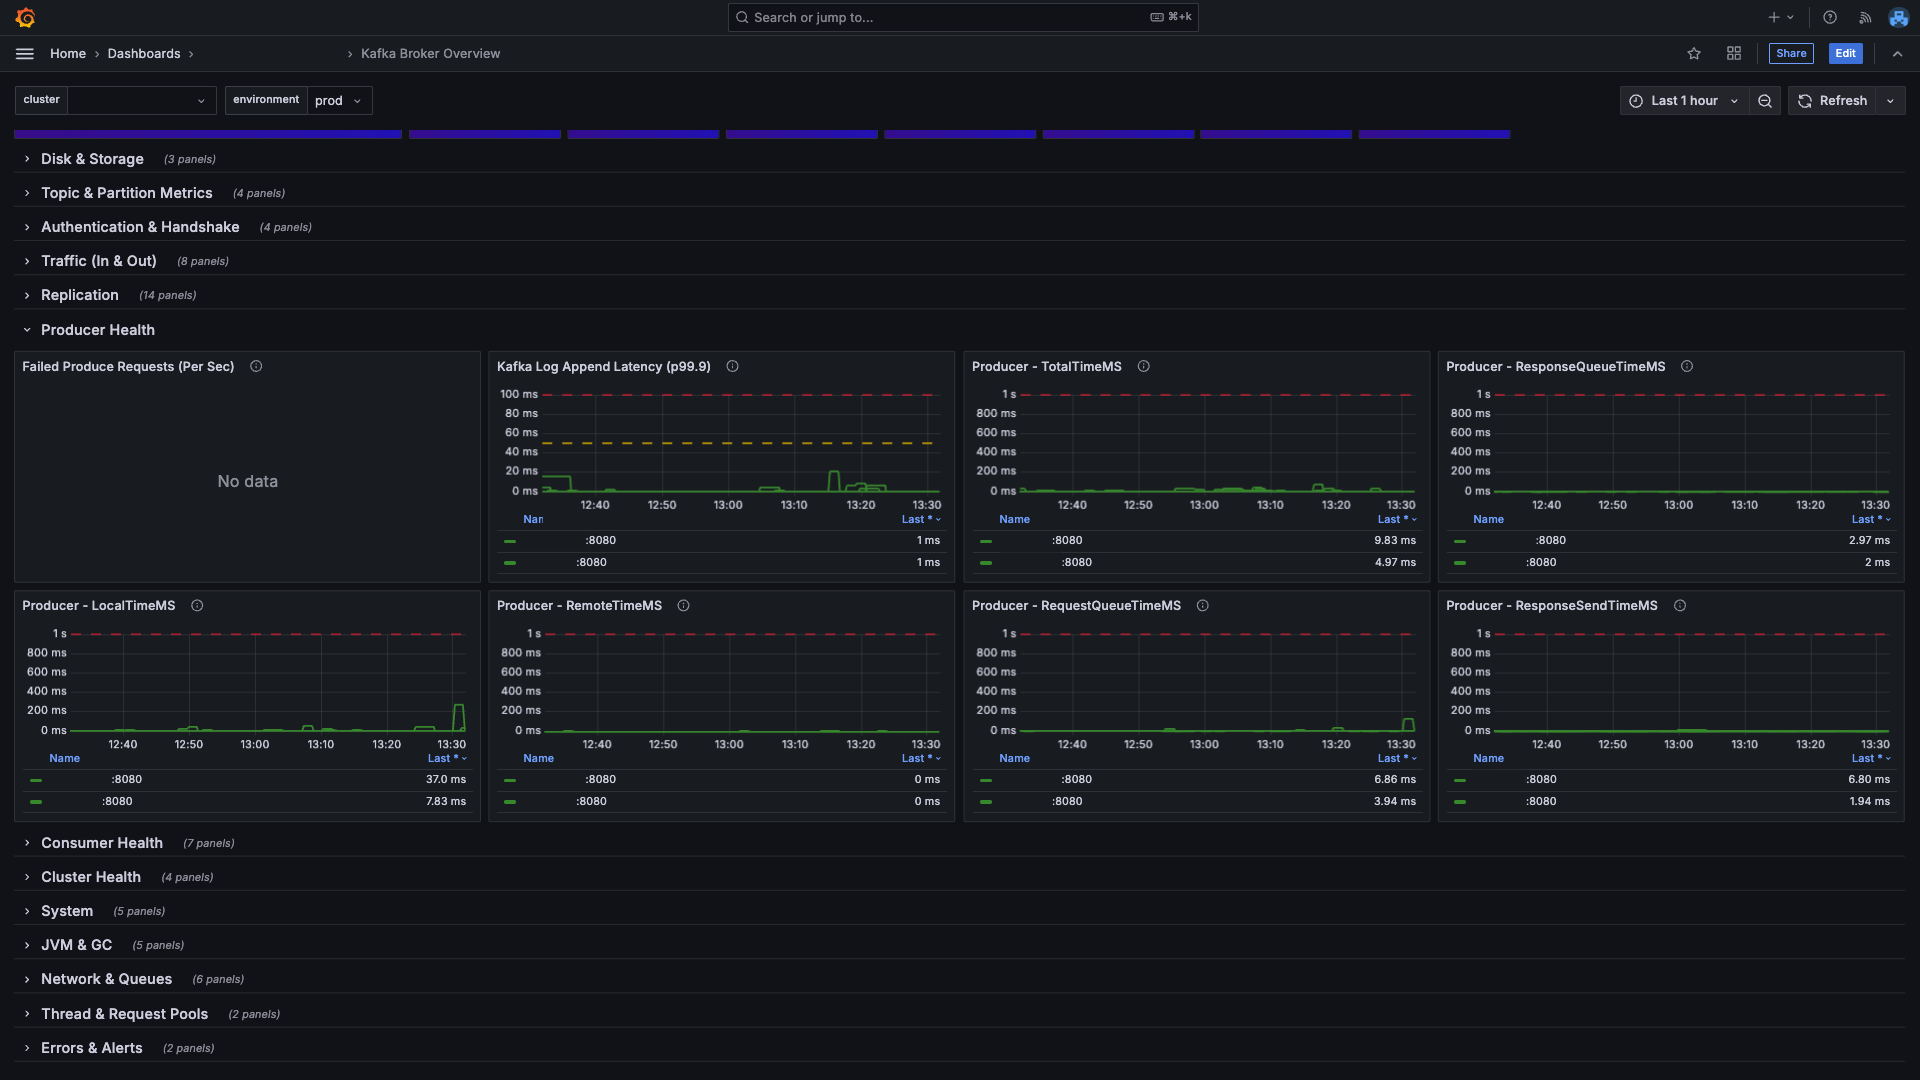
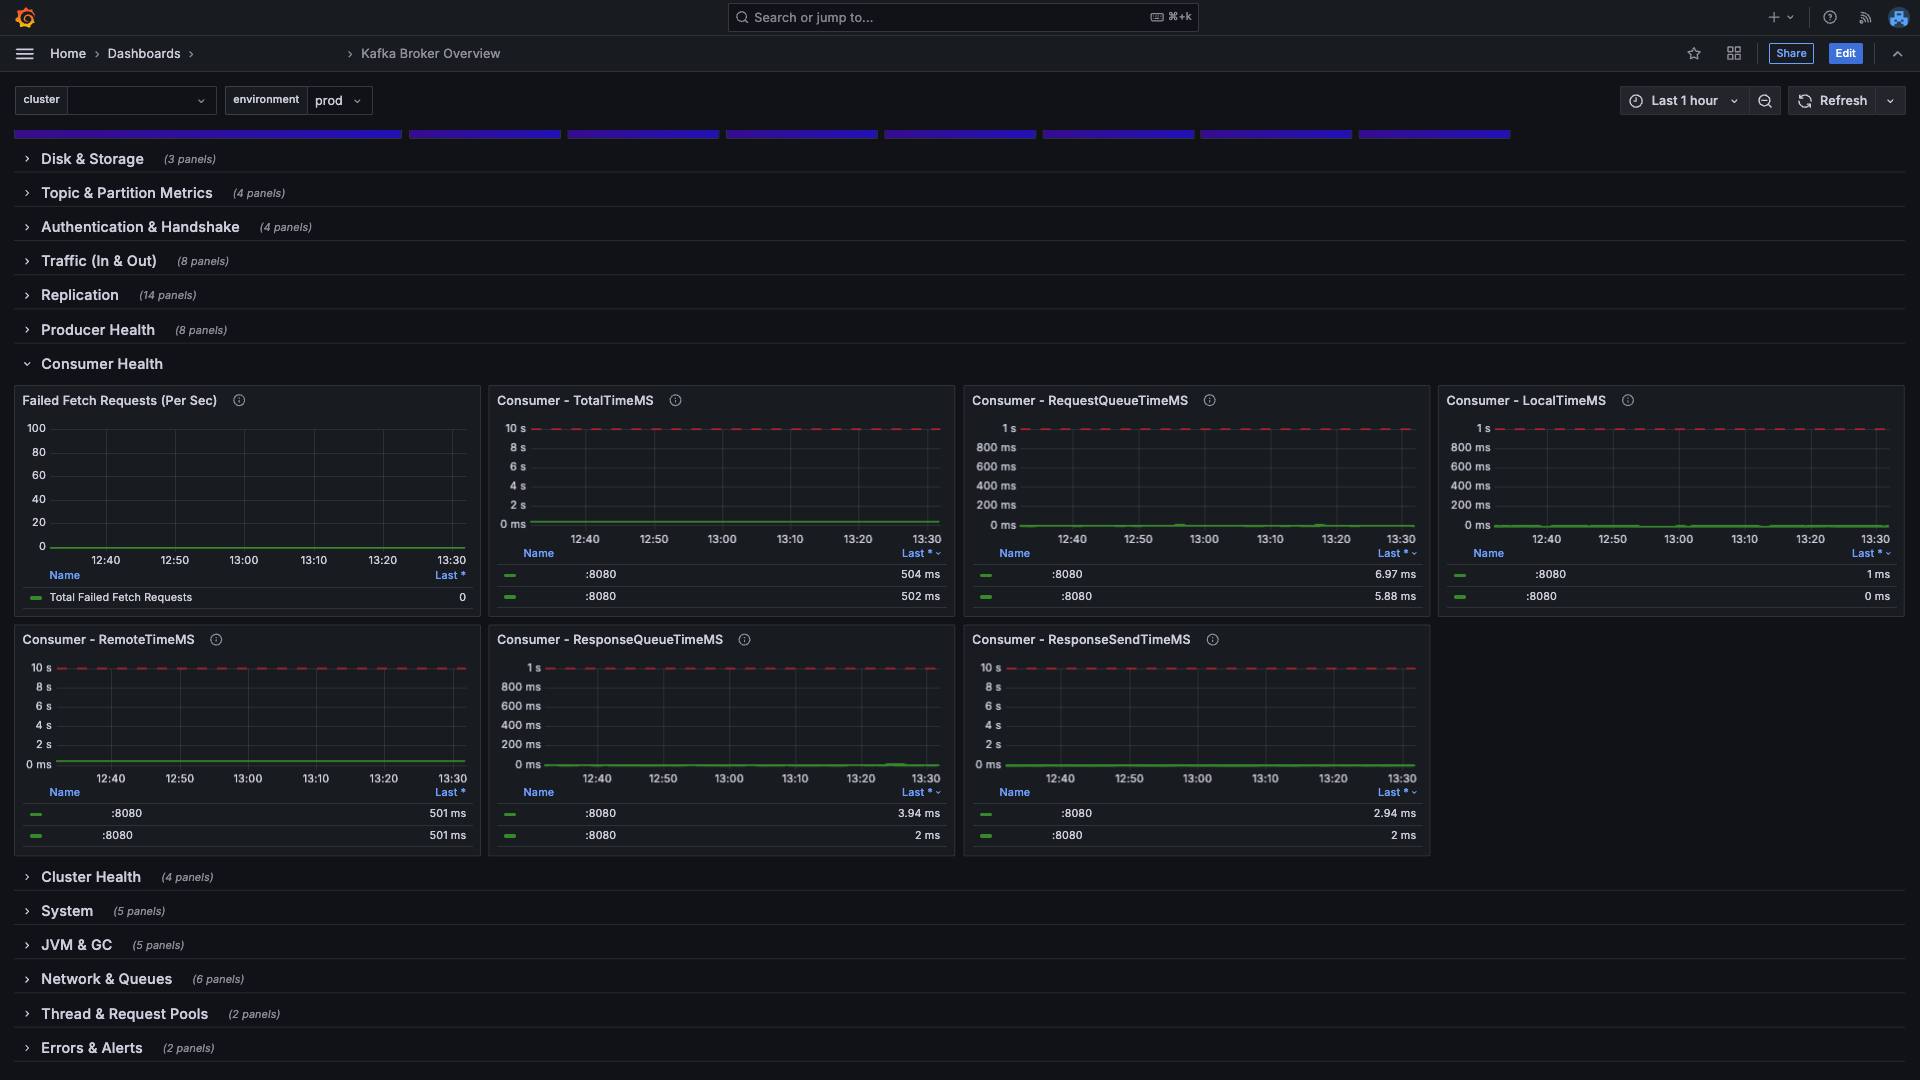
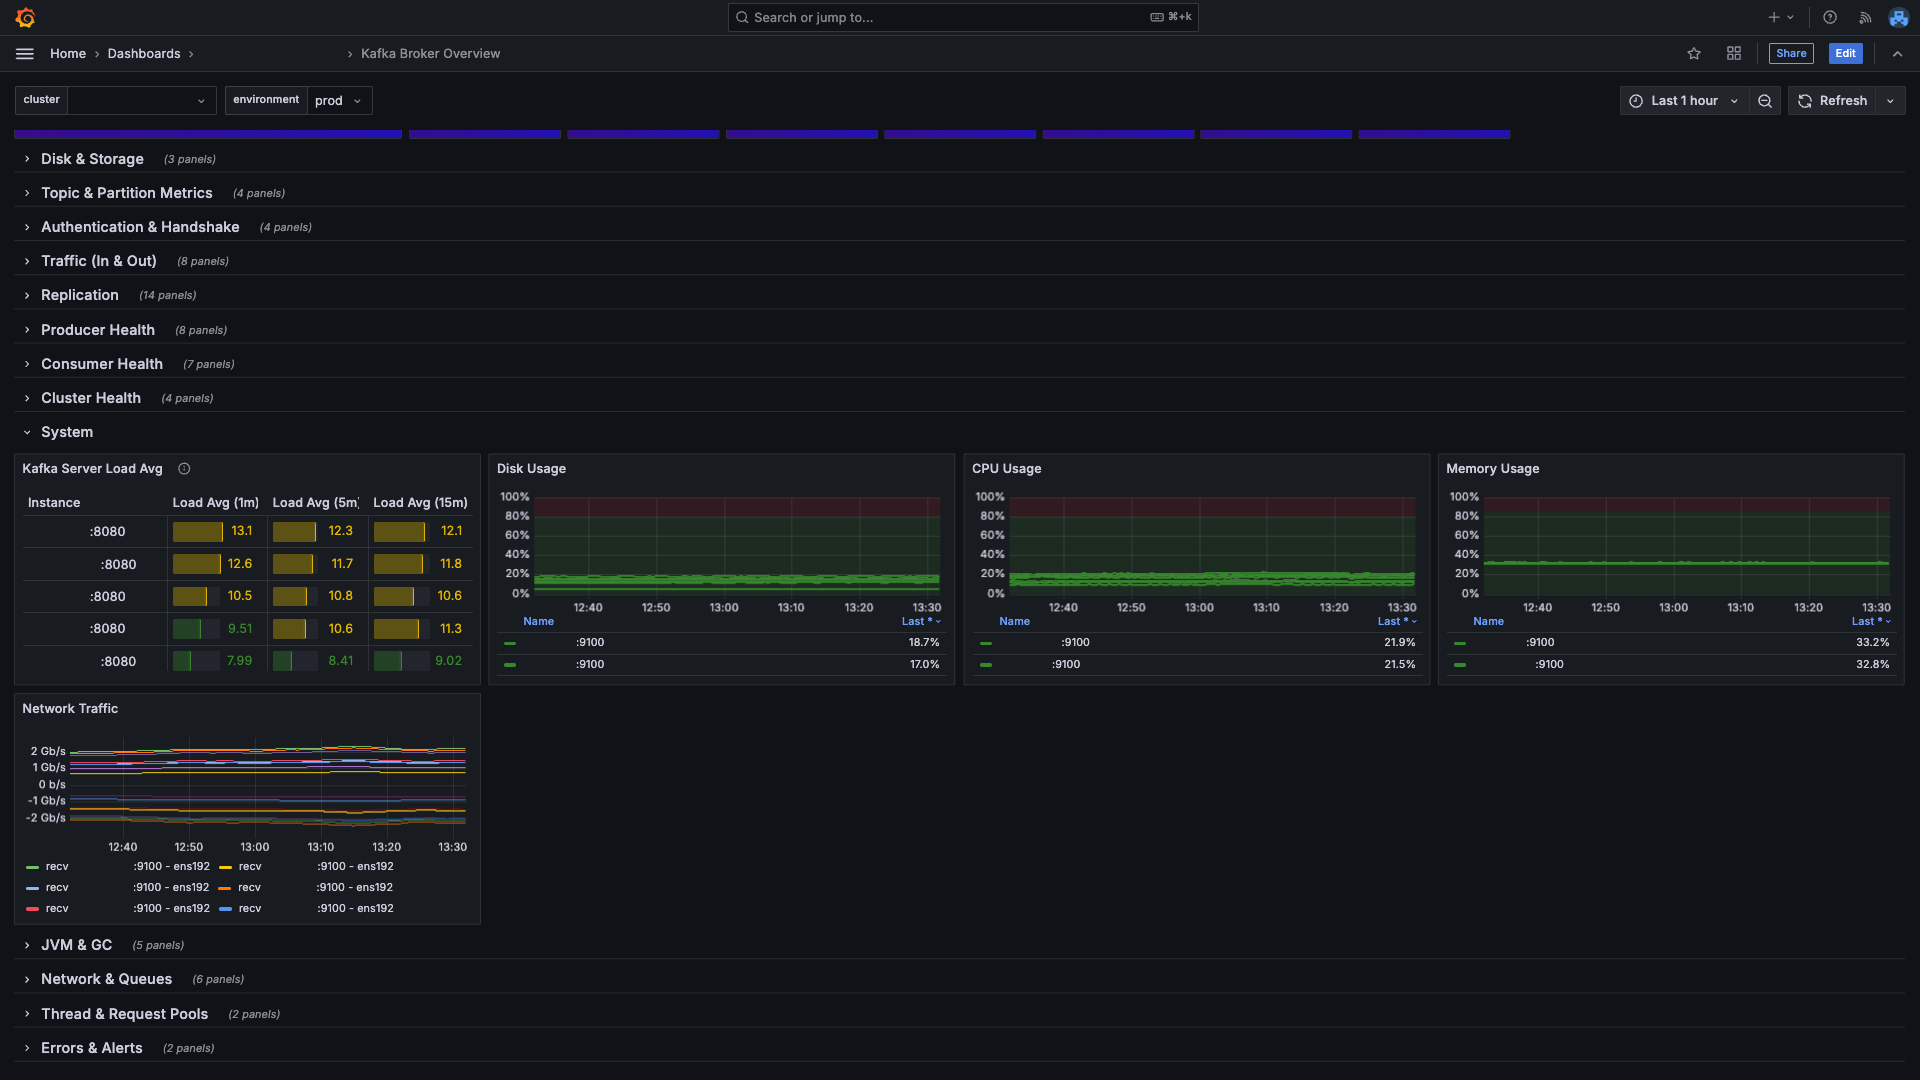
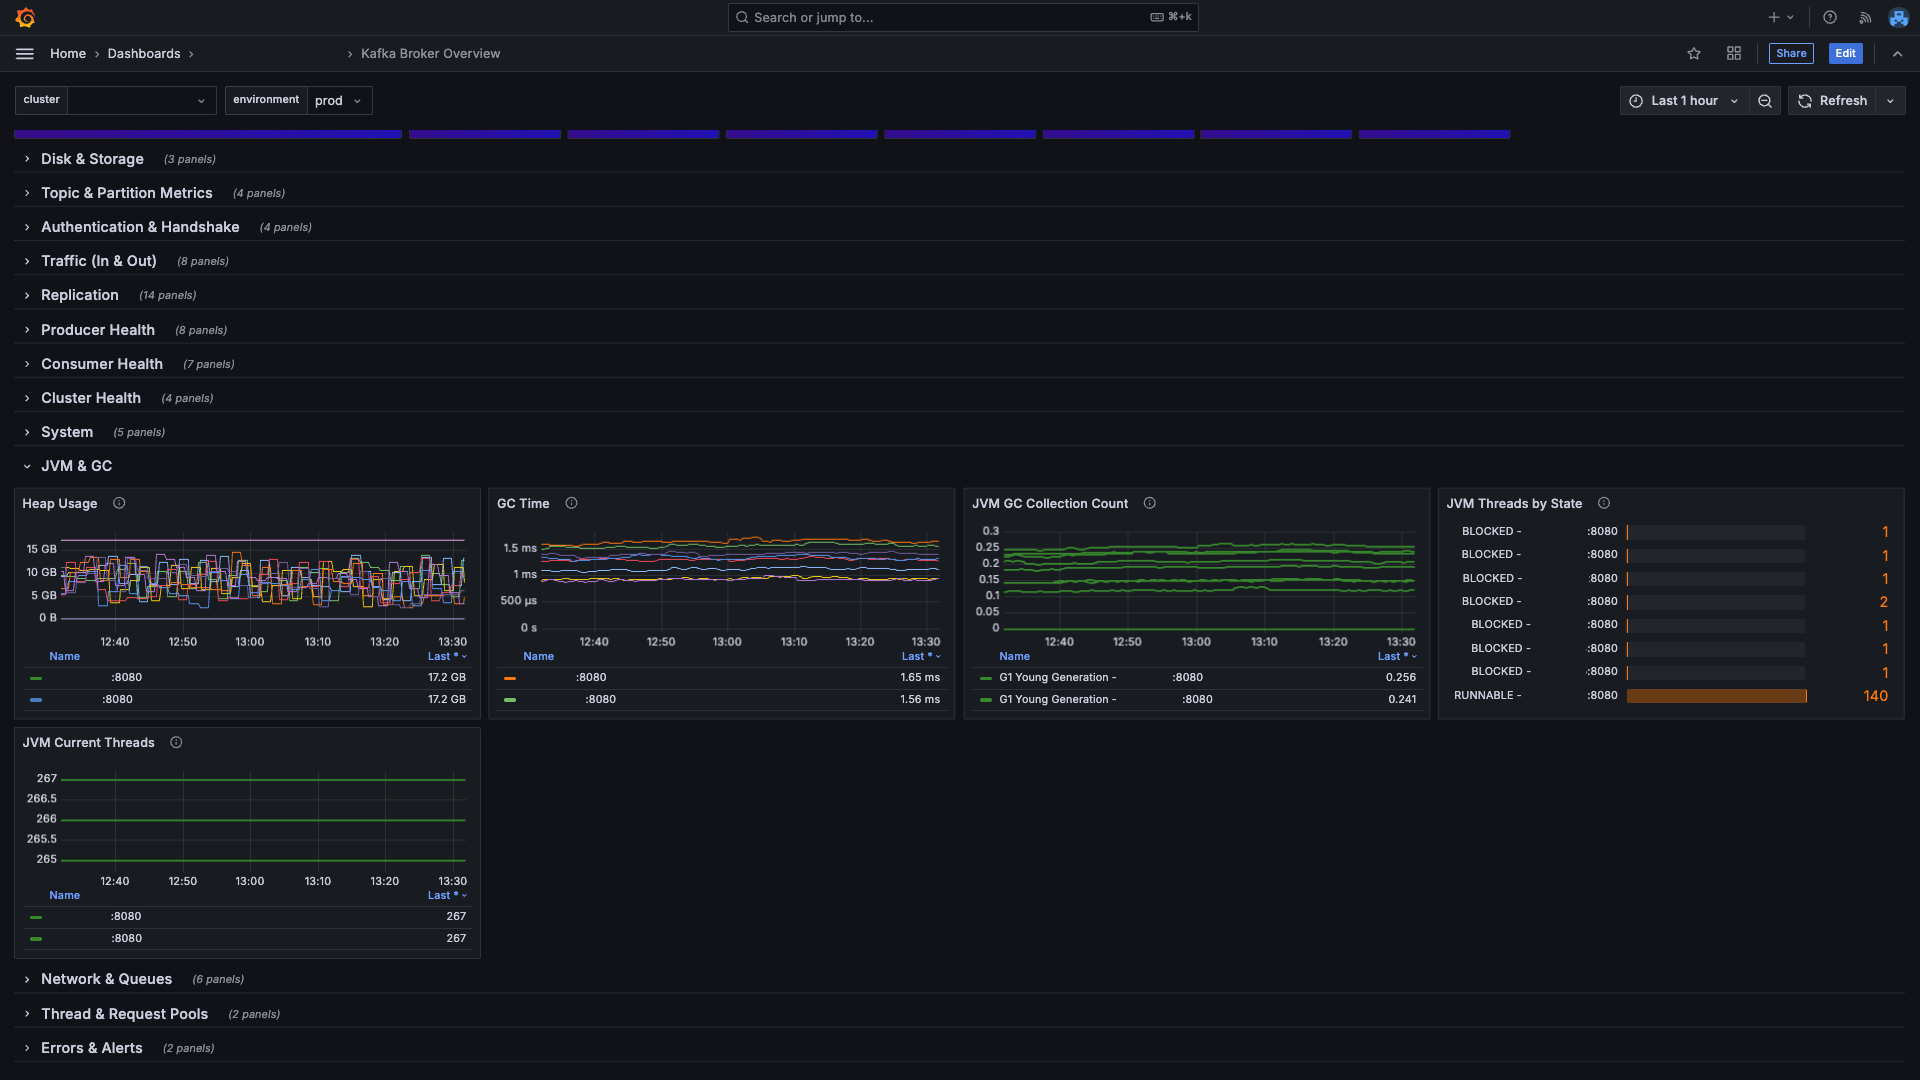
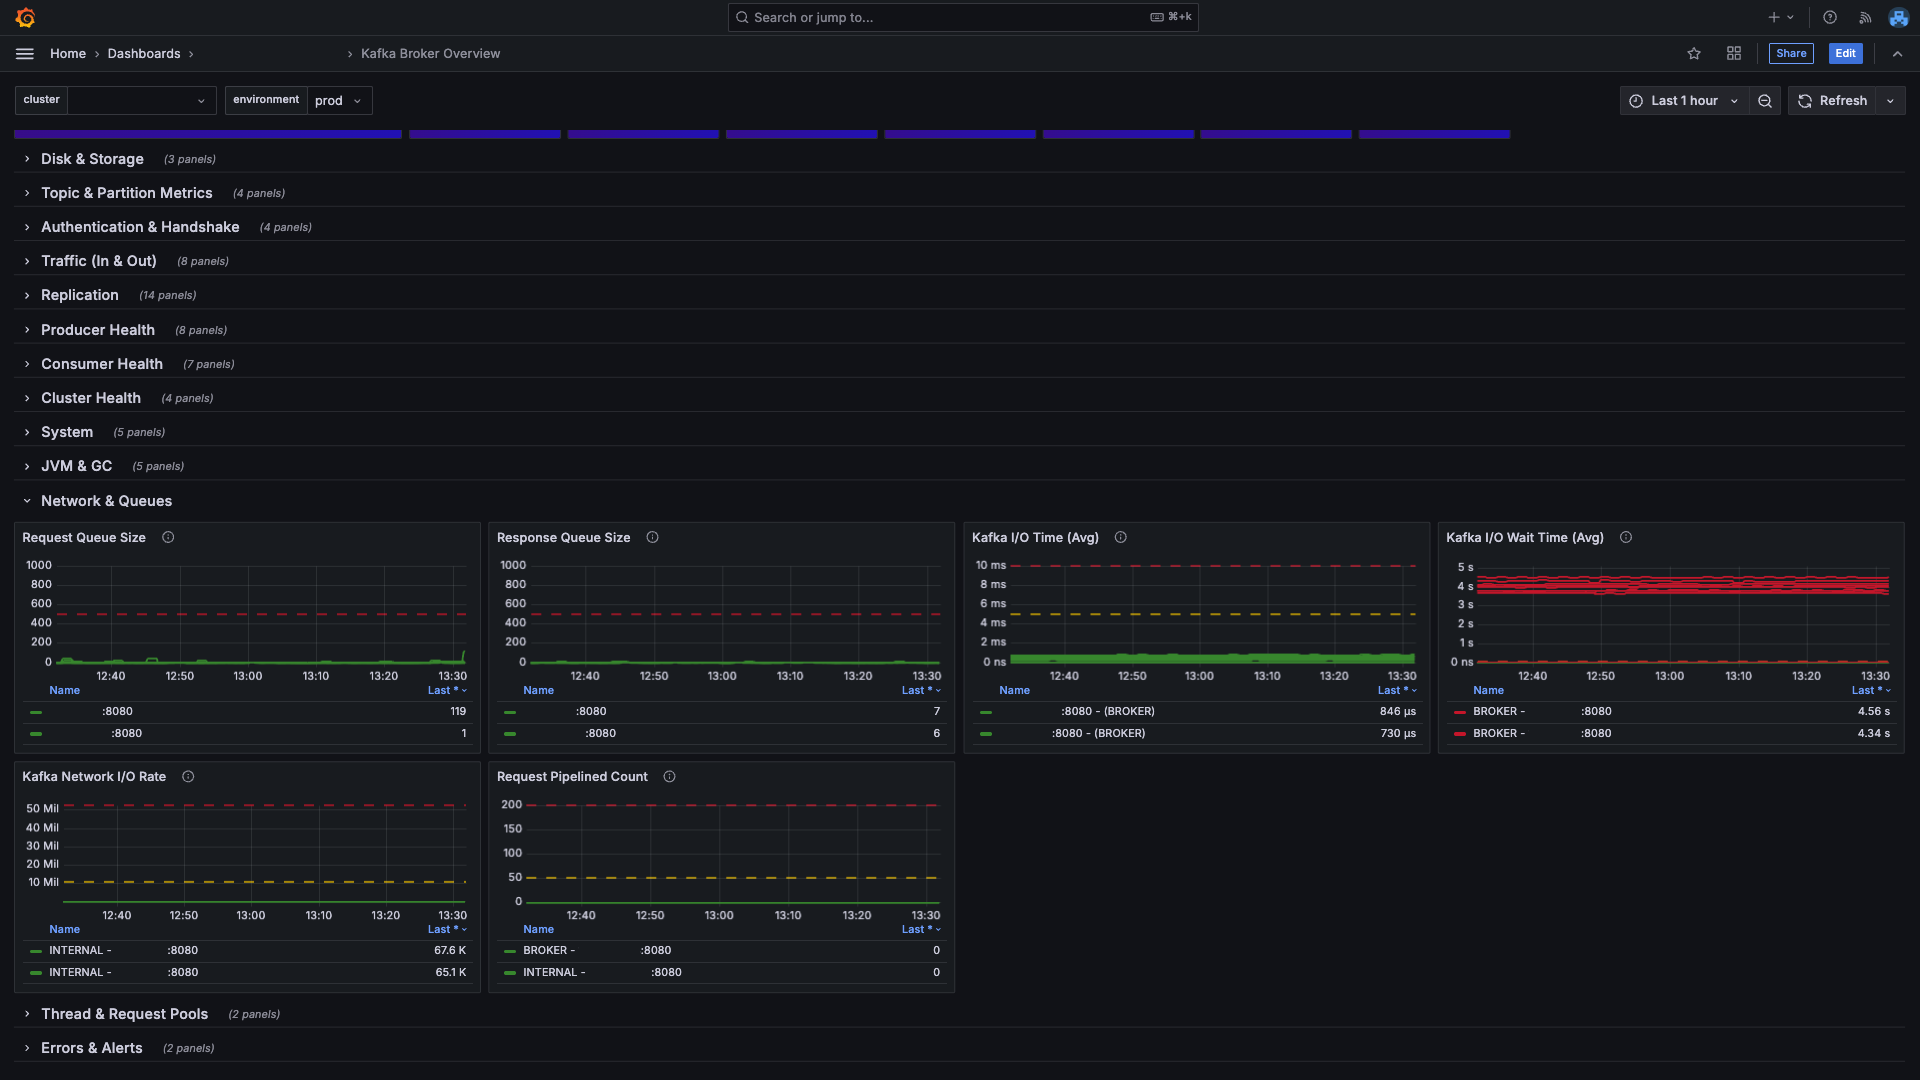
It visualizes JVM memory & GC, request handlers, network processors, throughput, replication traffic, request/response latencies (p95/p999), under-replicated partitions, disk I/O, and overall broker health using Prometheus.
To make this dashboard work, Prometheus must scrape metrics from the following exporters:
- job_name: kafka-broker-jmx
static_configs:
- targets: ["localhost:8080"]
-
job_name: kafka-controller-jmx
static_configs:
- targets: ["localhost:8079"]
-
job_name: node-exporter
static_configs:
- targets: ["localhost:9100"]
The dashboard uses two variables: $cluster and $environment.
In Prometheus queries, these map to metric labels _cluster="$cluster" and _environment="$environment".
Using the dashboard is straightforward:
- Import the JSON into Grafana.
- Select your Prometheus data source.
- Map
$clusterand$environmentto your metric labels. - Ensure Prometheus is scraping the exporters at ports
8080,8079, and9100.
For updates and source files, visit the GitHub repository.
Data source config
Collector config:
Upload an updated version of an exported dashboard.json file from Grafana
| Revision | Description | Created | |
|---|---|---|---|
| Download |
Kafka
Easily monitor your Kafka deployment with Grafana Cloud's out-of-the-box monitoring solution.
Learn more