
Buildkite Agent Metrics
Displays Prometheus metrics collected from the Buildkite Agent Metrics exporter.
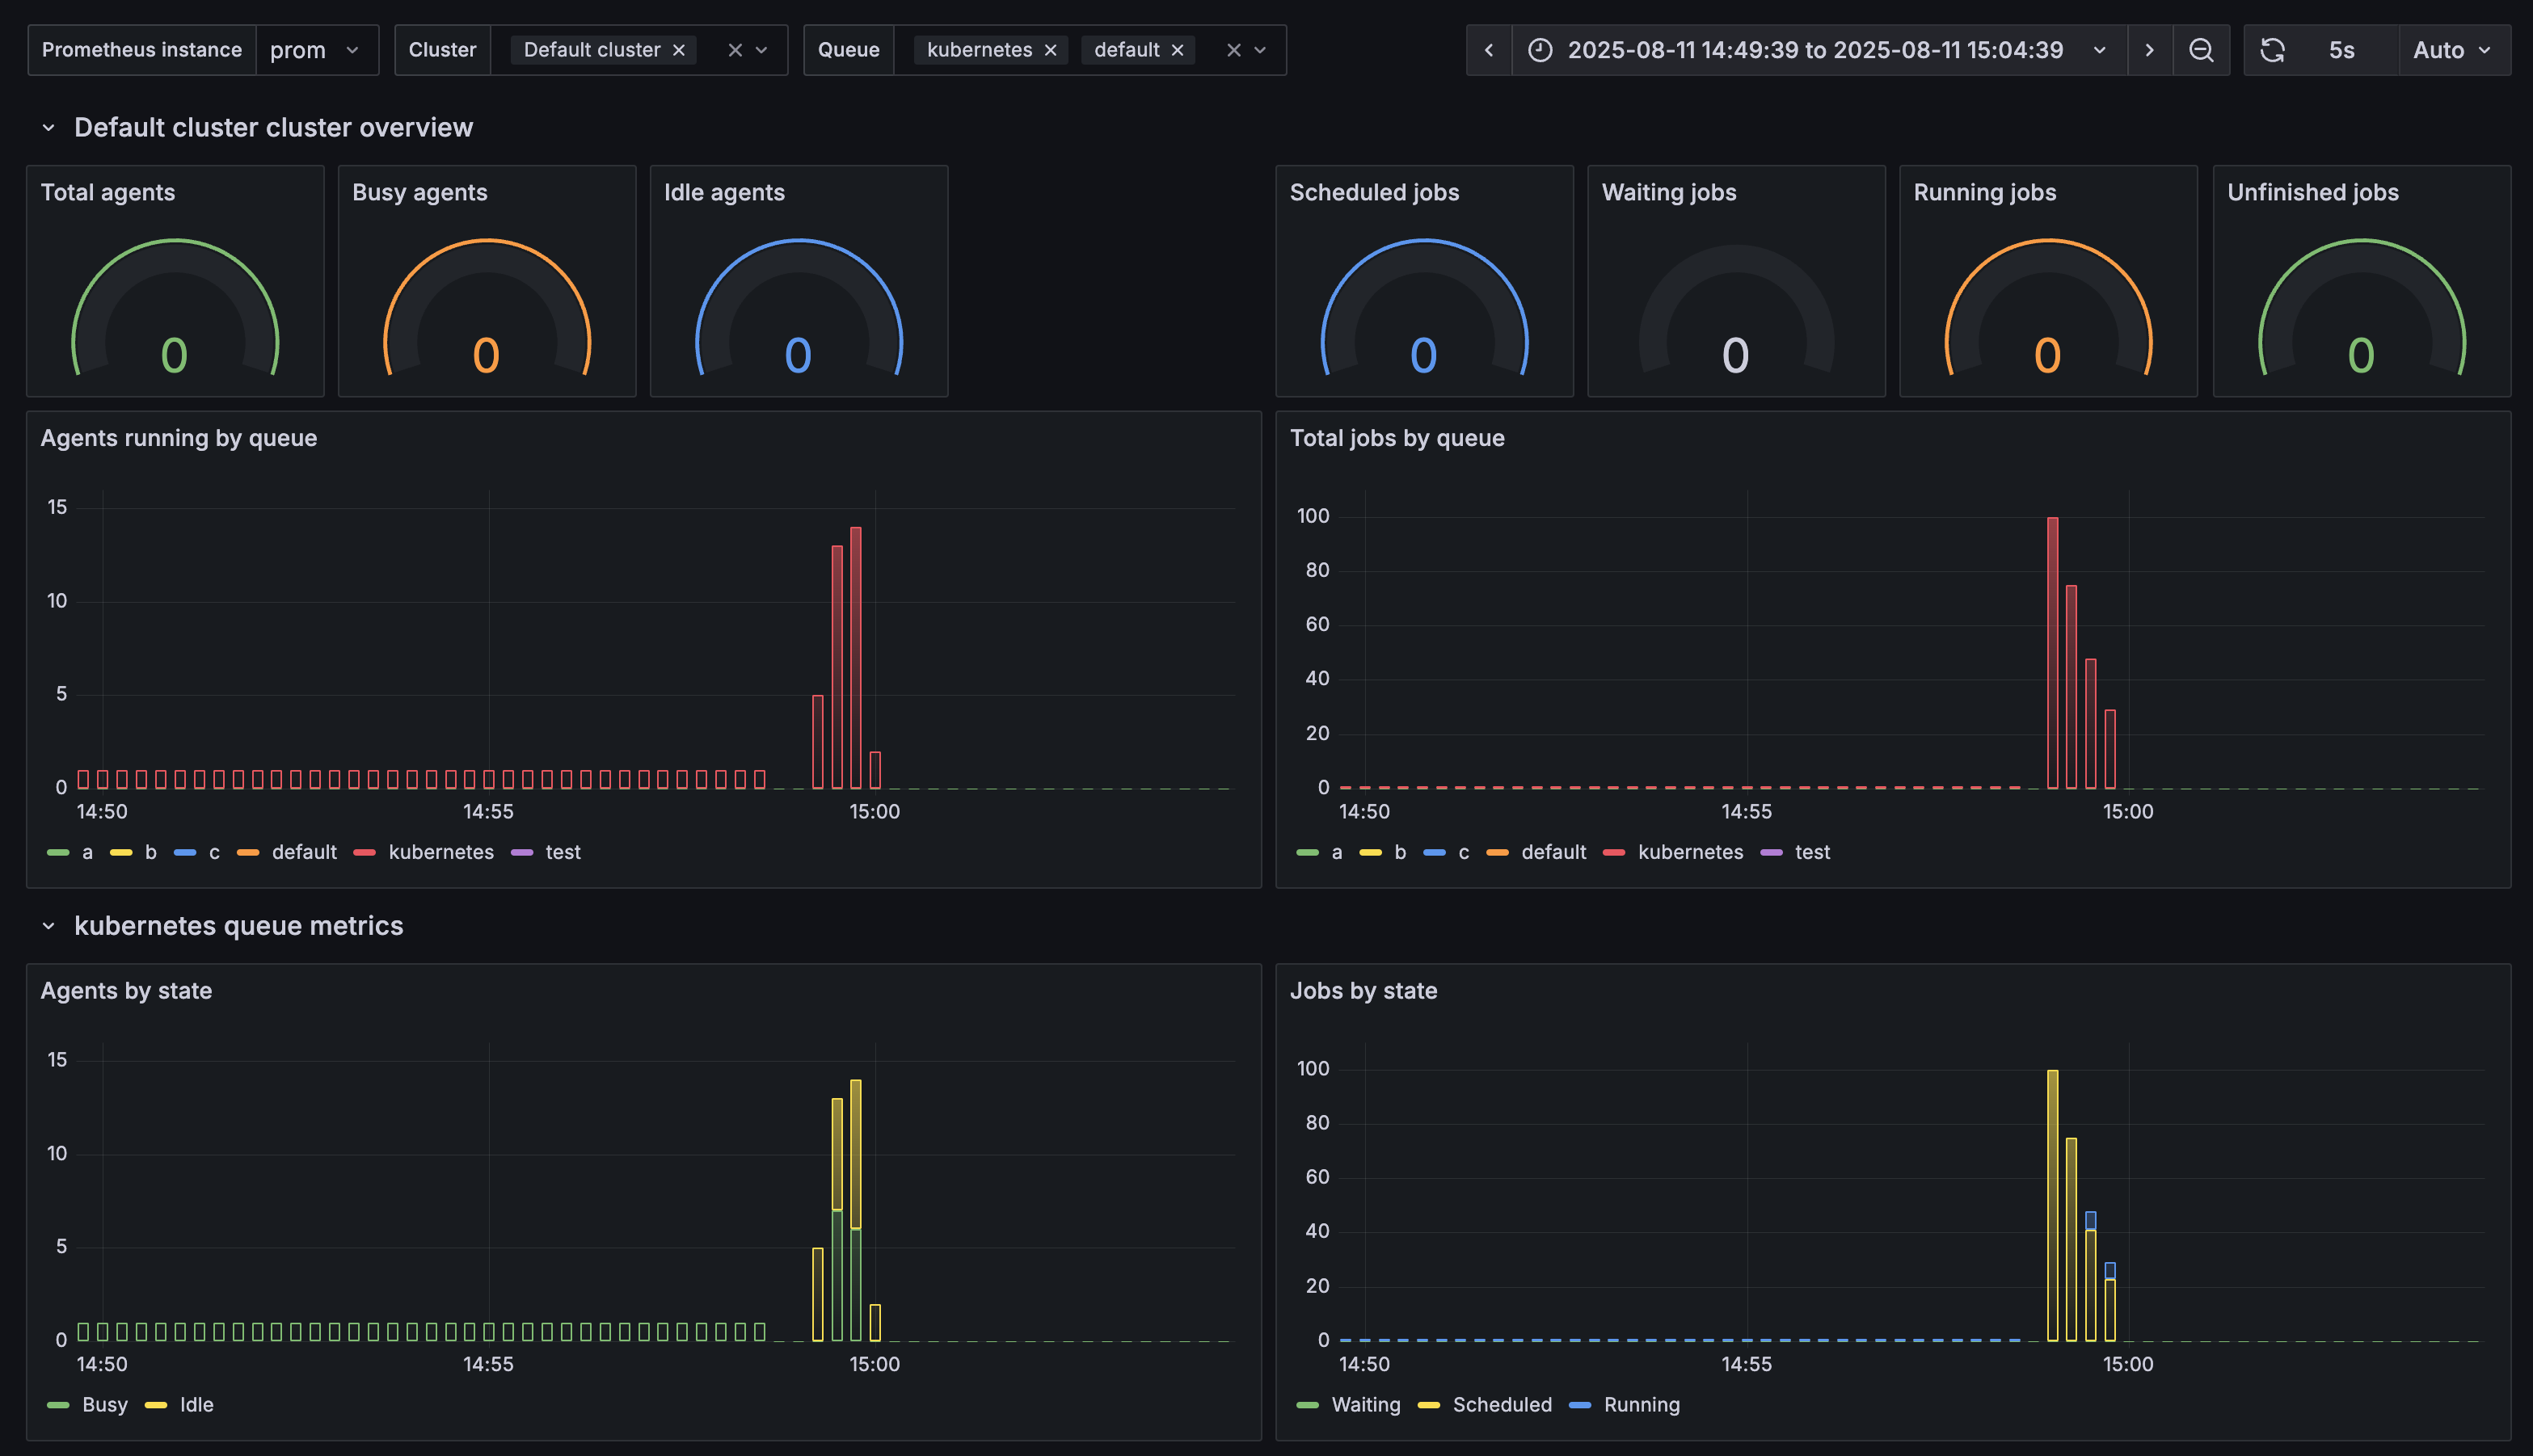
Displays Prometheus metrics collected from the Buildkite Agent Metrics exporter, available at https://github.com/buildkite/buildkite-agent-metrics.
Data source config
Collector type:
Collector plugins:
Collector config:
Revisions
Upload an updated version of an exported dashboard.json file from Grafana
| Revision | Description | Created | |
|---|---|---|---|
| Download |
Grafana Agent
Easily monitor metrics and logs from a Grafana Agent instance with Grafana Cloud's out-of-the-box monitoring solution.
Learn more