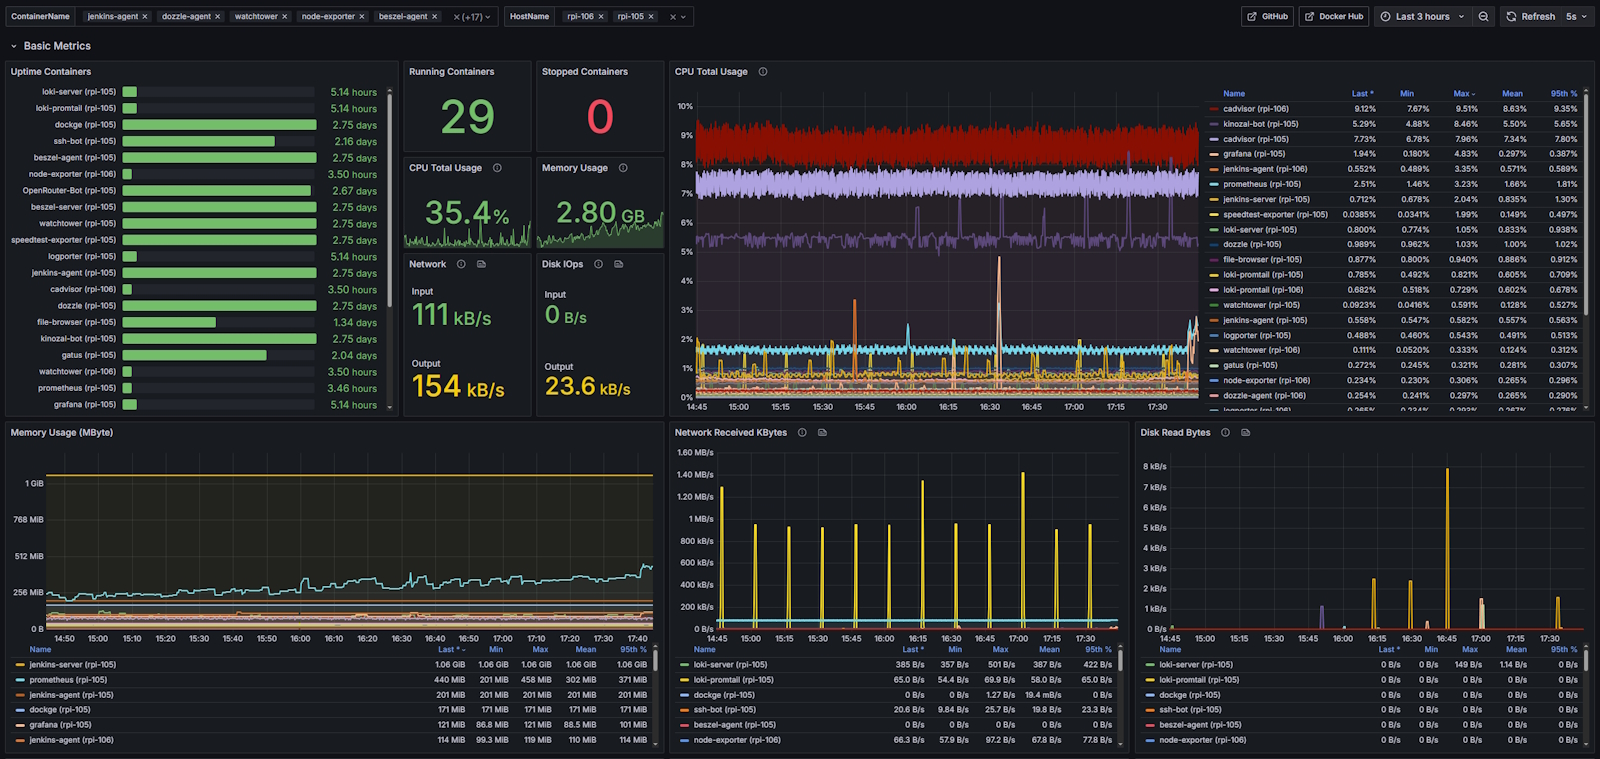
Docker Exporter (logporter)
A simple and lightweight alternative to cAdvisor for getting all basic metrics from Docker containers. Source code: https://github.com/Lifailon/logporter
logporter
A simple and lightweight alternative to cAdvisor for getting all basic metrics from Docker containers with support metrics by logs.
On average, CPU consumption is 15-20 times lower and memory consumption is 10 times lower in the basic metrics mode (including IOps and uptime) compared to
cAdvisor.
Install
- Run the exporter in a container using an image from Docker Hub:
docker run -d --name logporter \
  -v /var/run/docker.sock:/var/run/docker.sock \
  -p 9333:9333 \
  --restart=unless-stopped \
  lifailon/logporter:latest
- Connect the new target in the
prometheus.ymlconfiguration:
scrape_configs:
  - job_name: logporter
    scrape_interval: 5s
    scrape_timeout: 1s
    static_configs:
      - targets:
        - localhost:9333
- Import the prepared public Grafana dashboard using the id
23848or from json file.
Data source config
Collector type:
Collector plugins:
Collector config:
Revisions
Upload an updated version of an exported dashboard.json file from Grafana
| Revision | Description | Created | |
|---|---|---|---|
| Download |
Docker
Easily monitor Docker with Grafana Cloud's out-of-the-box monitoring solution.
Learn more