
Windows Exporter Dashboard 20250801-PandaMan
Windows的Prometheus监控看板展示,增加了资源汇总展示,优化了明细展示。更新支持windows_exporter 0.31.1。已为Grafana v12+ 优化参数。
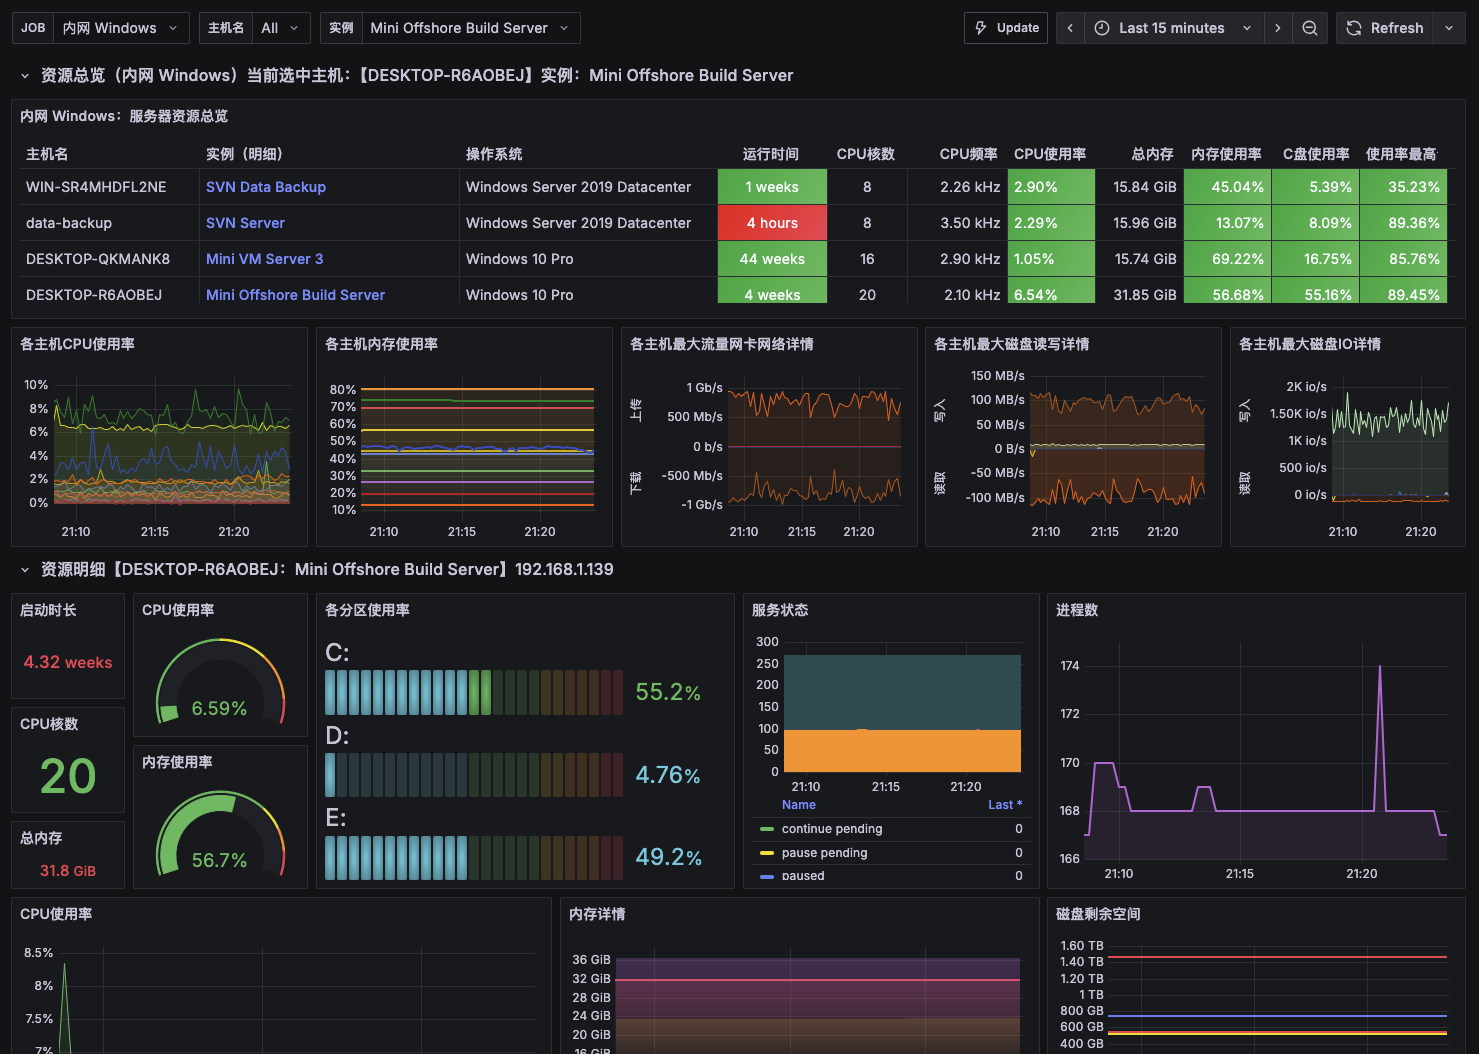
在 廖老大的 https://grafana.com/grafana/dashboards/10467-windows-exporter-for-prometheus-dashboard-cn-v20230531/ 版本基础上修改了新版本的参数
Data source config
Collector type:
Collector plugins:
Collector config:
Revisions
Upload an updated version of an exported dashboard.json file from Grafana
| Revision | Description | Created | |
|---|---|---|---|
| Download |
Windows
Easily monitor your deployment of the Windows operating system with Grafana Cloud's out-of-the-box monitoring solution.
Learn more