
PanDev Diagnostics Dashboard
Add for initial verification of metrics operation
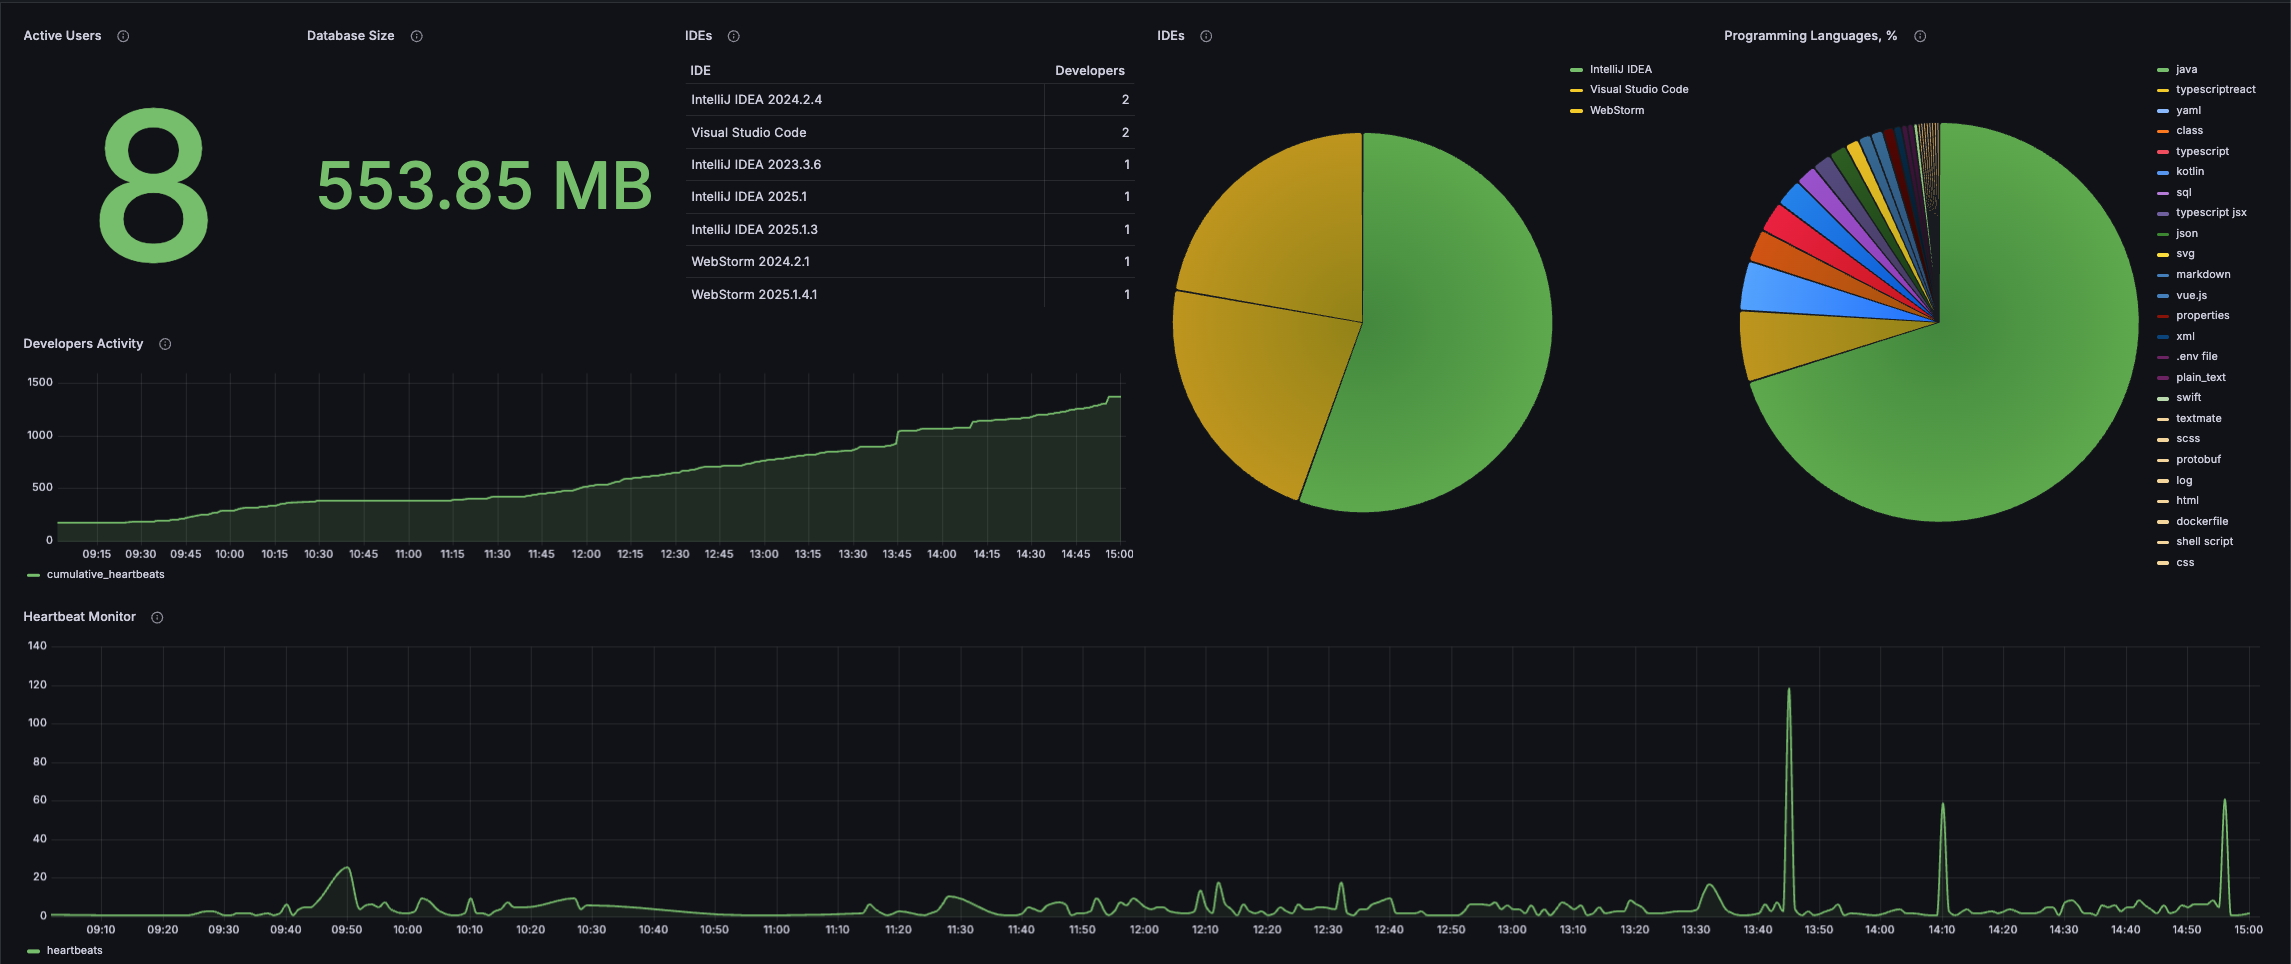
The PanDev Diagnostics Dashboard dashboard uses the grafana-postgresql-datasource data source to create a Grafana dashboard with the piechart, stat, table and timeseries panels.
Data source config
Collector type:
Collector plugins:
Collector config:
Revisions
Upload an updated version of an exported dashboard.json file from Grafana
| Revision | Description | Created | |
|---|---|---|---|
| Download |