
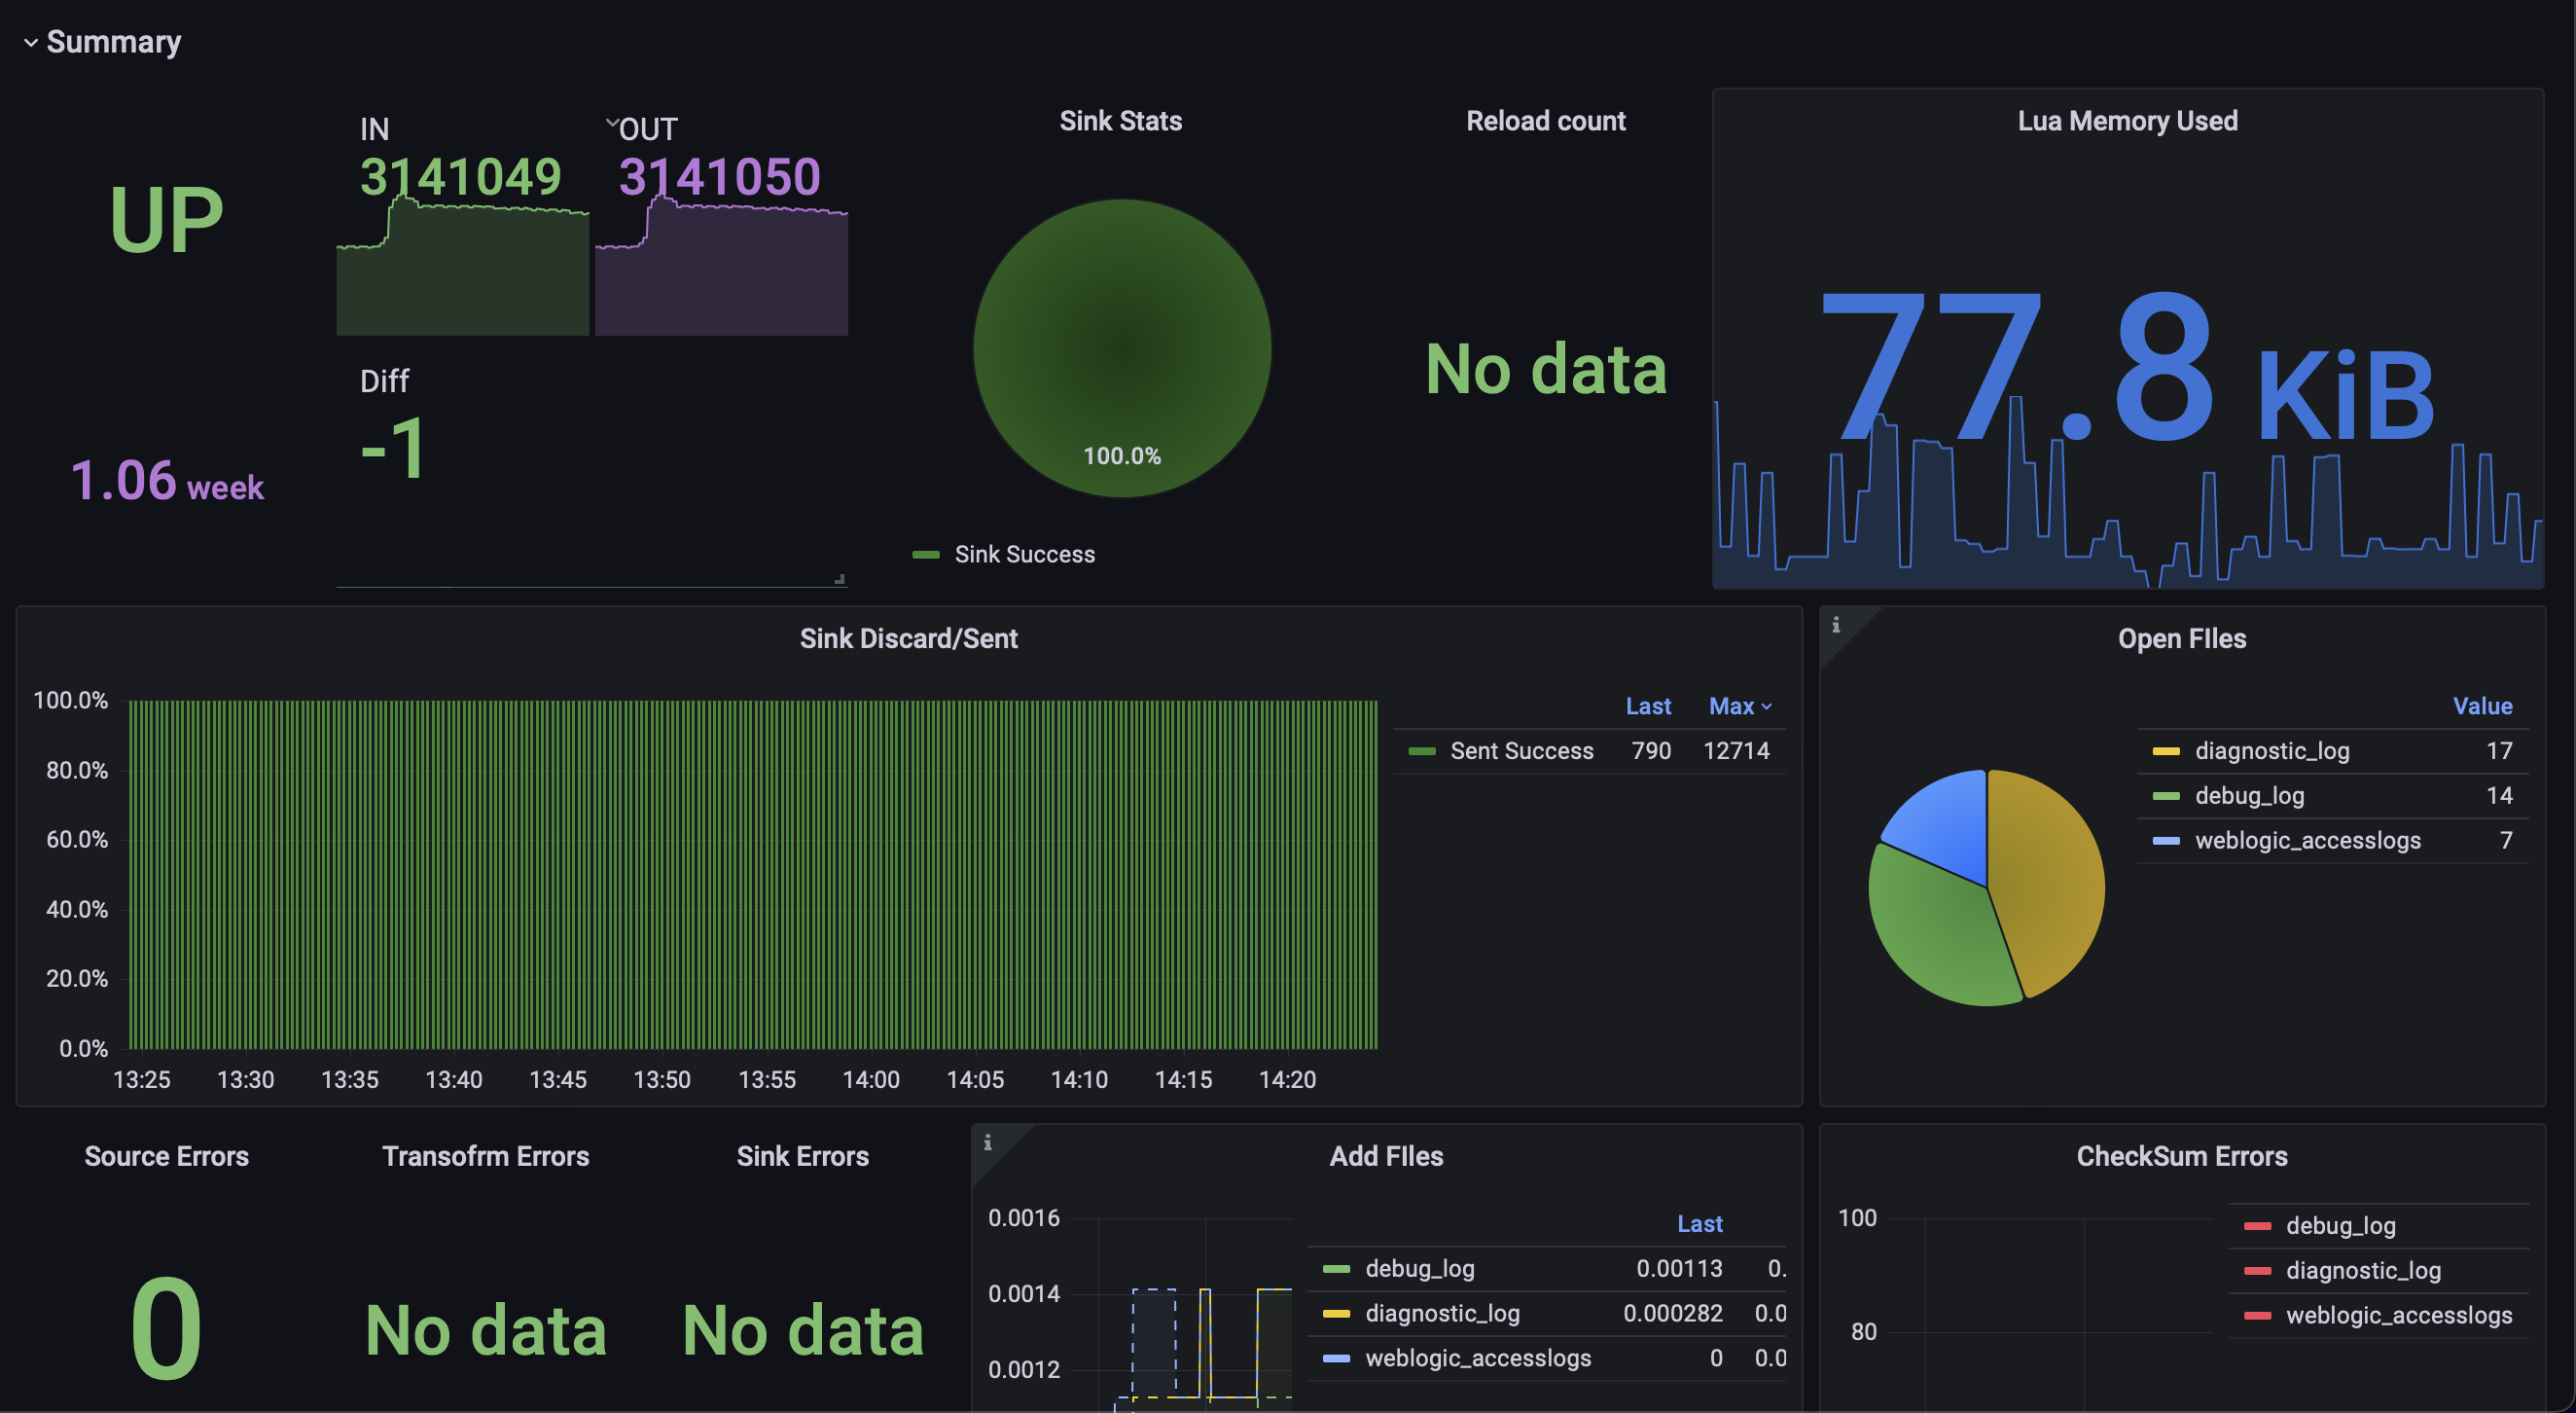
ELK / Vector.dev Monitoring
Maybe the most complete set of graphs for monitoring vector=)
You must config prometheus exporter for vector https://vector.dev/docs/reference/configuration/sinks/prometheus_exporter/
This dashboard for default exporter... works did not complete… may be I update this dashboard later… Enjoy current version! I will appreciate if you left review.
Data source config
Collector type:
Collector plugins:
Collector config:
Revisions
Upload an updated version of an exported dashboard.json file from Grafana
| Revision | Description | Created | |
|---|---|---|---|
| Download |