
JupyterHub Stats
Monitor JupyterHub and Single User Servers
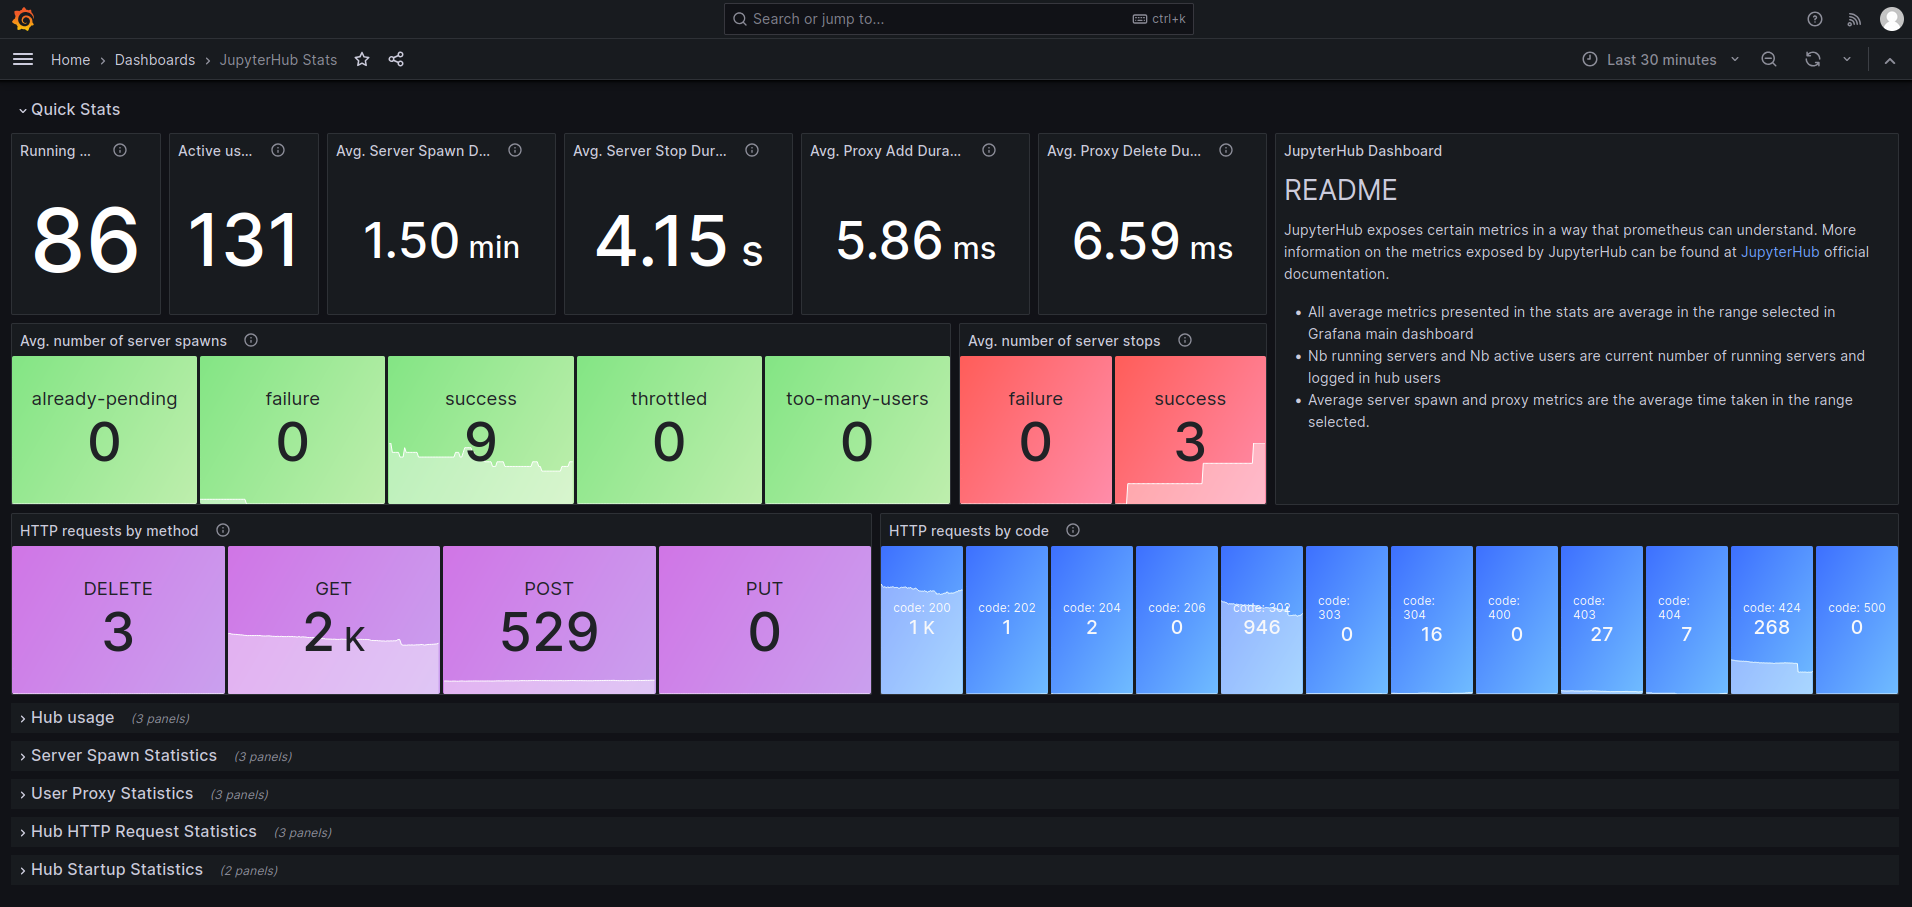
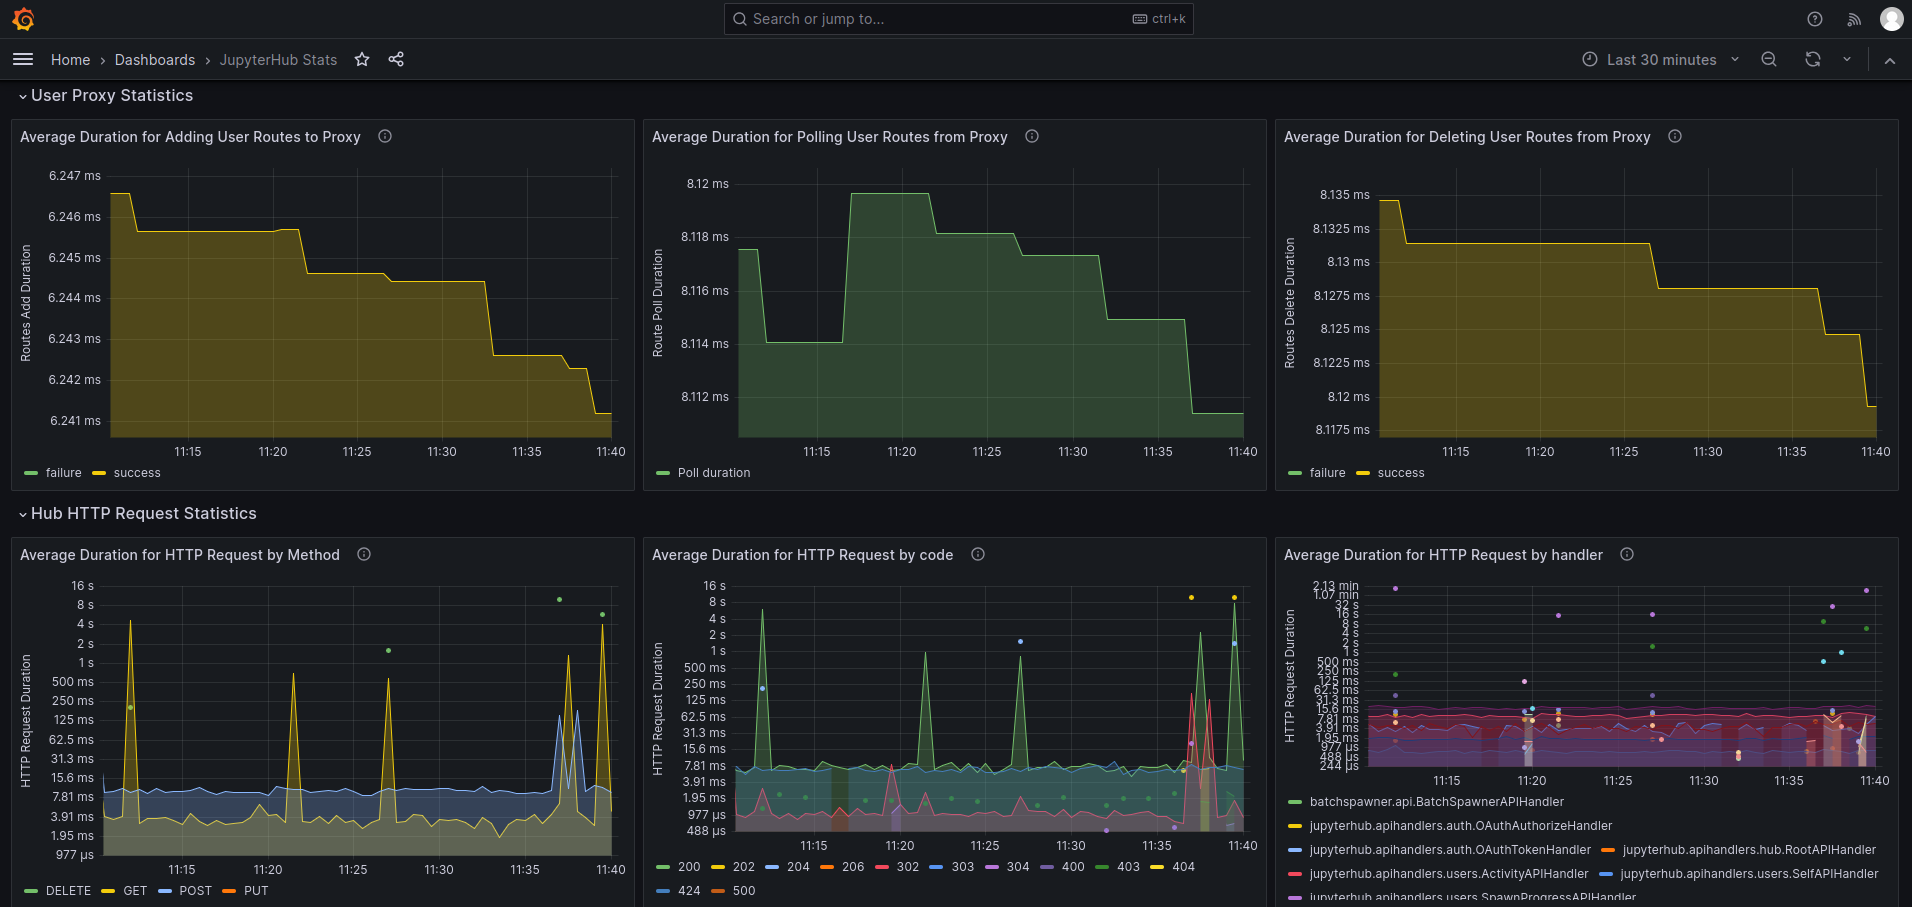
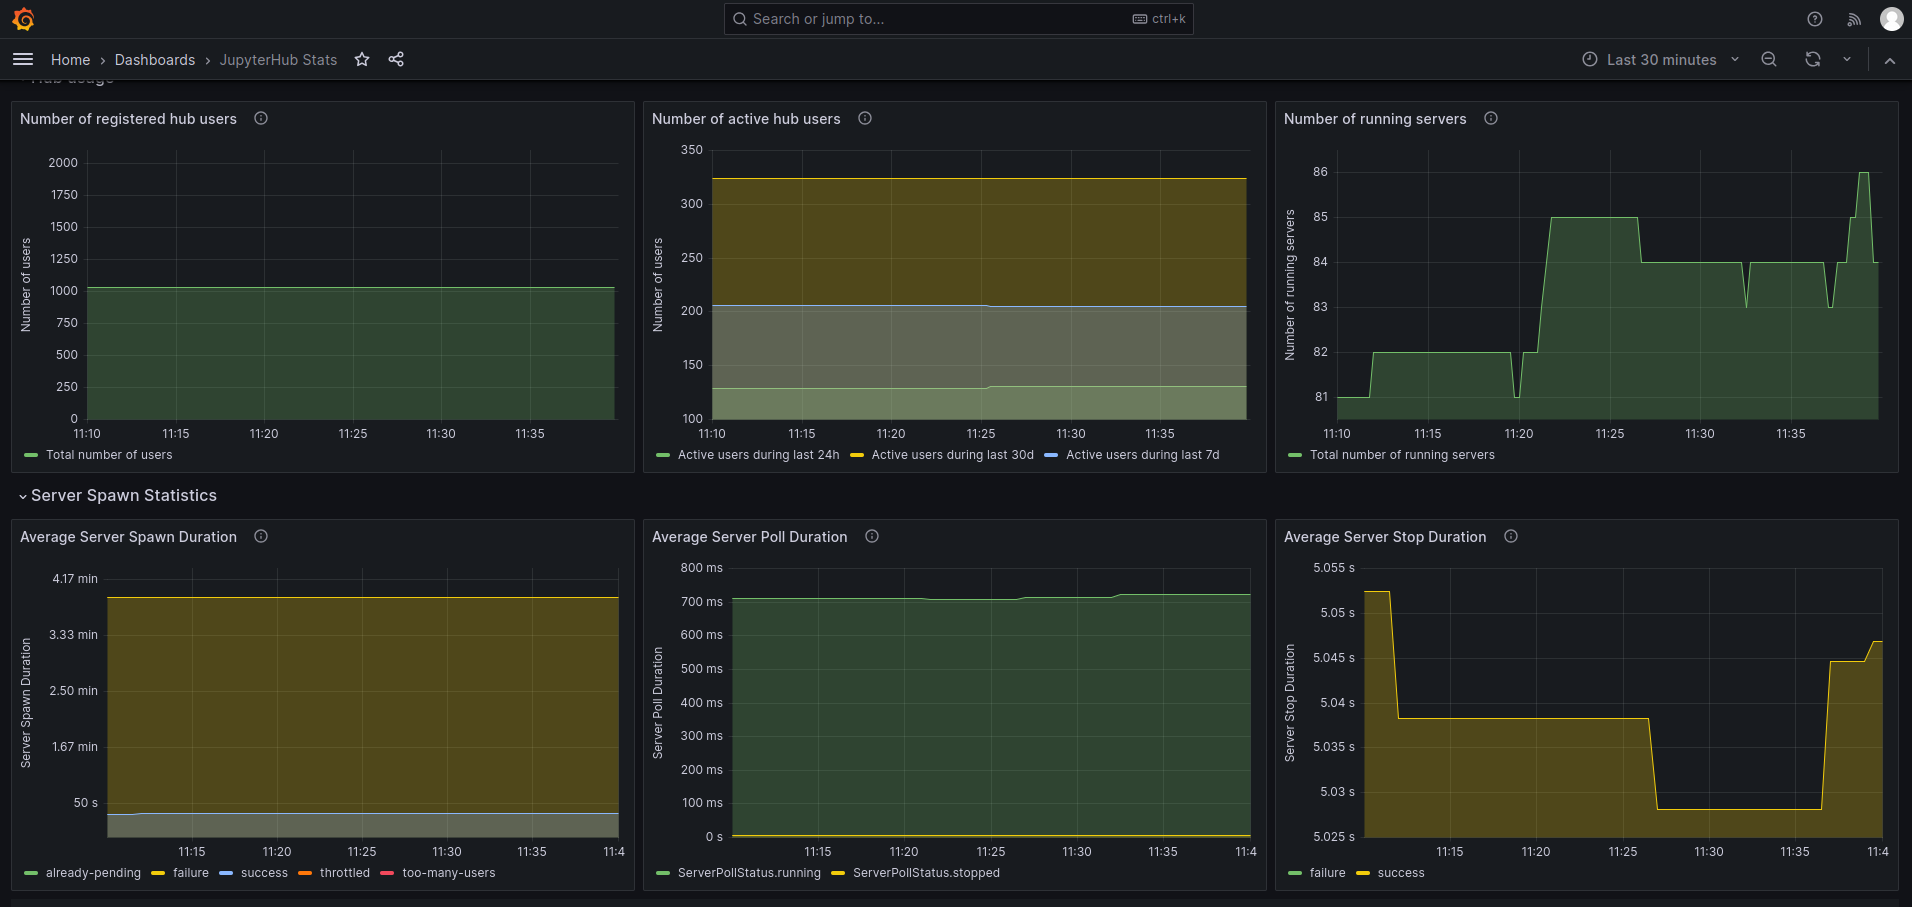
Dashboard to show the Prometheus metrics exported by JupyterHub instances for both Hub and single user servers.
The following config must be included in the JupyterHub config to enable metrics endpoint:
# Create a service to scrape prometheus metrics
c.JupyterHub.services = [
    {
        "name": "service-prometheus",
        "api_token": <api_token>,
    },
]
Add a service role to scrape prometheus metrics
c.JupyterHub.load_roles += [
{
"name": "service-metrics-role",
"description": "access metrics",
"scopes": [
"read:metrics",
],
"services": [
"service-prometheus",
],
}
]
For the Prometheus server, a typical scrape config will look like:
scrape_configs:
  - authorization:
      credentials: <api_token>  # API token registered with hub that allows to access metrics endpoint
    job_name: jupyterhub
    metrics_path: /metrics
    scheme: https  # http if there is no internal TLS
    static_configs:
    - targets:
      - <hub_ip>:<hub_port>
   # If using internal TLS
    tls_config:
      ca_file: /path/to/internal-ssl/hub-ca/hub-ca.crt
      cert_file: /path/to/hub-internal.crt
      insecure_skip_verify: true
      key_file: /path/to/hub-internal.key
Data source config
Collector type:
Collector plugins:
Collector config:
Revisions
Upload an updated version of an exported dashboard.json file from Grafana
| Revision | Description | Created | |
|---|---|---|---|
| Download |