
Prom-Exporter Instance Dashboard v2
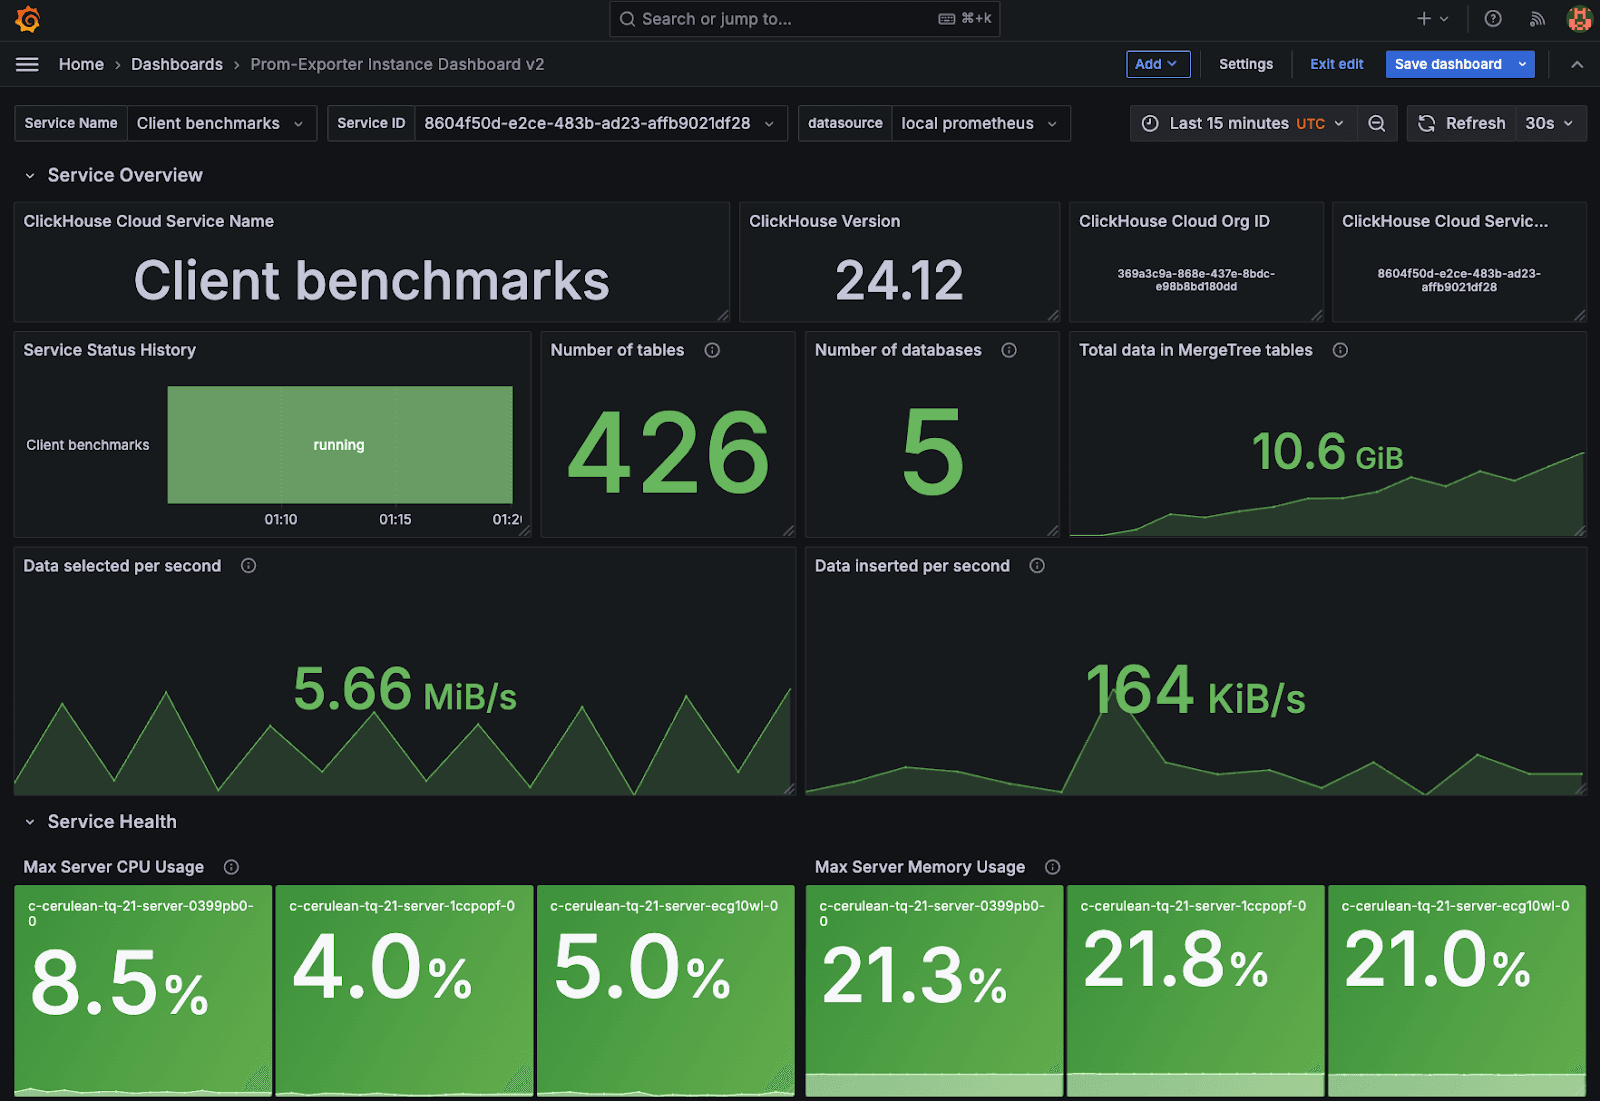
Preconfigured Grafana dashboard for monitoring ClickHouse Cloud services via the ClickHouse Cloud Prometheus API endpoint. It also supports native ClickHouse Prometheus exporter.
Data source config
Collector type:
Collector plugins:
Collector config:
Revisions
Upload an updated version of an exported dashboard.json file from Grafana
| Revision | Description | Created | |
|---|---|---|---|
| Download |