ElasticSearch
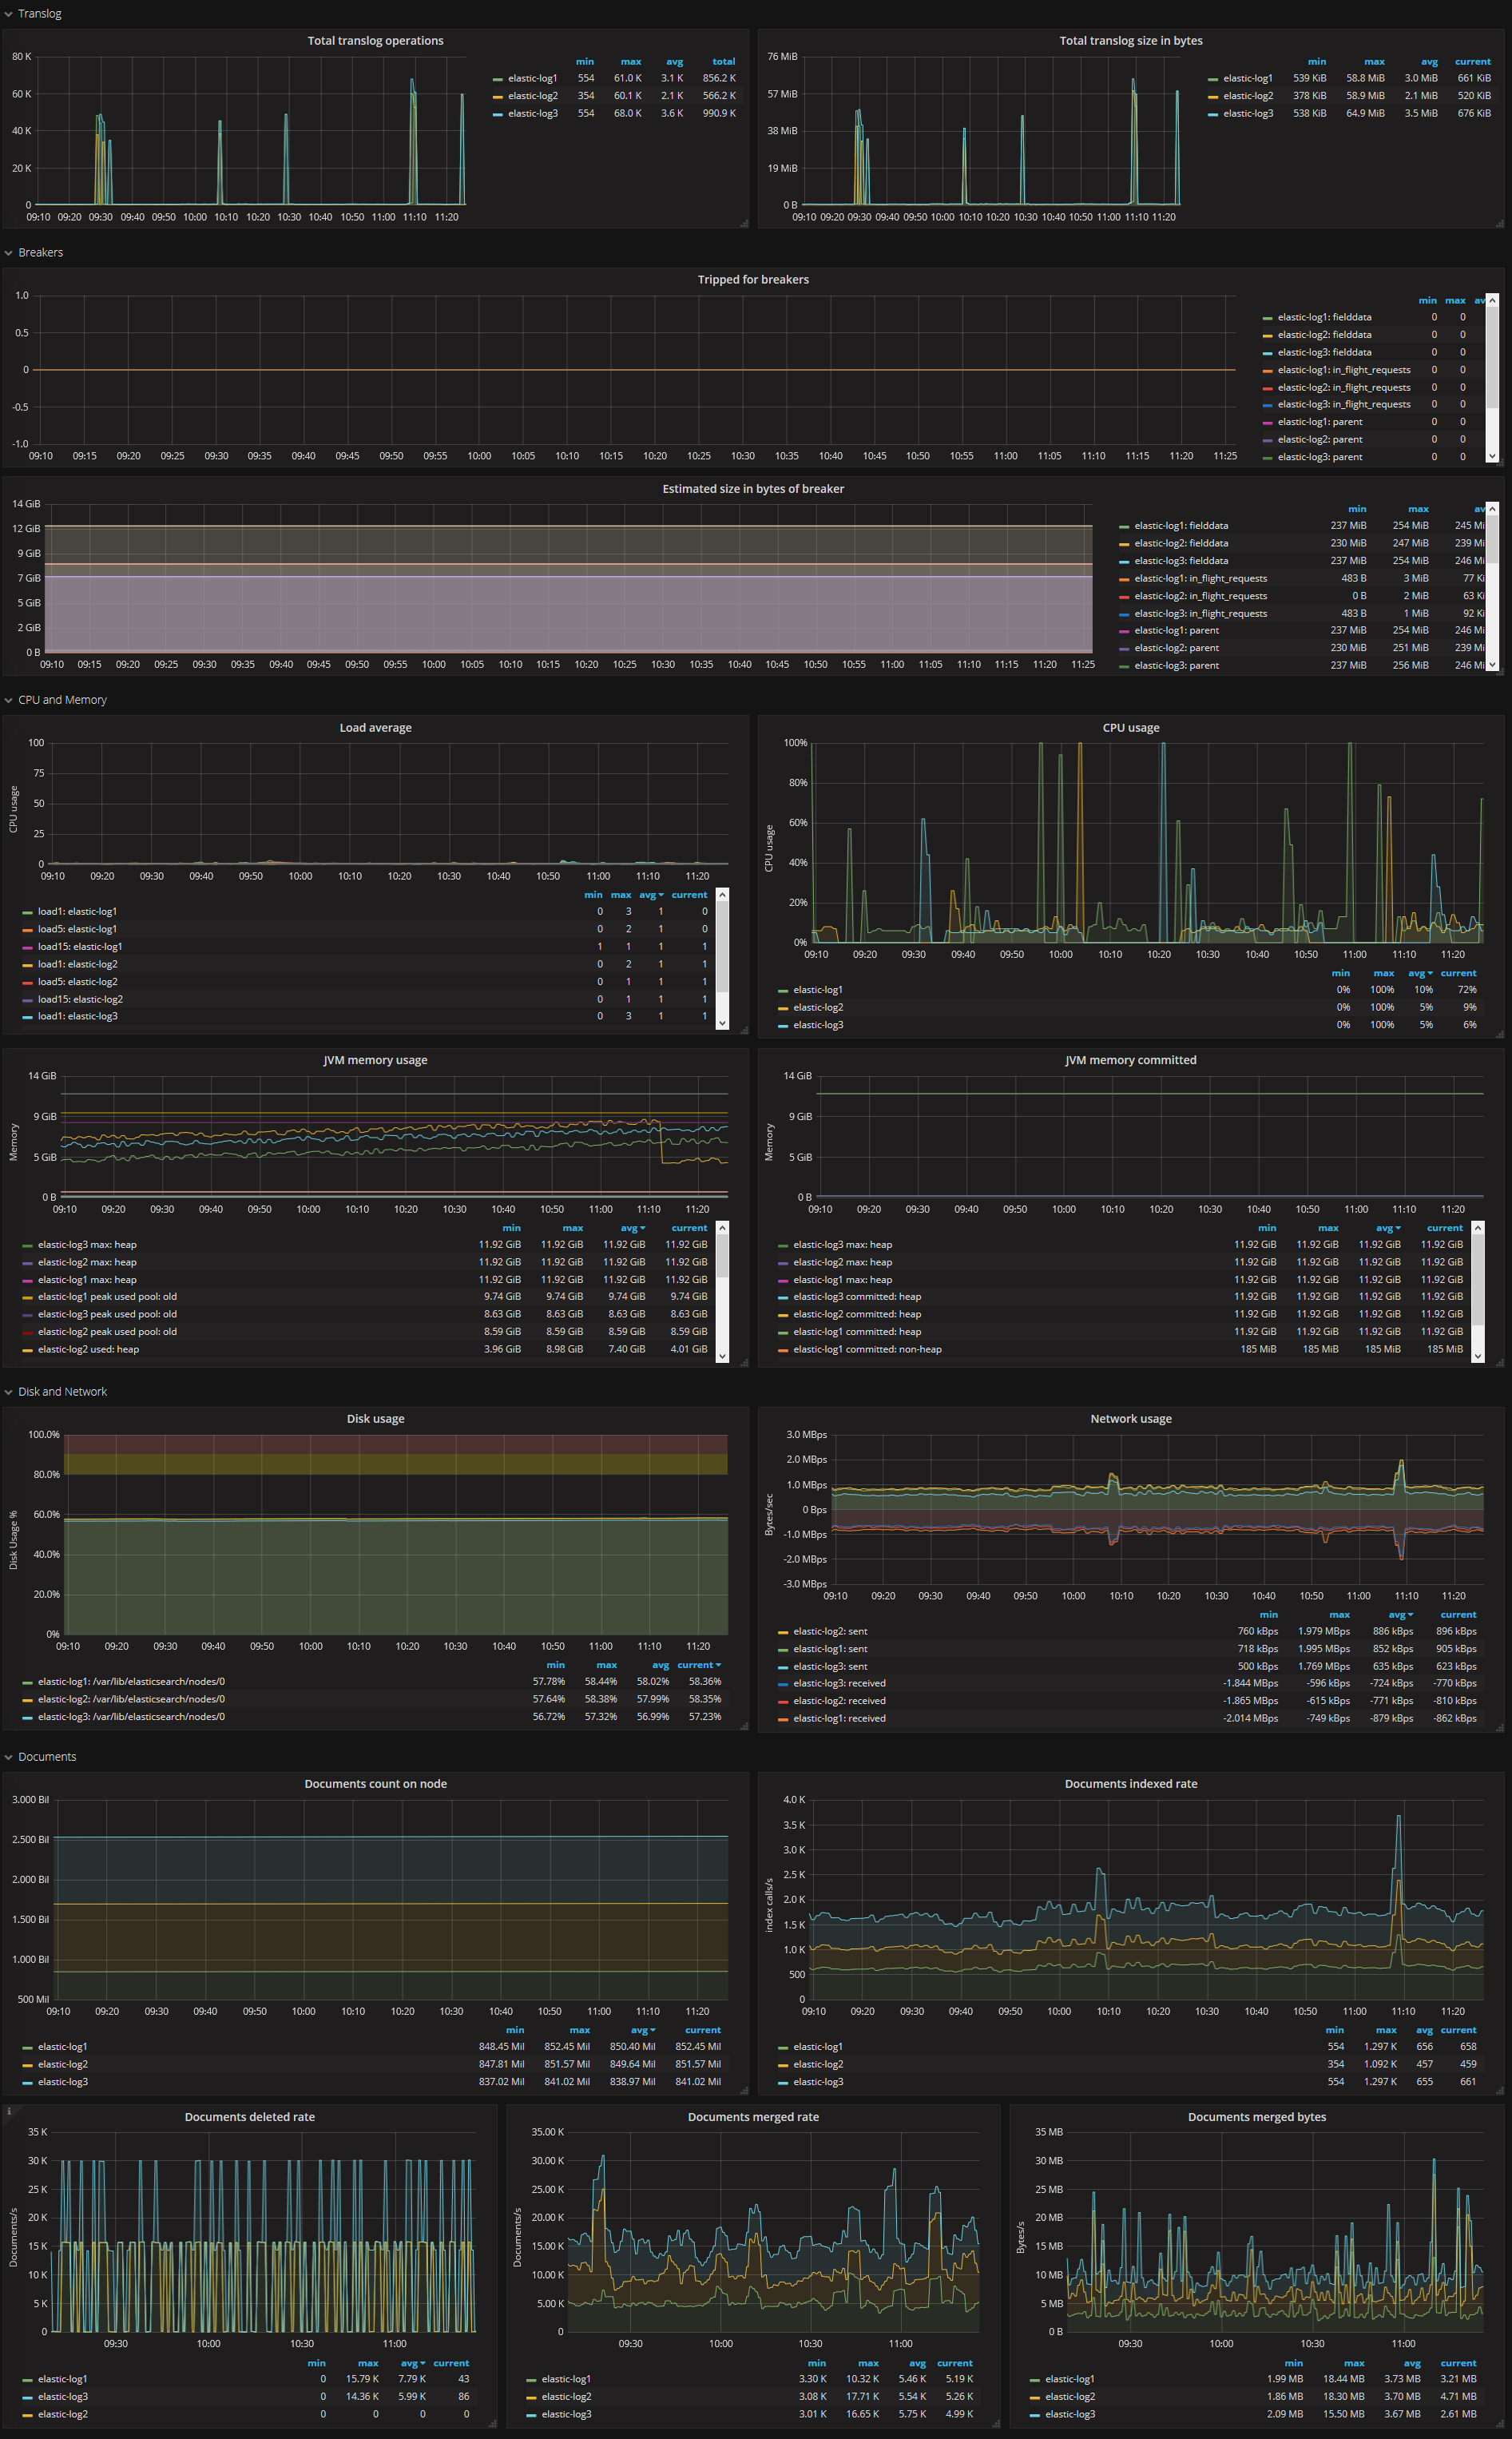
ElasticSearch cluster stats
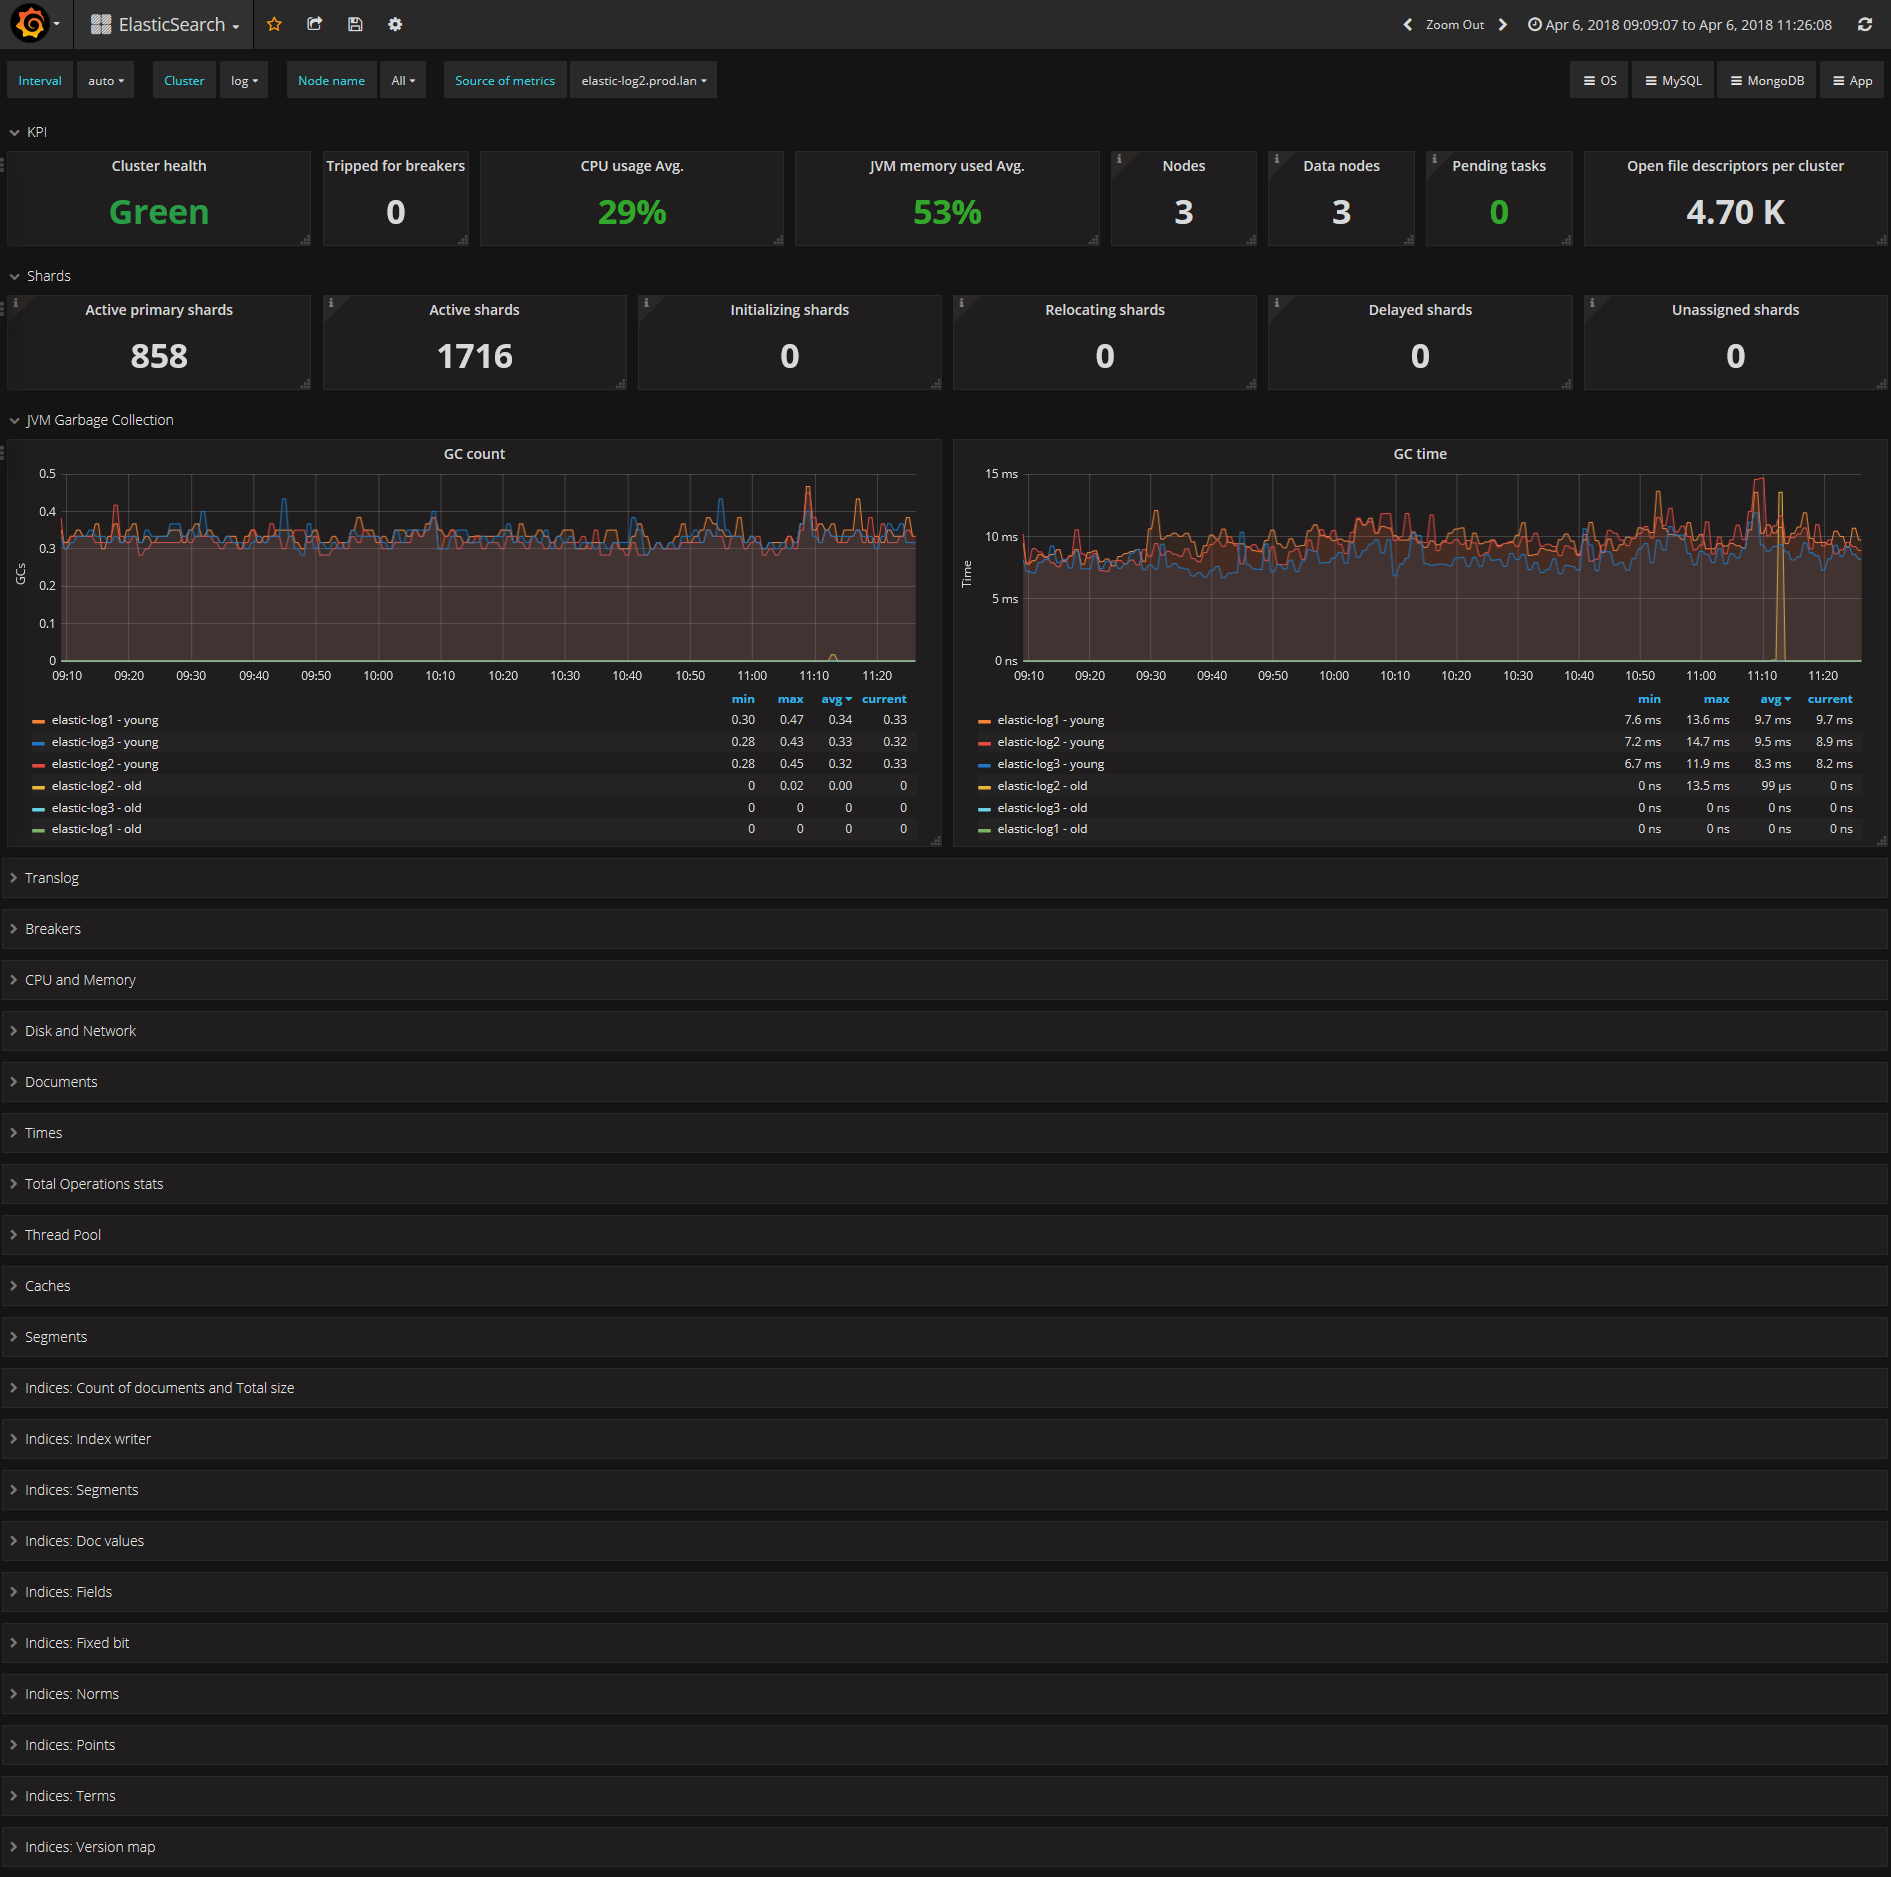
You will need the Prometheus exporter plugin for ElasticSearch ( https://github.com/justwatchcom/elasticsearch_exporter ) to run this dashboard
HOW TO make elasticsearch_exporter on centos-7:
yum  -y install golang
GOPATH=/usr/local go get -u github.com/justwatchcom/elasticsearch_exporter
RUN:
cat << EOF > /etc/systemd/system/elasticsearch_exporter.service
[Unit]
Description=Prometheus elasticsearch_exporter
After=local-fs.target network-online.target network.target
Wants=local-fs.target network-online.target network.target
[Service]
User=root
Nice=10
ExecStart = /usr/local/bin/elasticsearch_exporter -es.all -es.indices -es.timeout 20s
ExecStop= /usr/bin/killall elasticsearch_exporter
[Install]
WantedBy=default.target
EOF
systemctl daemon-reload
systemctl enable elasticsearch_exporter.service
systemctl start  elasticsearch_exporter.service
Exampe config for prometheus.yml:
  - job_name: elasticsearch
    scrape_interval: 60s
    scrape_timeout:  30s
    metrics_path: "/metrics"
    static_configs:
    - targets:
      - elastic2.test.lan:9108
      - elastic-log2.prod.lan:9108
      labels:
        service: elasticsearch
    relabel_configs:
    - source_labels: [__address__]
      regex: '(.*)\:9108'
      target_label:  'instance'
      replacement:   '$1'
    - source_labels: [__address__]
      regex:         '.*\.(.*)\.lan.*'
      target_label:  'environment'
      replacement:   '$1'
Exampe config for prometheus alerts.rules:
ALERT Elastic_UP
  IF elasticsearch_up{job="elasticsearch"} != 1
  FOR 120s
  LABELS { severity="alert", value = "{{$value}}" }
  ANNOTATIONS {
    summary = "Instance {{ $labels.instance }}: Elasticsearch instance status is not 1",
    description = "This server's Elasticsearch instance status has a value of {{ $value }}.",
  }
ALERT Elastic_Cluster_Health_RED
IF elasticsearch_cluster_health_status{color="red"}==1
FOR 300s
LABELS { severity="alert", value = "{{$value}}" }
ANNOTATIONS {
summary = "Instance {{ $labels.instance }}: not all primary and replica shards are allocated in elasticsearch cluster {{ $labels.cluster }}",
description = "Instance {{ $labels.instance }}: not all primary and replica shards are allocated in elasticsearch cluster {{ $labels.cluster }}.",
}
ALERT Elastic_Cluster_Health_Yellow
IF elasticsearch_cluster_health_status{color="yellow"}==1
FOR 300s
LABELS { severity="alert", value = "{{$value}}" }
ANNOTATIONS {
summary = "Instance {{ $labels.instance }}: not all primary and replica shards are allocated in elasticsearch cluster {{ $labels.cluster }}",
description = "Instance {{ $labels.instance }}: not all primary and replica shards are allocated in elasticsearch cluster {{ $labels.cluster }}.",
}
ALERT Elasticsearch_JVM_Heap_Too_High
IF elasticsearch_jvm_memory_used_bytes{area="heap"} / elasticsearch_jvm_memory_max_bytes{area="heap"} > 0.8
FOR 15m
LABELS { severity="alert", value = "{{$value}}" }
ANNOTATIONS {
summary = "ElasticSearch node {{ $labels.instance }} heap usage is high",
description = "The heap in {{ $labels.instance }} is over 80% for 15m.",
}
ALERT Elasticsearch_health_up
IF elasticsearch_cluster_health_up !=1
FOR 1m
LABELS { severity="alert", value = "{{$value}}" }
ANNOTATIONS {
summary = "ElasticSearch node: {{ $labels.instance }} last scrape of the ElasticSearch cluster health failed",
description = "ElasticSearch node: {{ $labels.instance }} last scrape of the ElasticSearch cluster health failed",
}
ALERT Elasticsearch_Too_Few_Nodes_Running
IF elasticsearch_cluster_health_number_of_nodes < 3
FOR 5m
LABELS { severity="alert", value = "{{$value}}" }
ANNOTATIONS {
description="There are only {{$value}} < 3 ElasticSearch nodes running",
summary="ElasticSearch running on less than 3 nodes"
}
ALERT Elasticsearch_Count_of_JVM_GC_Runs
IF rate(elasticsearch_jvm_gc_collection_seconds_count{}[5m])>5
FOR 60s
LABELS { severity="warning", value = "{{$value}}" }
ANNOTATIONS {
summary = "ElasticSearch node {{ $labels.instance }}: Count of JVM GC runs > 5 per sec and has a value of {{ $value }}",
description = "ElasticSearch node {{ $labels.instance }}: Count of JVM GC runs > 5 per sec and has a value of {{ $value }}",
}
ALERT Elasticsearch_GC_Run_Time
IF rate(elasticsearch_jvm_gc_collection_seconds_sum[5m])>0.3
FOR 60s
LABELS { severity="warning", value = "{{$value}}" }
ANNOTATIONS {
summary = "ElasticSearch node {{ $labels.instance }}: GC run time in seconds > 0.3 sec and has a value of {{ $value }}",
description = "ElasticSearch node {{ $labels.instance }}: GC run time in seconds > 0.3 sec and has a value of {{ $value }}",
}
ALERT Elasticsearch_json_parse_failures
IF elasticsearch_cluster_health_json_parse_failures>0
FOR 60s
LABELS { severity="warning", value = "{{$value}}" }
ANNOTATIONS {
summary = "ElasticSearch node {{ $labels.instance }}: json parse failures > 0 and has a value of {{ $value }}",
description = "ElasticSearch node {{ $labels.instance }}: json parse failures > 0 and has a value of {{ $value }}",
}
ALERT Elasticsearch_breakers_tripped
IF rate(elasticsearch_breakers_tripped{}[5m])>0
FOR 60s
LABELS { severity="warning", value = "{{$value}}" }
ANNOTATIONS {
summary = "ElasticSearch node {{ $labels.instance }}: breakers tripped > 0 and has a value of {{ $value }}",
description = "ElasticSearch node {{ $labels.instance }}: breakers tripped > 0 and has a value of {{ $value }}",
}
ALERT Elasticsearch_health_timed_out
IF elasticsearch_cluster_health_timed_out>0
FOR 60s
LABELS { severity="warning", value = "{{$value}}" }
ANNOTATIONS {
summary = "ElasticSearch node {{ $labels.instance }}: Number of cluster health checks timed out > 0 and has a value of {{ $value }}",
description = "ElasticSearch node {{ $labels.instance }}: Number of cluster health checks timed out > 0 and has a value of {{ $value }}",
}
Data source config
Collector config:
Upload an updated version of an exported dashboard.json file from Grafana
| Revision | Description | Created | |
|---|---|---|---|
| Download |
Elasticsearch
Easily monitor Elasticsearch, a distributed, multitenant full-text search engine, with Grafana Cloud's out-of-the-box monitoring solution.
Learn more