
WUD - What's up Docker
Dashboard for WUD (What's up Docker)
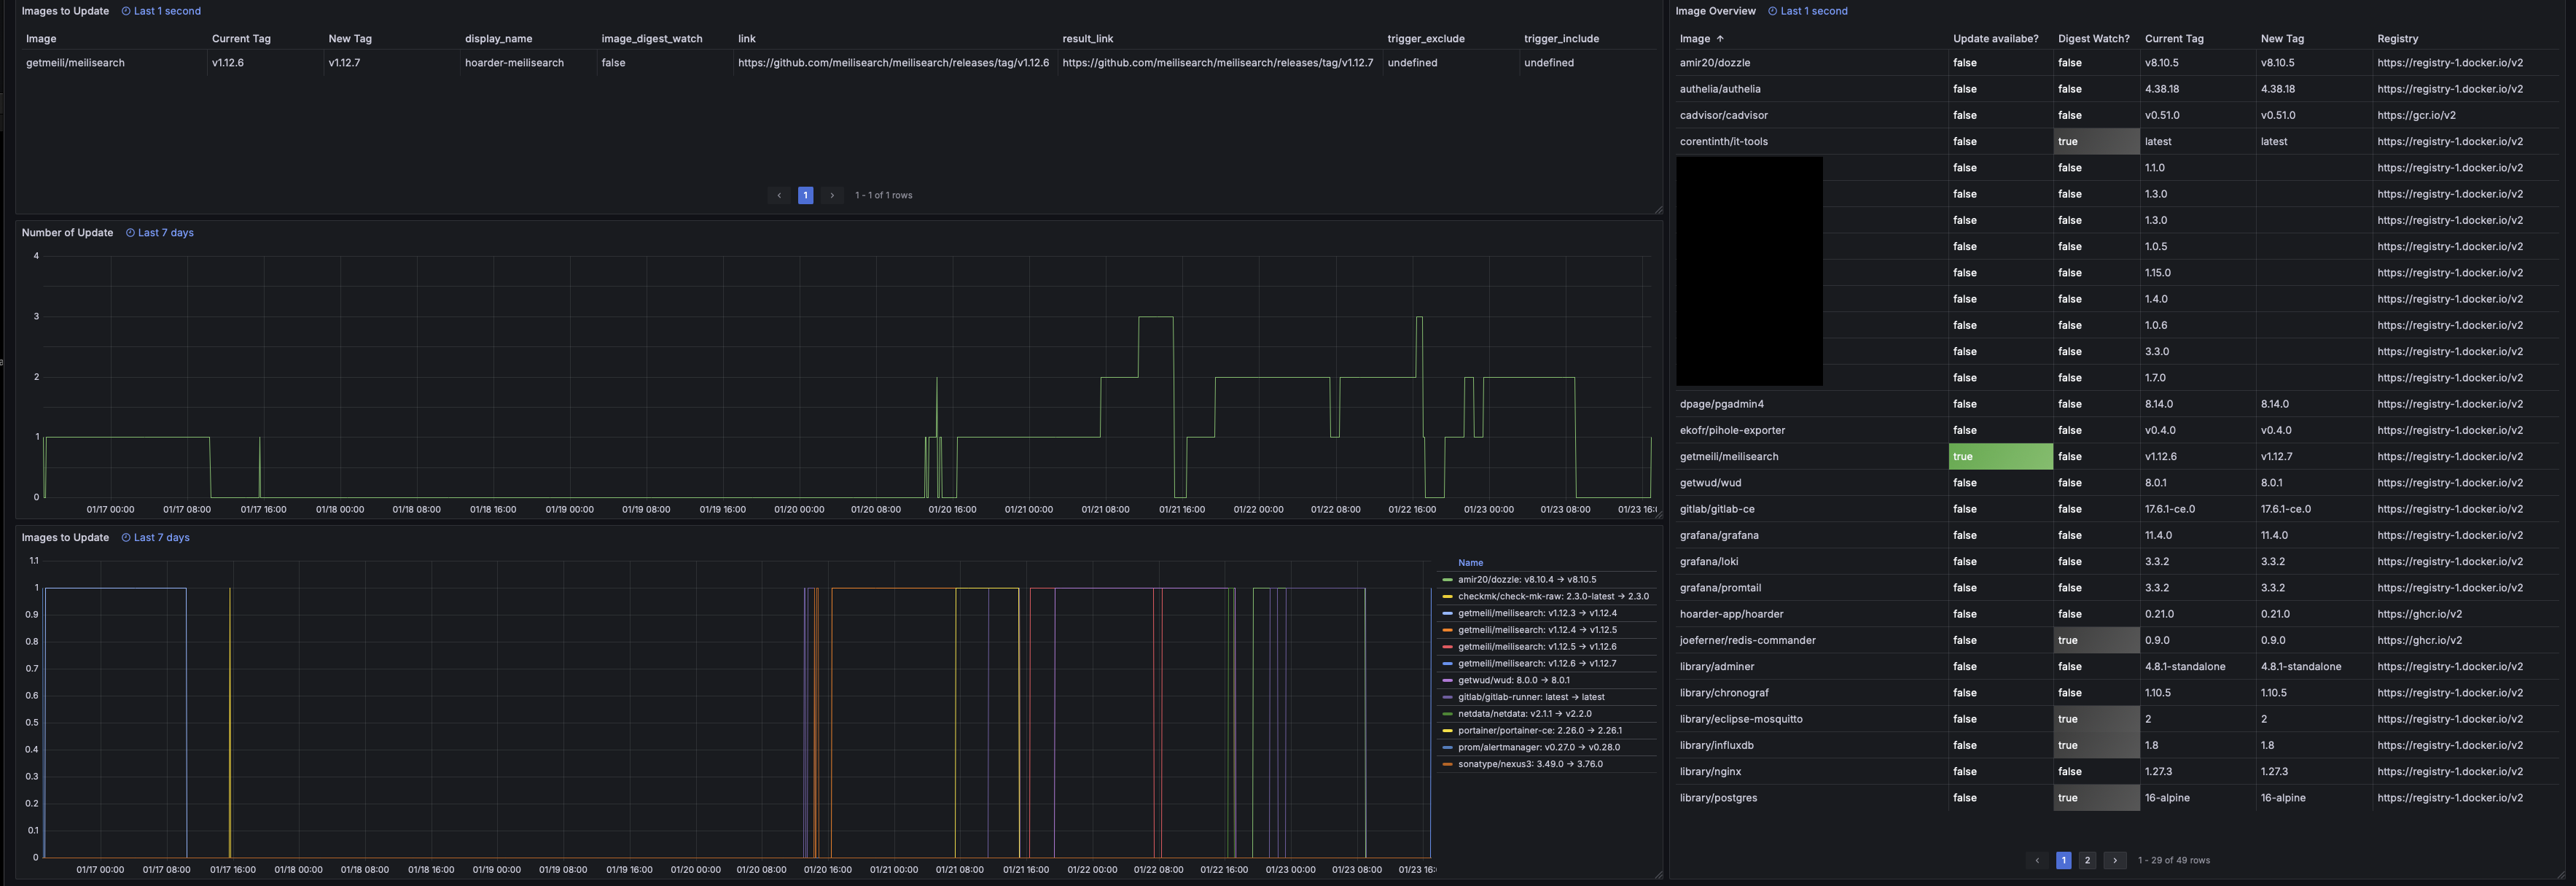
Grafana Dashboard for WUD (What's up Docker) using builtin Prometheus Metrics under /metrics.
Please update the link under settings!
More informations under WUD Project site https://github.com/getwud/wud
Data source config
Collector type:
Collector plugins:
Collector config:
Revisions
Upload an updated version of an exported dashboard.json file from Grafana
| Revision | Description | Created | |
|---|---|---|---|
| Download |
Docker
Easily monitor Docker with Grafana Cloud's out-of-the-box monitoring solution.
Learn more