
SERVERware
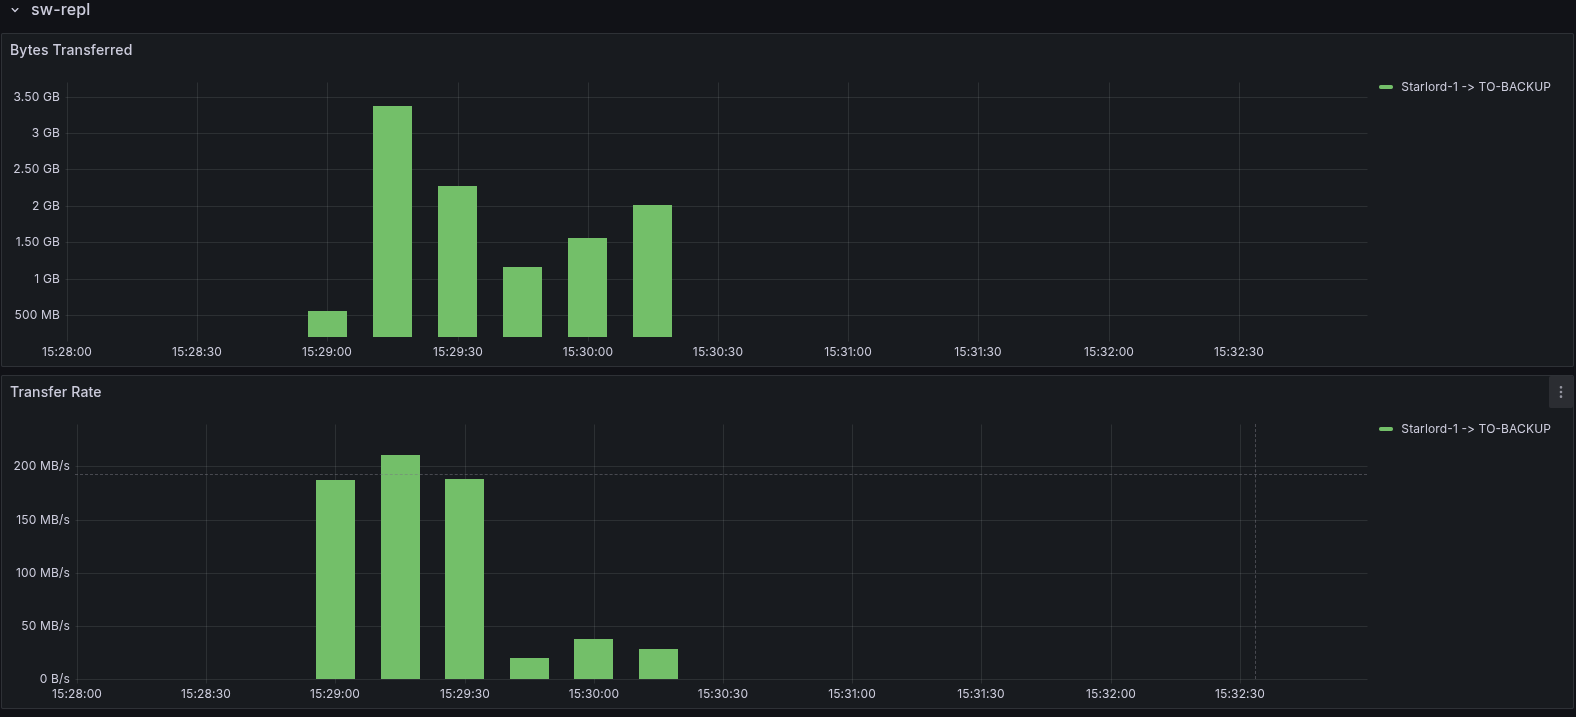
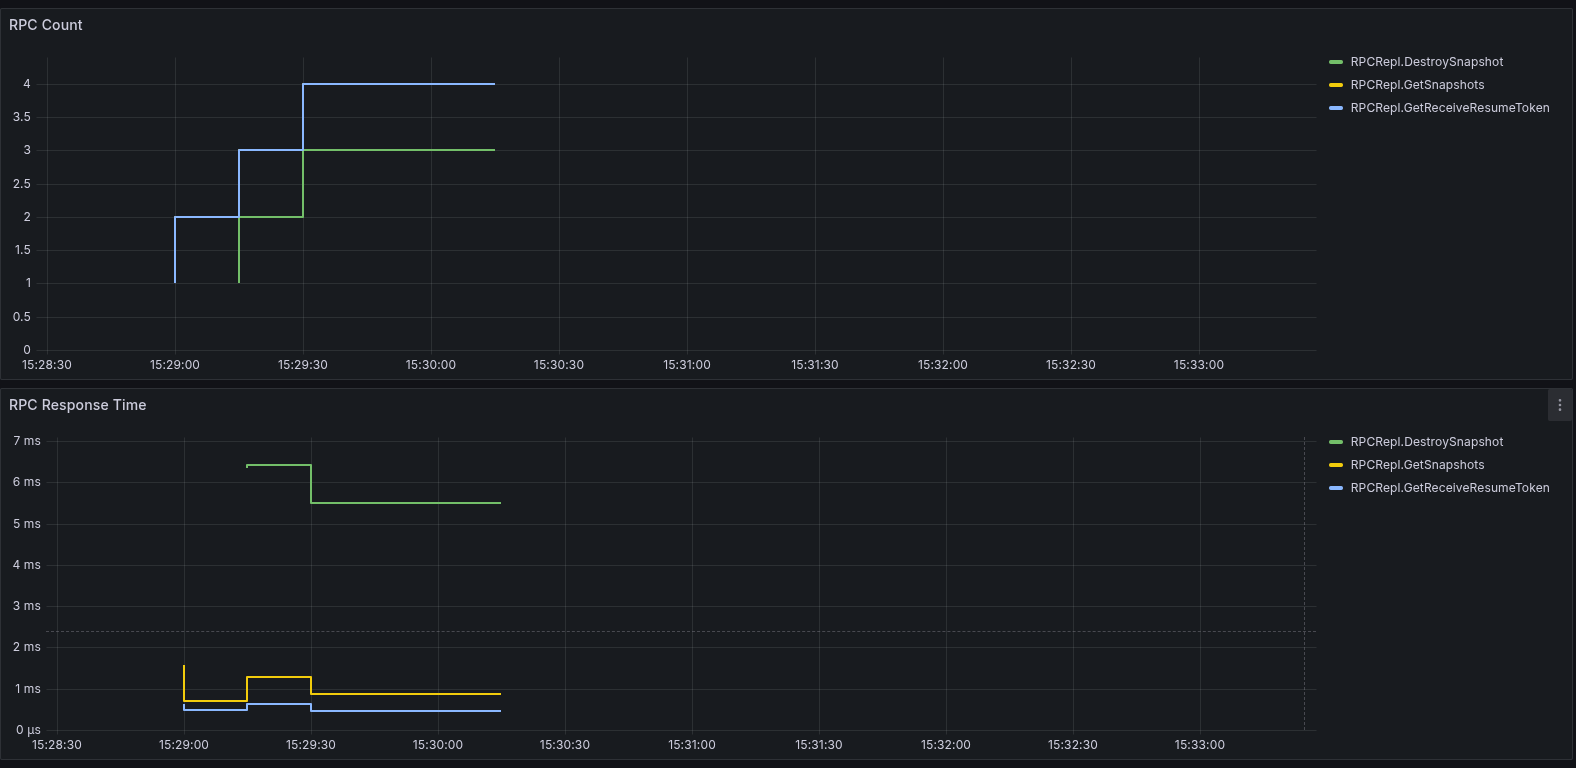
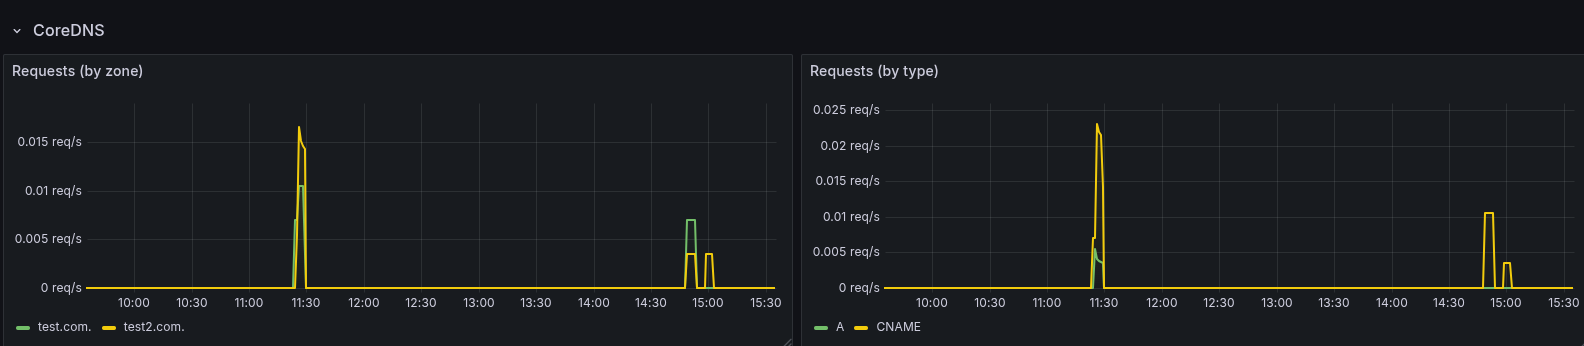
The SERVERware dashboard uses the prometheus data source to create a Grafana dashboard with the gauge, piechart and timeseries panels. Contains panels for VPS calls, CoreDNS, sw-repl and metrics for processes running in VPS.
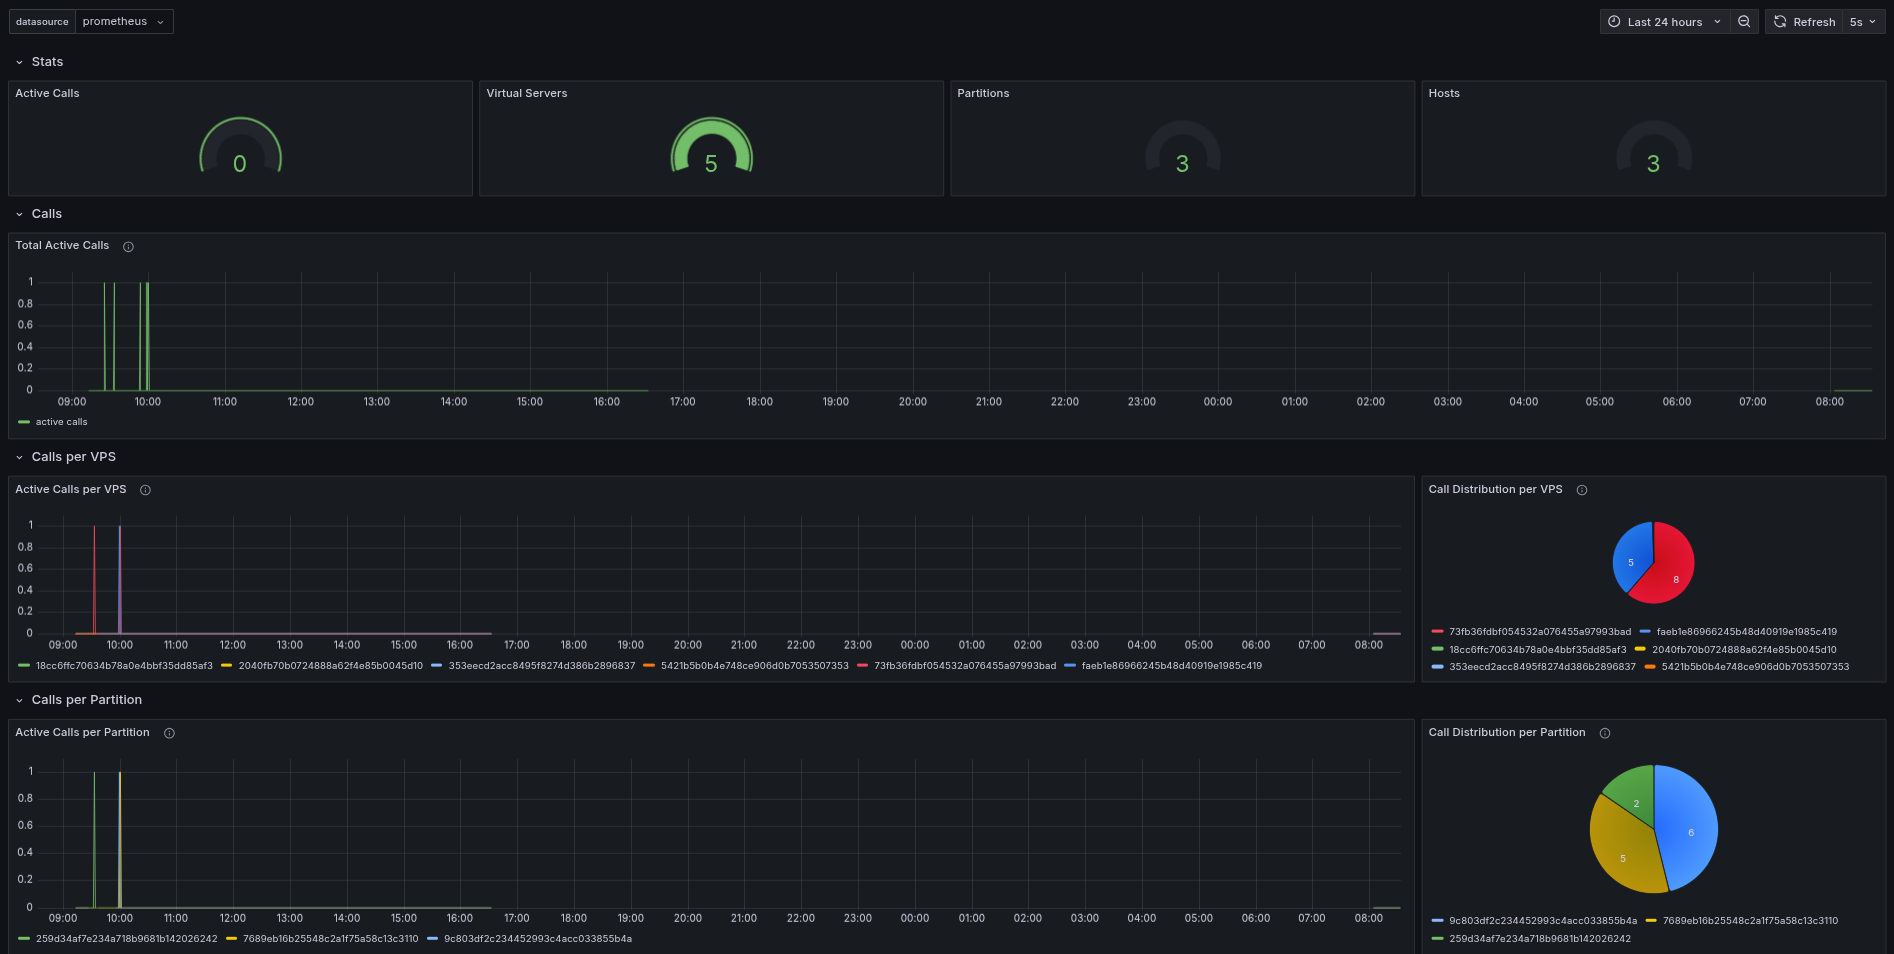
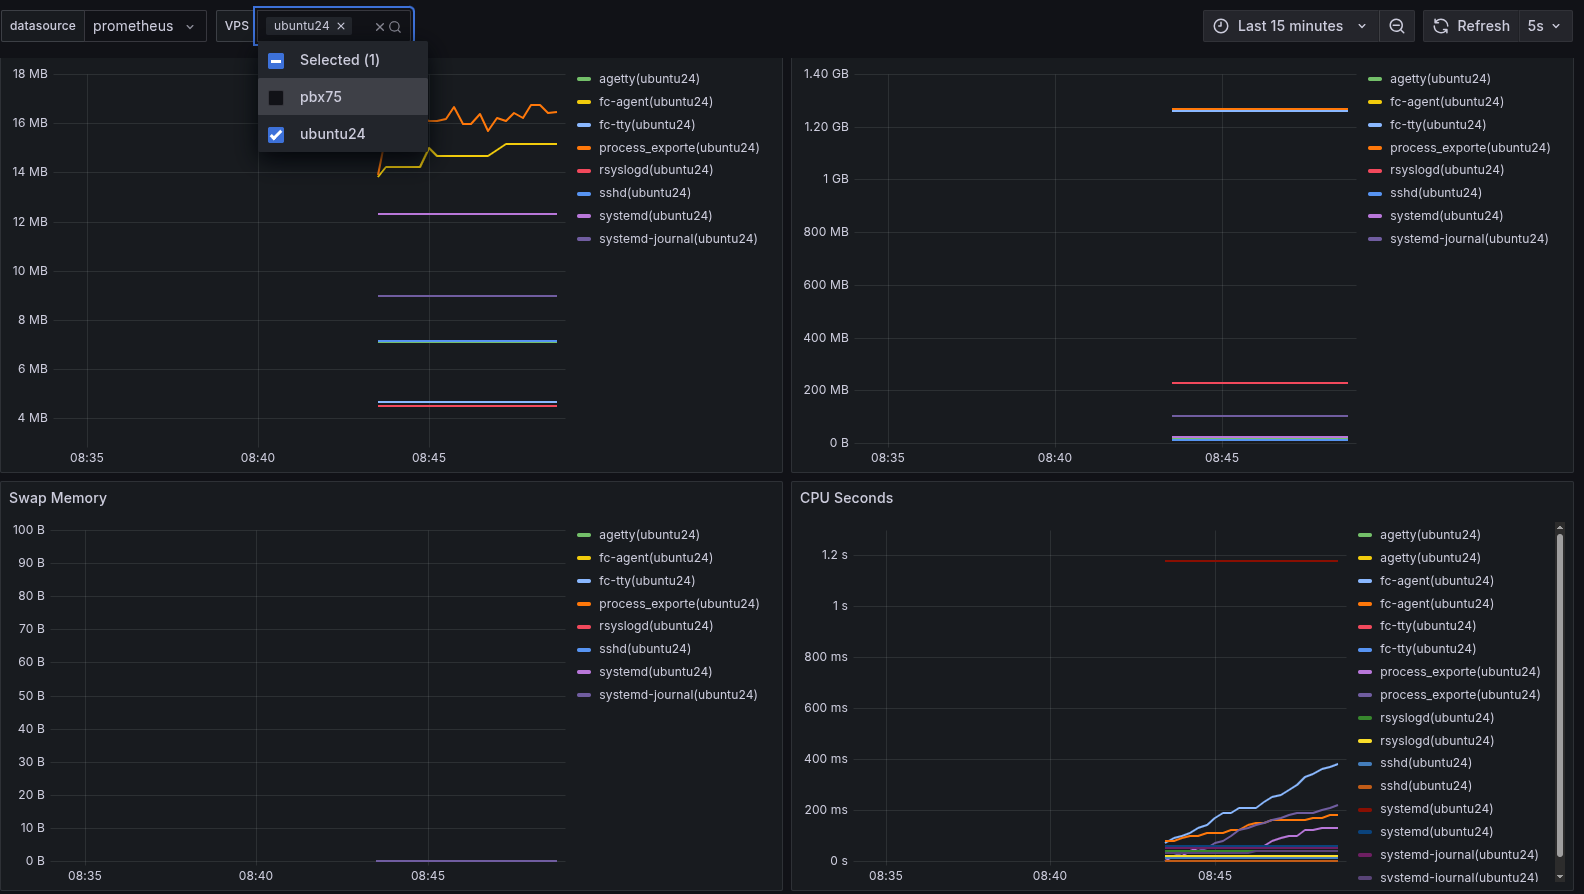
The SERVERware dashboard uses the prometheus data source to create a Grafana dashboard with the gauge, piechart and timeseries panels.
Data source config
Collector type:
Collector plugins:
Collector config:
Revisions
Upload an updated version of an exported dashboard.json file from Grafana
| Revision | Description | Created | |
|---|---|---|---|
| Download |