
Zabbix DB Auditor (MySQL)
Zabbix database analysis. Helps to understand the storage and optimize it
Zabbix DB Auditor
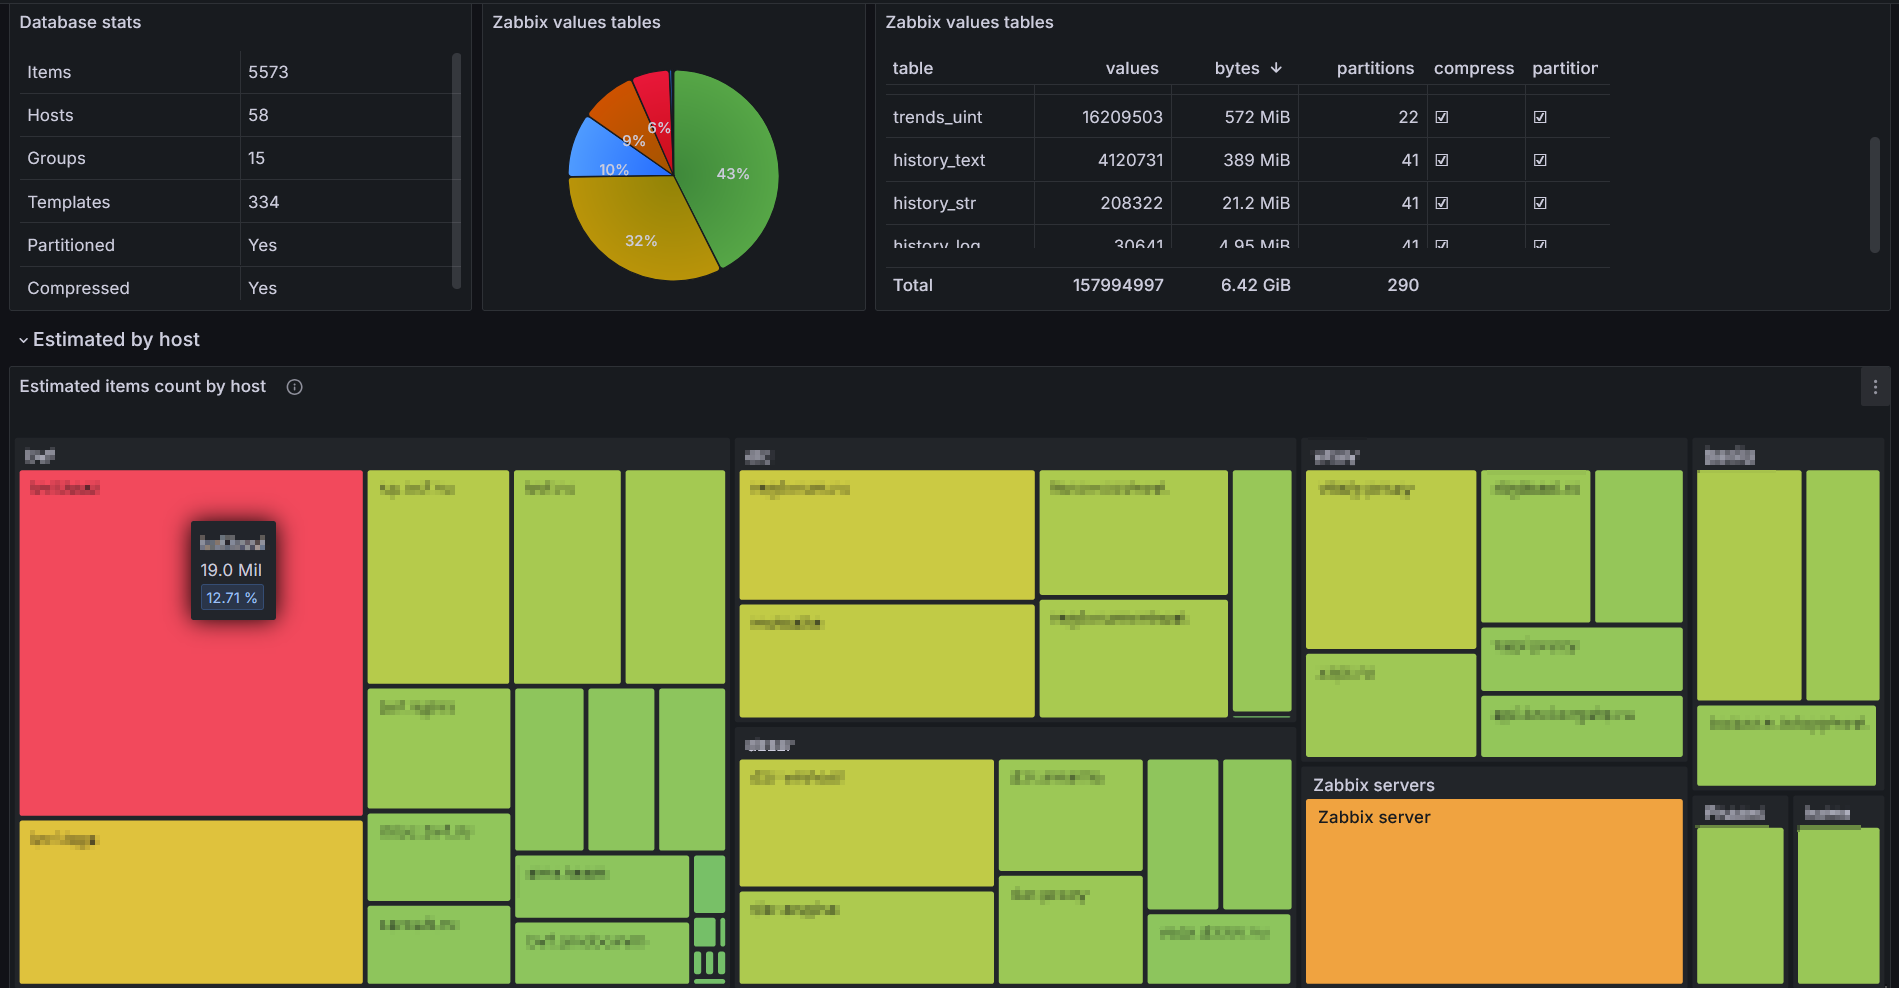
Dashboard designed to analyze and optimize Zabbix database. Allows you to easily evaluate hosts and templates at a glance. The dashboard has its own repository
Features
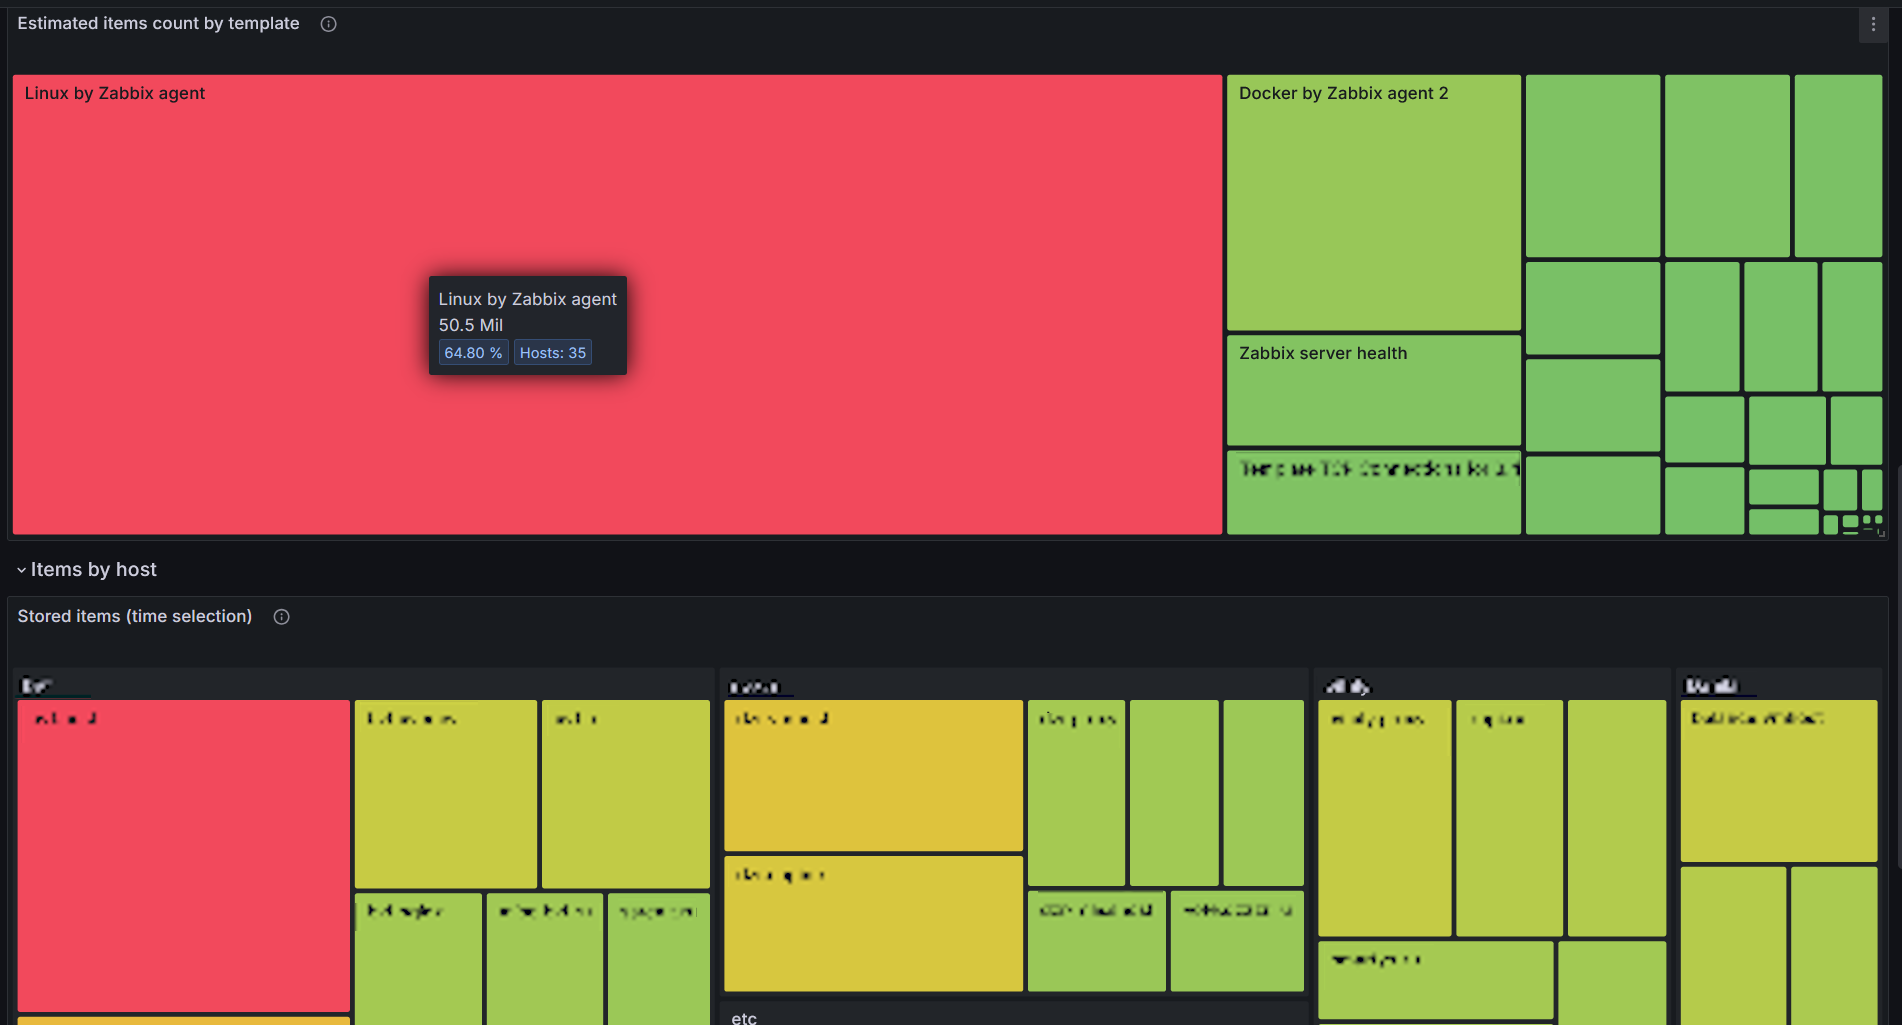
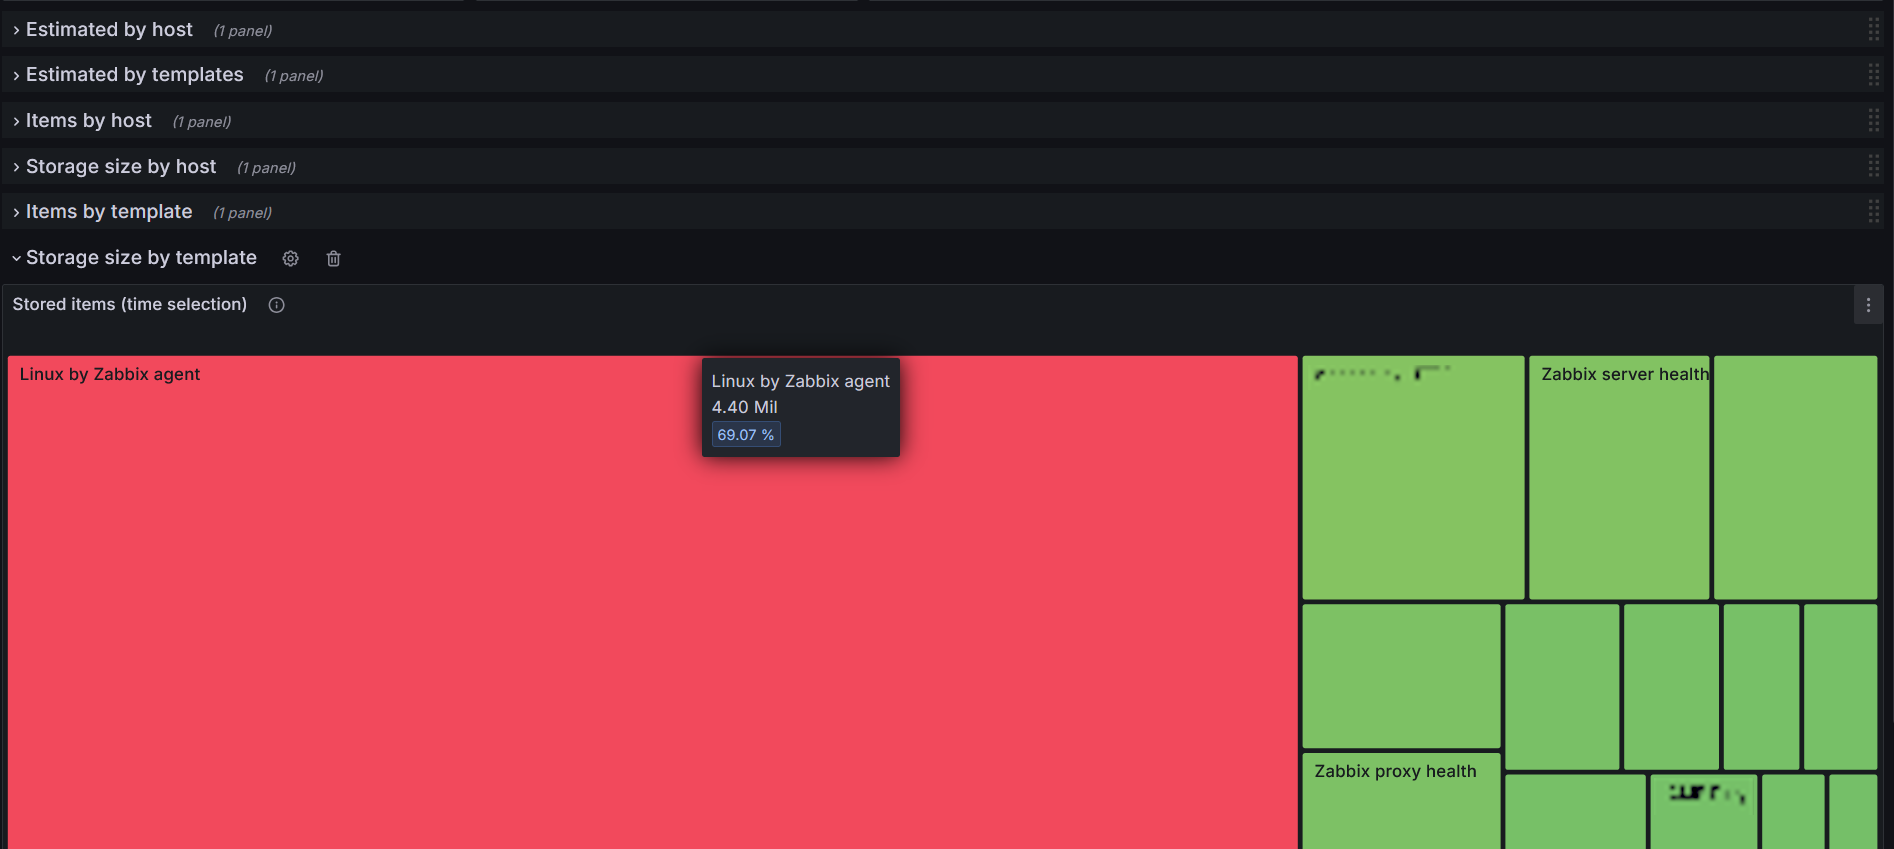
- Easy-to-evaluate dashboard - using modern type of visualization Treemap.
- Quick loading - due to approximate analysis of the data planned for the storage.
- Filters - filters by host groups and hosts.
- Accurate counting - If necessary, it can count the items actually stored in tables.It also counts data from deleted hosts that has not yet been cleared.
Database access
Normal read-only access to the database is fine. However, it is recommended to set up detailed grants. This process is described in the repository.
Caveats
Although the dashboard allows you to estimate which elements consume the most resources, it is almost impossible to calculate with byte accuracy. Service data, compression and fragmentation affect this.
Even though this is a Zabbix dashboard, it does not use access via API and a special plugin. You need direct network access to the Zabbix database.
Working with PostgreSQL is not supported yet
Data source config
Collector config:
Upload an updated version of an exported dashboard.json file from Grafana
| Revision | Description | Created | |
|---|---|---|---|
| Download |
Azure Cosmos DB
With the Grafana plugin for Azure Cosmos DB, you can quickly visualize and query your Azure Cosmos DB data from within Grafana.
Learn more