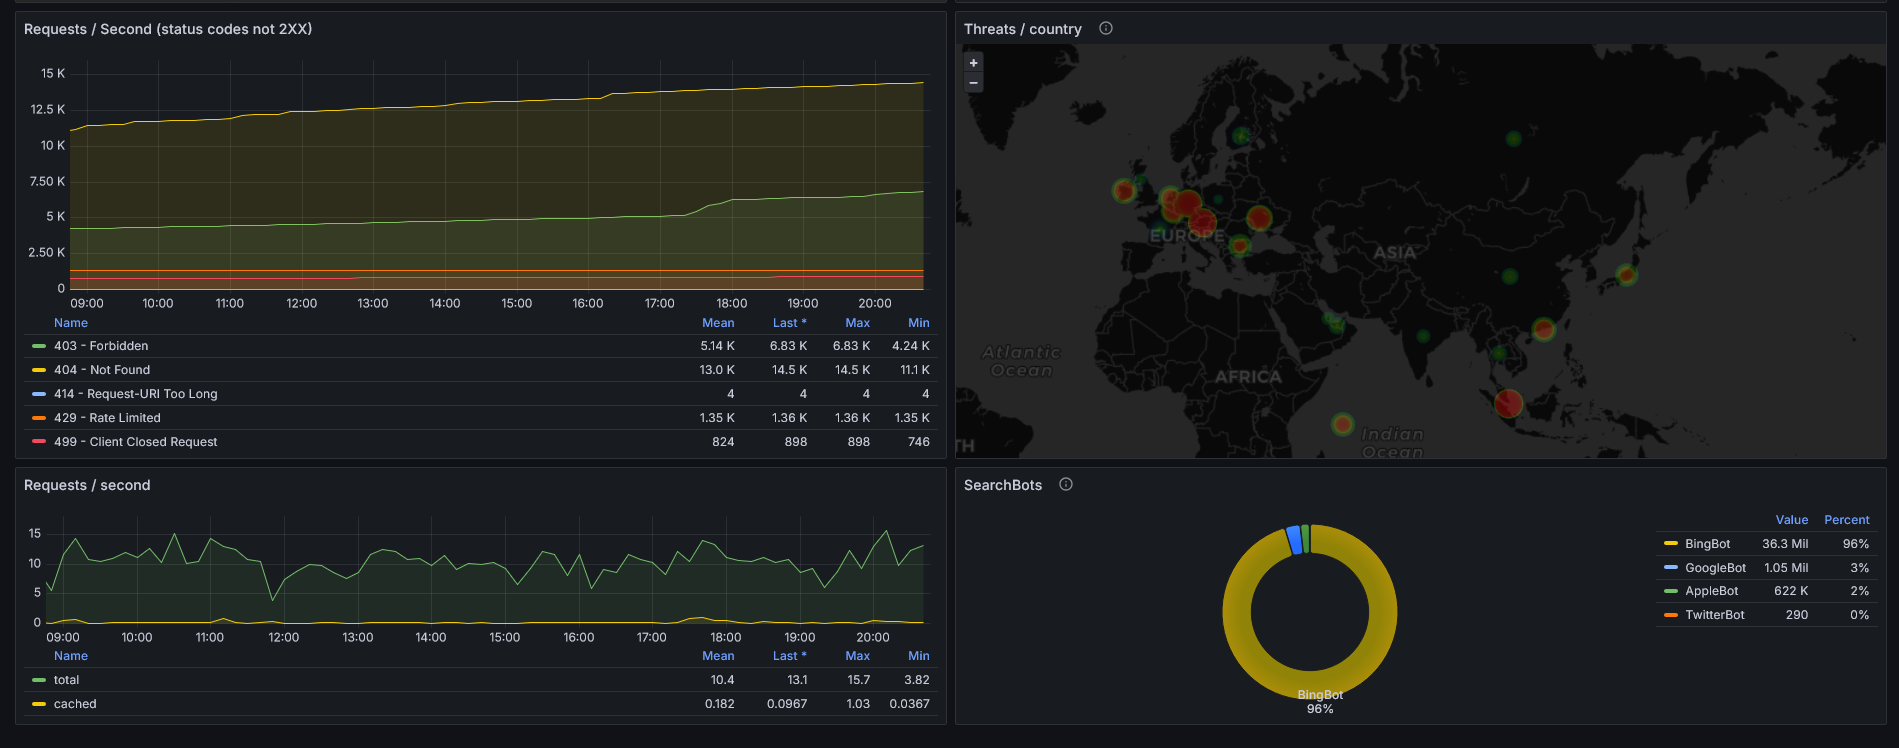
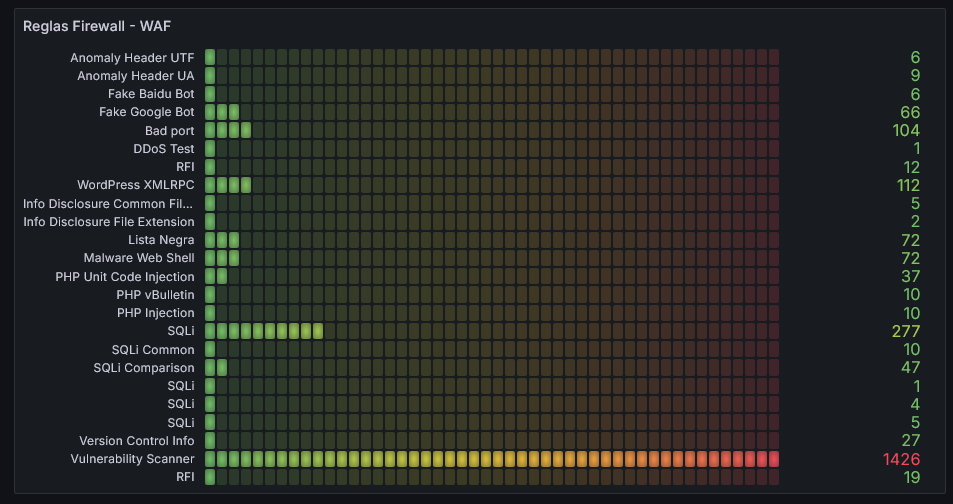
CloudFlare API Analytics and Firewall WAF
Last 12 hours - Updates every 5 minutes Grafana dashboard available at: https://grafana.com/grafana/dashboards/22131-cloudflare-public-analytics-elhacker-net/ Prometheus Source: https://github.com/lablabs/cloudflare-exporter
Requires CloudFLare Exporter and Pro Plan or above in CloudFlare https://github.com/lablabs/cloudflare-exporter
cloudflare_zone_firewall_events_count
Show Firewall Rules WAF Events Map -> Request by country Requests by browser family Requests by Search Bots Requests Status Codes Requests Content Type Map ->Threats by country (heatmap)
Data source config
Collector config:
Upload an updated version of an exported dashboard.json file from Grafana
| Revision | Description | Created | |
|---|---|---|---|
| Download |
Adobe Analytics
With the Grafana plugin for Adobe Analytics, you can quickly visualize and query your Adobe Analytics data from within Grafana.
Learn more


