AWS Native Serverless Overview
This is part of our 🚀AWS Native Cross-account Observability Dashboard! This dashboard offers a high-level overview of key metrics grounded in "Cloud Native Observability principles", along with health indicators for your AWS serverless components, centralized in CloudWatch and CloudTrail. It spans all accounts within your Organizations.
Getting Started
To get started with the AWS Serverless Overview, please follow our project site's instructions on GitHub.
Short descriptions
🫶🏻 This dashboard is designed following the RED Pattern (Rate, Errors, Duration) and the Four Golden Signals (Latency, Traffic, Errors, and Saturation), ensuring comprehensive observability and monitoring of your AWS Serverless architecture.
| ✅ Features | |
|---|---|
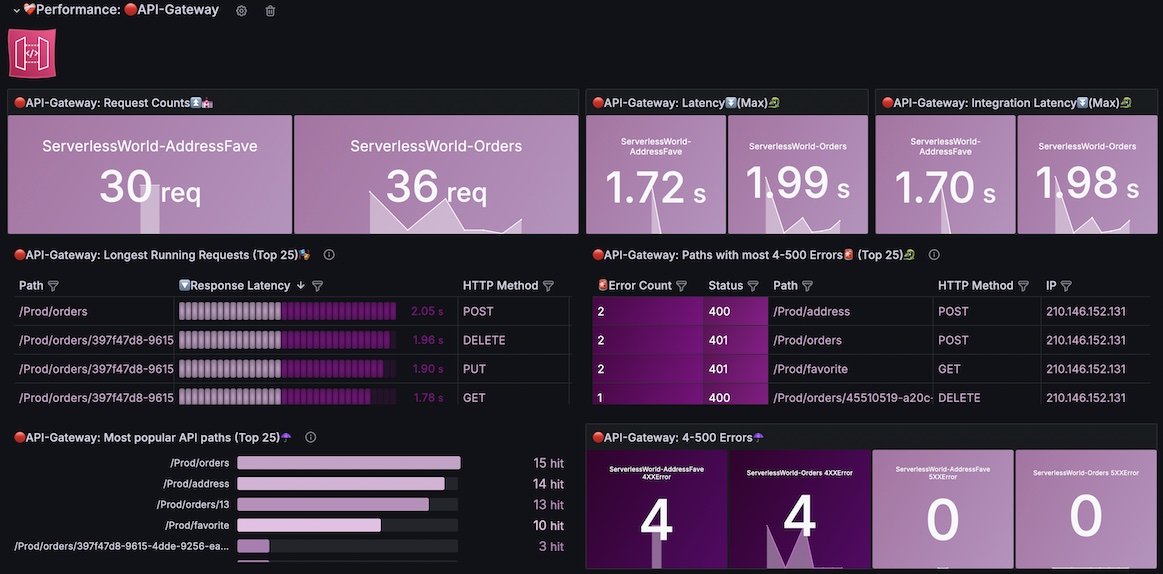
| 🔴API Gateway Performance Monitoring: | - Request Total (RPM): Monitor total API requests with counts for each endpoint to see traffic trends and request patterns. - Response Time (Max): Analyze maximum response times to identify potential bottlenecks in API performance. - Integration Response Time: Track time taken to integrate with back-end services, helping diagnose slow integrations. - 4xx and 5xx Error Analysis: View paths with the highest errors, along with HTTP methods and IP addresses, for effective troubleshooting. - Most Popular API Paths: Highlight frequently accessed API paths to assist in optimizing performance and resource allocation. |
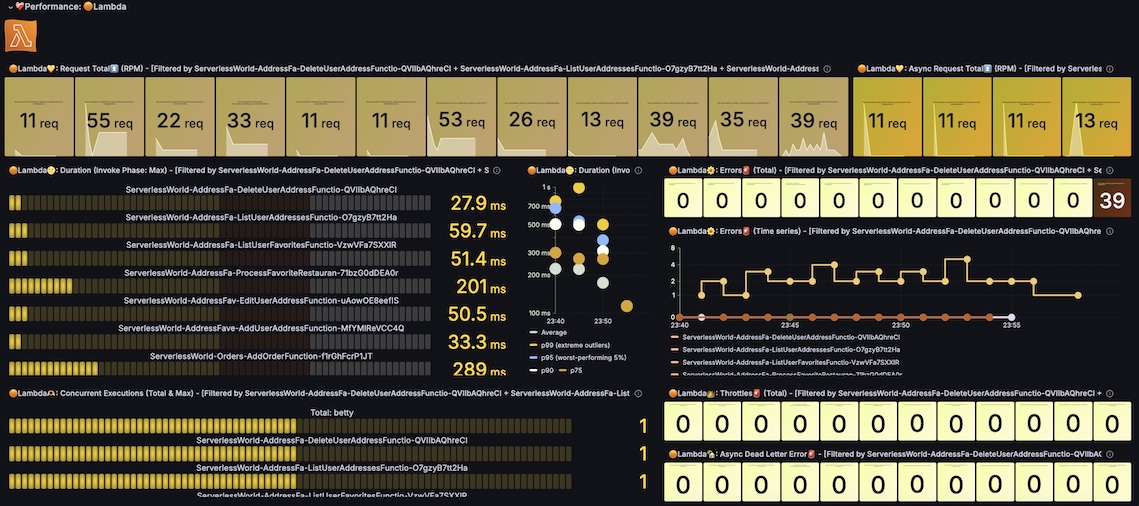
| 🟠AWS Lambda Performance Insights: | - Request Total (RPM): Track Lambda invocations per function(synchronous and asynchronous) to gauge usage and monitor spikes. - Duration Metrics with Percentiles: View average and maximum execution durations, with percentiles (average, p75, p90, p95, p99) for deeper insights into response variability. This help us identify extreme outliers, which's the worst customer experiences. - Concurrency Metrics: Observe concurrent executions to ensure Lambda scaling aligns with demand. - Error and Throttle Tracking: Track errors and throttled invocations, ensuring smoother operations and faster troubleshooting. |
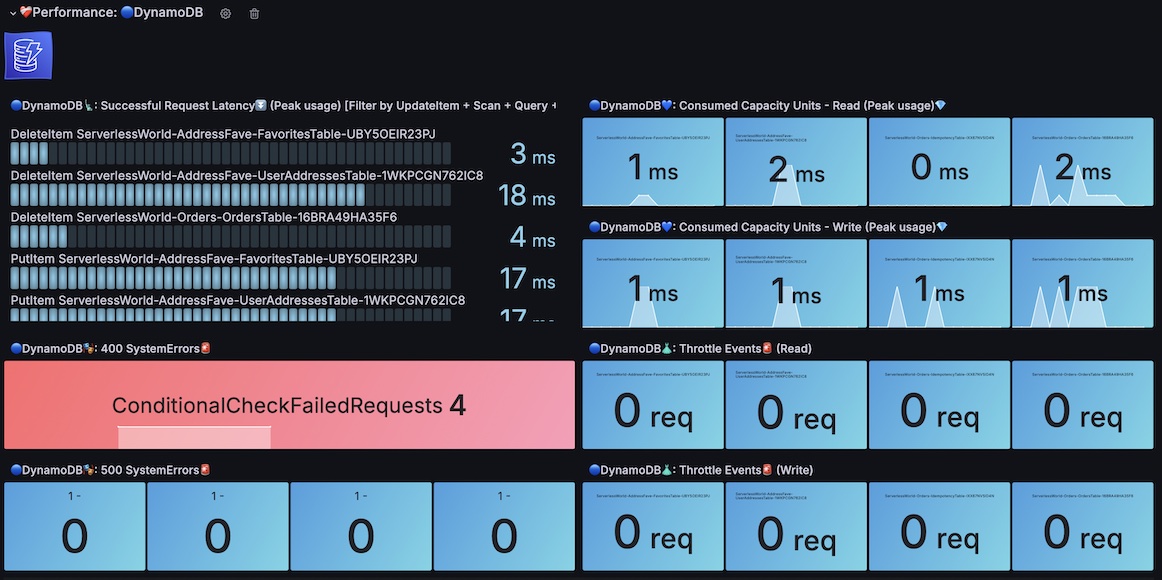
| 🔵DynamoDB Performance Monitoring: | - Request Latency: Track successful request latencies for both read and write operations to optimize DynamoDB performance. - Capacity Utilization: Monitor consumed capacity units for reads and writes to ensure you stay within provisioned limits and avoid throttling. - Error Tracking: Watch for system errors like ConditionalCheckFailedRequests to ensure data consistency and transactional integrity.- Throttle Events: Stay informed about any throttled requests and adjust provisioned capacity to maintain performance. |
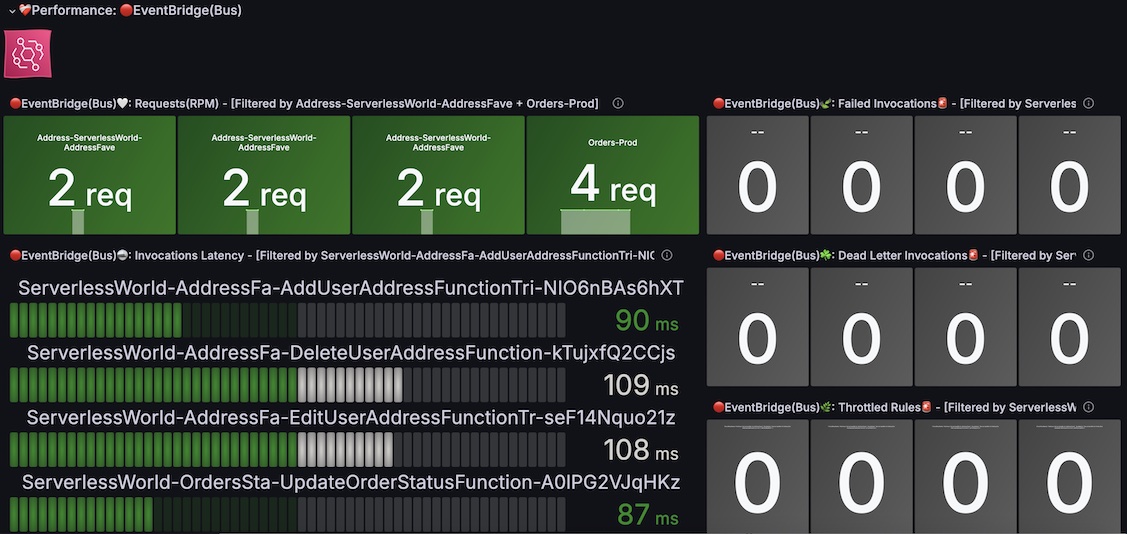
| 🔴EventBridge Performance Monitoring: | - Request Total (RPM): Track total EventBridge requests to monitor event flow across services. - Invocation Latency: View latency metrics for each event-driven invocation, helping optimize event handling speed. - Dead Letter Invocations and Throttled Rules: Monitor failed invocations and throttling to improve event reliability. |
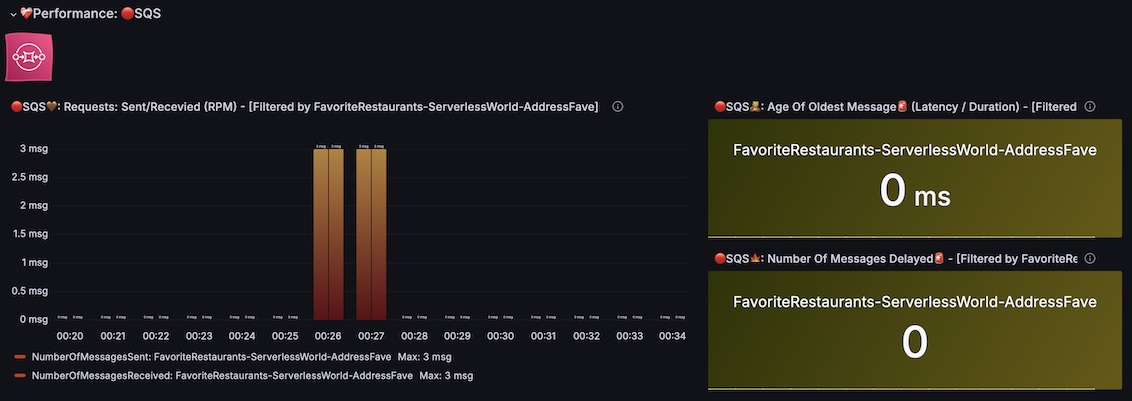
| 🔴SQS Performance Monitoring: | - Requests (Sent/Received RPM): Track messages sent and received by SQS queues to understand queue activity. - Age of Oldest Message: Monitor the oldest message age in the queue to ensure timely processing. - Delayed Messages: View delayed messages to optimize queue configuration and performance. |
| 🔴Cognito Performance Monitoring | - Sign-in and Sign-up Success Tracking: View real-time sign-in and sign-up successes to monitor authentication performance. - Challenge Requests: Track the number of authentication challenges triggered in Cognito, helping monitor suspicious or failed attempts. |
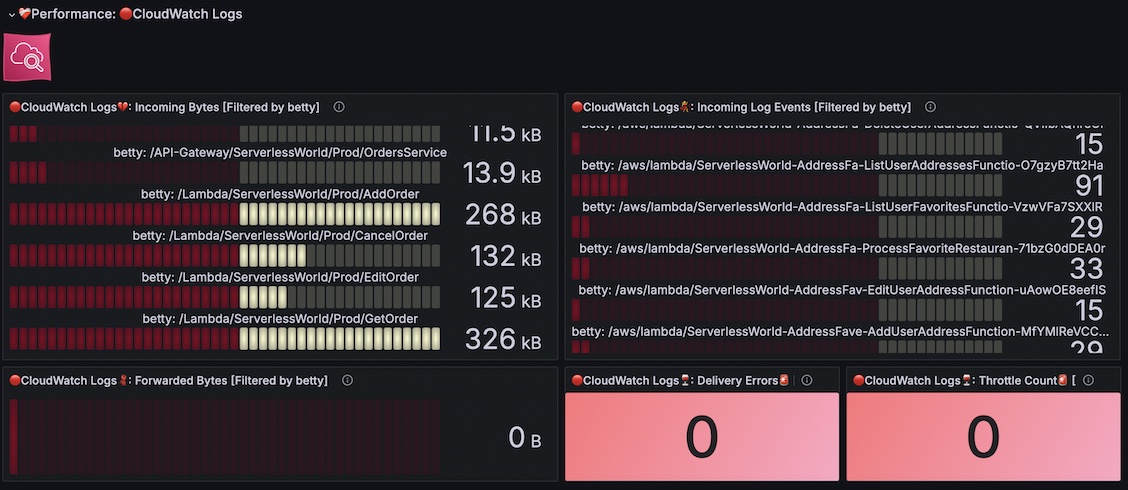
| 🔴CloudWatch Logs Insights: | - Incoming Log Events and Bytes: Visualize the rate of log events and data volume (bytes/sec) from AWS services such as API Gateway, Lambda, and DynamoDB. - Error and Throttle Analysis: Monitor delivery errors, log forwarding, and throttling for effective troubleshooting of log data flow. - Real-Time Monitoring: Ensure smooth, real-time logging for various services to stay ahead of potential performance issues. |
Data source config
Collector config:
Upload an updated version of an exported dashboard.json file from Grafana
| Revision | Description | Created | |
|---|---|---|---|
| Download |
AWS
Easily visualize and alert on more than 60 Amazon Web Services (AWS) resources using the fully managed Grafana Cloud platform.
Learn more
