
Vikunja
This is a Grafana Dashboard to show scraped metrics from Vikunja using Prometheus.
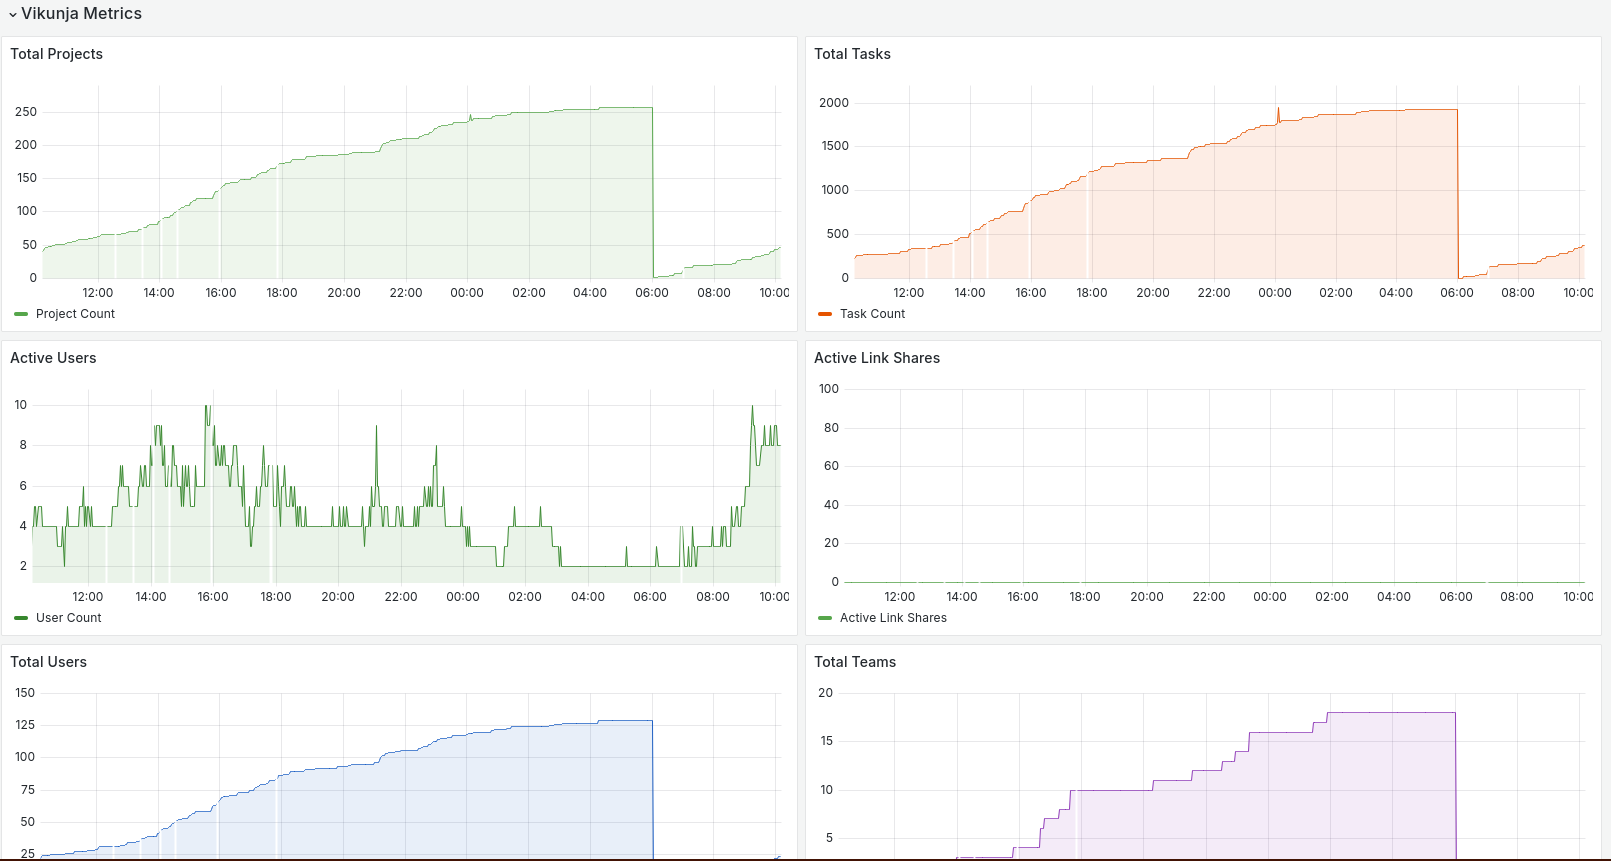
Check out the docs at https://vikunja.io/docs/metrics-setup
Data source config
Collector type:
Collector plugins:
Collector config:
Revisions
Upload an updated version of an exported dashboard.json file from Grafana
| Revision | Description | Created | |
|---|---|---|---|
| Download |