iDRAC - Host Stats (Flux)
SNMP Based Dashboard to Monitor Dell Hosts via iDRAC from orginal dashboard by ilovepancakes95 Adapted to flux by cybaen
iDRAC - Host Stats (Flux)
Dashboard based on dashboard 12106 by ilovepancakes95. Modified to use flux language to work natively with infuxdb v2. Also added variables for easier configuration.
Details
SNMP Based Dashboard to Monitor Dell Hosts via iDRAC
Github Repository : please report issues or provide improvements
How To Use
- Enable SNMPv1 in the iDRACs you wish to monitor.
- Install and setup Telegraf, InfluxDB, and Grafana to work with eachother.
- Use the provided idrac-input.conf file and replace the values for “idracURLx” under “agent” with your own iDRAC IPs or hostnames.
- Restart Telegraf.
- Import the dashboard json file (or use Grafana Dashboard ID) to add the dashboard and panels to Grafana, selecting your own InfluxDB database after clicking “Import”.
- Setup the variables according to your configuration (specifically the "bucket" variable to replace with your bucket name). See below.
Variables description
- idrac_host : list of the idrac hosts referenced in influxDB : MODIFICATION AT YOUR OWN RISKS AND PERIL
- bucket : the name of the bucket to use in influxDB
- hostslist_key : the data key defined in idrac-input.conf (by default "idrac-hosts", should not need any modification)
OS Data
The OS data part will need the installation of the IDRAC Service module on the host os:
Data may take up to 2 minutes to fully populate the first time. Enjoy!
Features
Same as the original:
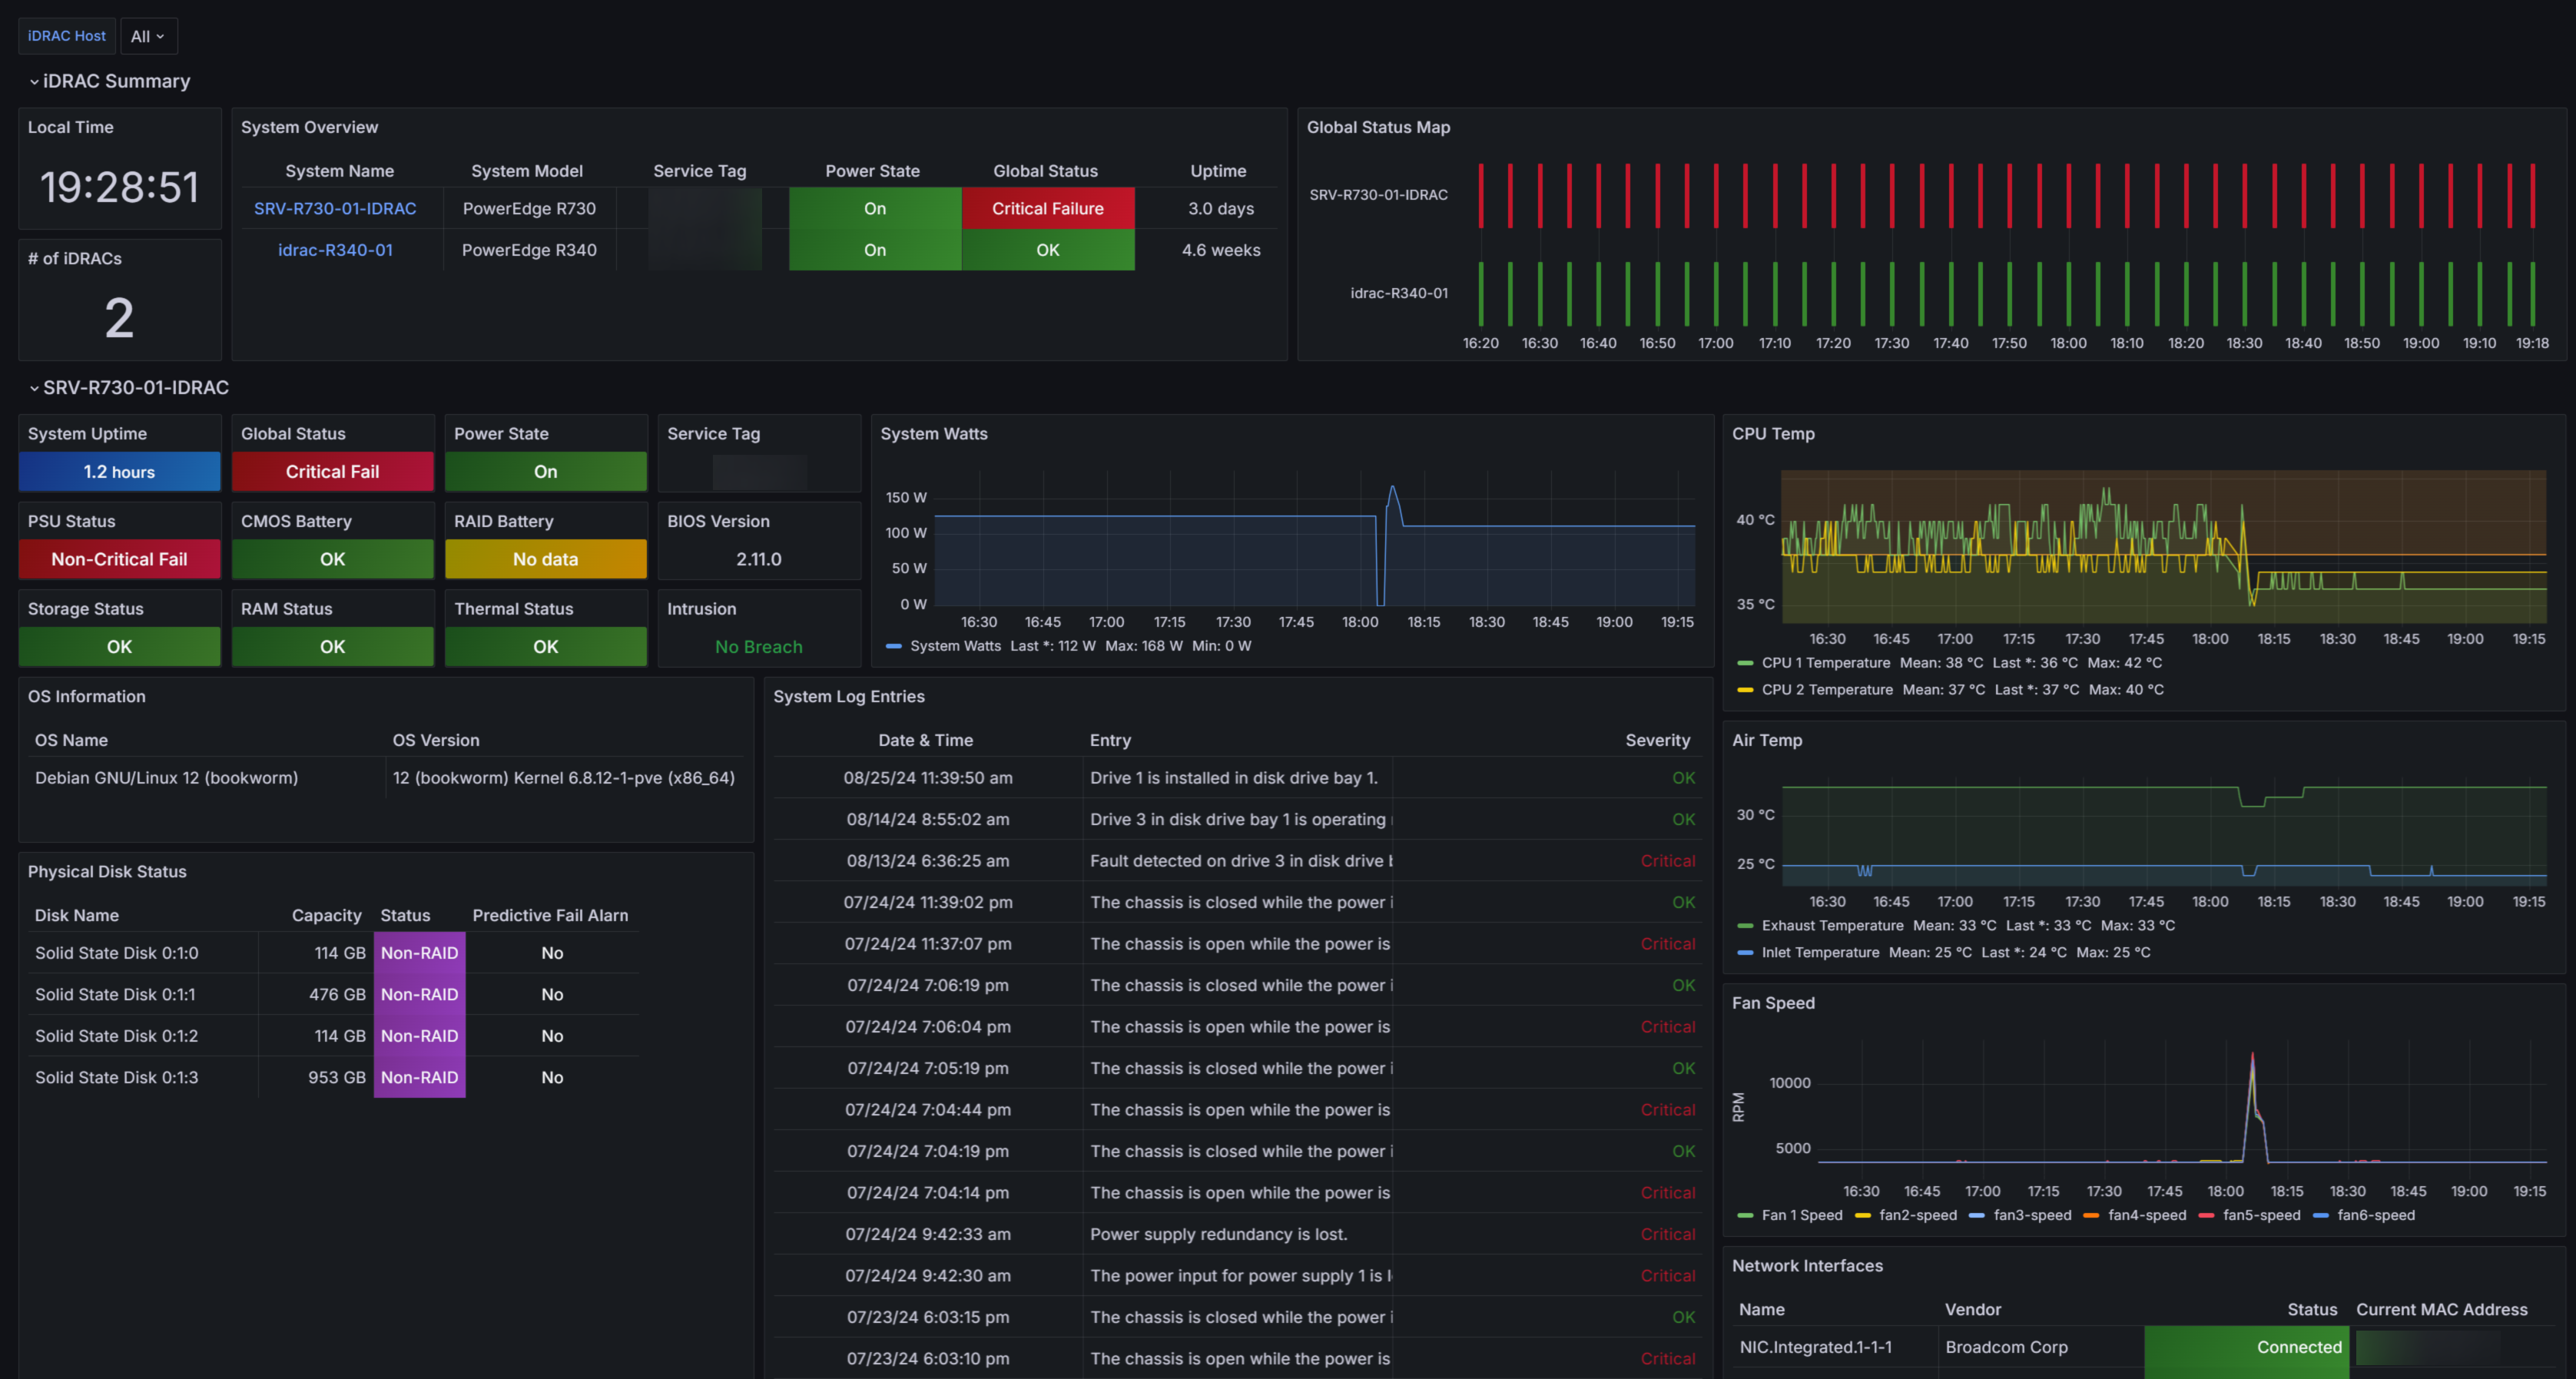
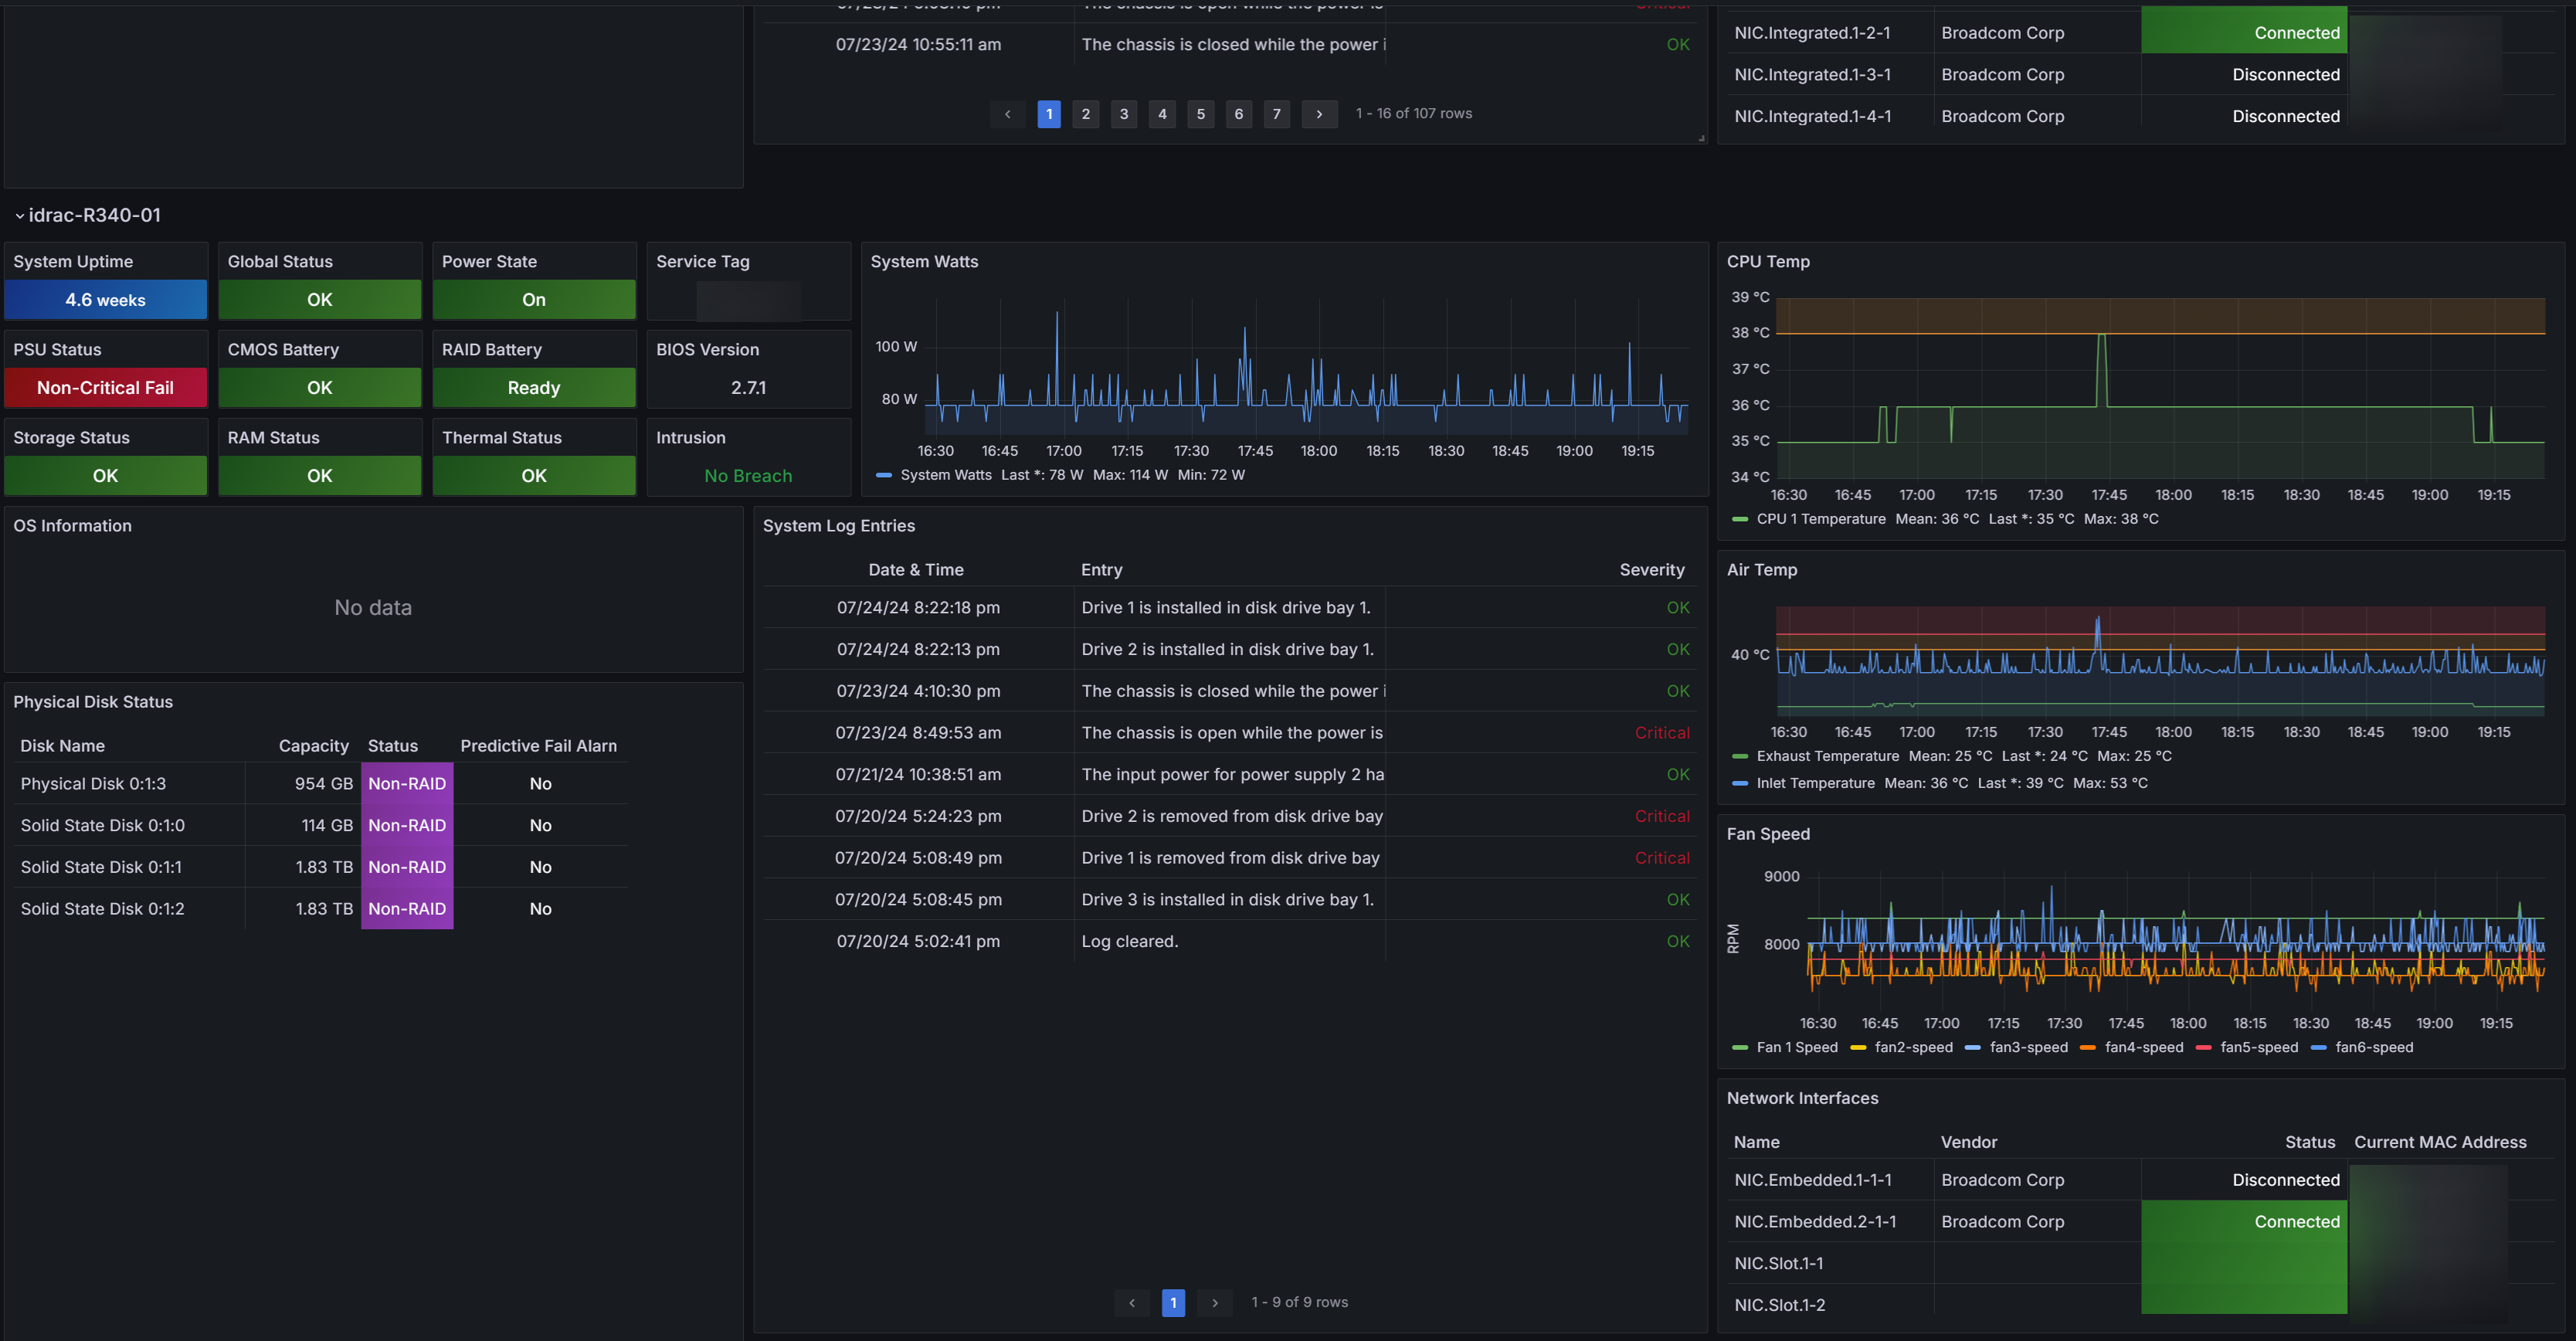
- Uses Grafana variables to dynamically pull in all iDRACs listed in the Telegraf config file, and draw a new “row” section for each iDRAC that gets added.
- Displays summary table and global status “heat” map of all iDRACs being polled.
- Summary table pulls in each iDRAC URL so clicking System Name in the table brings you directly to that iDRAC’s logon page.
- Panels and table cells change color to indicate failures or other status messages.
- Variable selection box allows fine-tuning of which systems are displayed on the dashboard. (Default is “All”).
- Each system’s section on the dashboard is dynamically drawn based on variable selection to show the following data for each host:
- Uptime, Global Status, Power State, PSU Status, CMOS Battery Status, RAID Battery Status, Storage Status, RAM Status, & Thermal Status
- Service Tag, BIOS Version, and Intrusion Sensor Status
- OS Name and OS Version Table
- System Power (in watts) Graph
- CPU Temp Graph
- System Air Temp Graph
- Fan Speed Graph
- Physical Disk Status Table (Disk Name, Capacity, Status, Predictive Fail Alarm)
- System Log Entries Table
- Network Interfaces Table (NIC Name, Vendor, Status, MAC Address)
- Adding more data is as simple as adding the appropriate iDRAC OID to the Telegraf config file, and adding a panel to display the new data on the dashboard (See below).
Build Environment
- Grafana for visualization of data
- Telegraf for data collection with SNMP Input Plugin
- InfluxDB V2 for time series and table data storage
- iDRAC with SNMP Enabled (v1)
- Tested with iDRAC 7 and iDRAC 8 on Dell Poweredge r720xd and r730xd servers by ilovepancakes95.
- Tested with iDRAC 8 and iDRAC 9 on Dell Poweredge r730 and r340 servers by me.
Adding Data and panels
To pull and use additional data, you can use the following resources:
- Dell MIB Files : The MIBs files listing the OIDs delivered by the iDRAC. The idrac-input.conf is based on it.
- MIB Browser : Browser for mibs file
- Dell EMC OpenManage SNMP Reference Guide : Official SNMP reference guide for iDRAC
Data source config
Collector config:
Upload an updated version of an exported dashboard.json file from Grafana
| Revision | Description | Created | |
|---|---|---|---|
| Download |


