
Spot Ocean Scaling and Cost Optimization Dashboard
This dashboard provides real-time insights into the scaling, cost, usage, and right-sizing activities managed by Spot Ocean within your Kubernetes cluster. It showcases metrics related to node provisioning, optimization, cost efficiency, and recovery operations. The visualizations help you understand how Spot Ocean dynamically manages Kubernetes cluster resources to ensure optimal performance, cost savings, and high availability. Key actions such as scale-ups, scale-downs, node replacements, and manual interventions are highlighted to give a comprehensive view of your cluster's operational status and health. It includes comprehensive data on compute, storage, and networking expenses, helping you monitor and optimize cloud spending. Visualizations highlight the cost distribution across different resource types and track usage patterns over time. This information empowers customers to make informed decisions about resource allocation, identify cost-saving opportunities, and ensure efficient utilization of cloud infrastructure. Additionally, the dashboard enables the evaluation of Ocean's right-sizing capability, demonstrating how efficient resource adjustments contribute to cost reduction while maintaining optimal cluster performance.
Spot Ocean Scaling and Cost Optimization Dashboard
Introduction
Spot Ocean (https://spot.io/product/ocean/) manages the scaling of the Kubernetes data plane, and the data generated in the process can be valuable for monitoring your containerized environment. Using well-defined Prometheus metrics for monitoring Ocean helps you understand cluster scaling and debug any issues that may arise. In addition, you can build alerts based on the metrics to address issues in real-time and track important trends on a dashboard of different Ocean metrics.
Ocean maintains an official set of metrics, natively scrapable by Prometheus. This set of metrics helps build a 360-degree view of Ocean's actions while providing application-driven infrastructure.
Variables
- Datasource: Select the cluster datasource in a Grafana installation with multiple datasources available.
- Ocean Cluster ID: Filter data only for the selected ID, suitable for datasources with data from several Ocean clusters.
- Aggregation Interval: Used to set a relative time in panels with aggregated data. The relative time will be shown on the panel title.
Metrics
By monitoring the following key metrics, you can understand how Ocean scales.
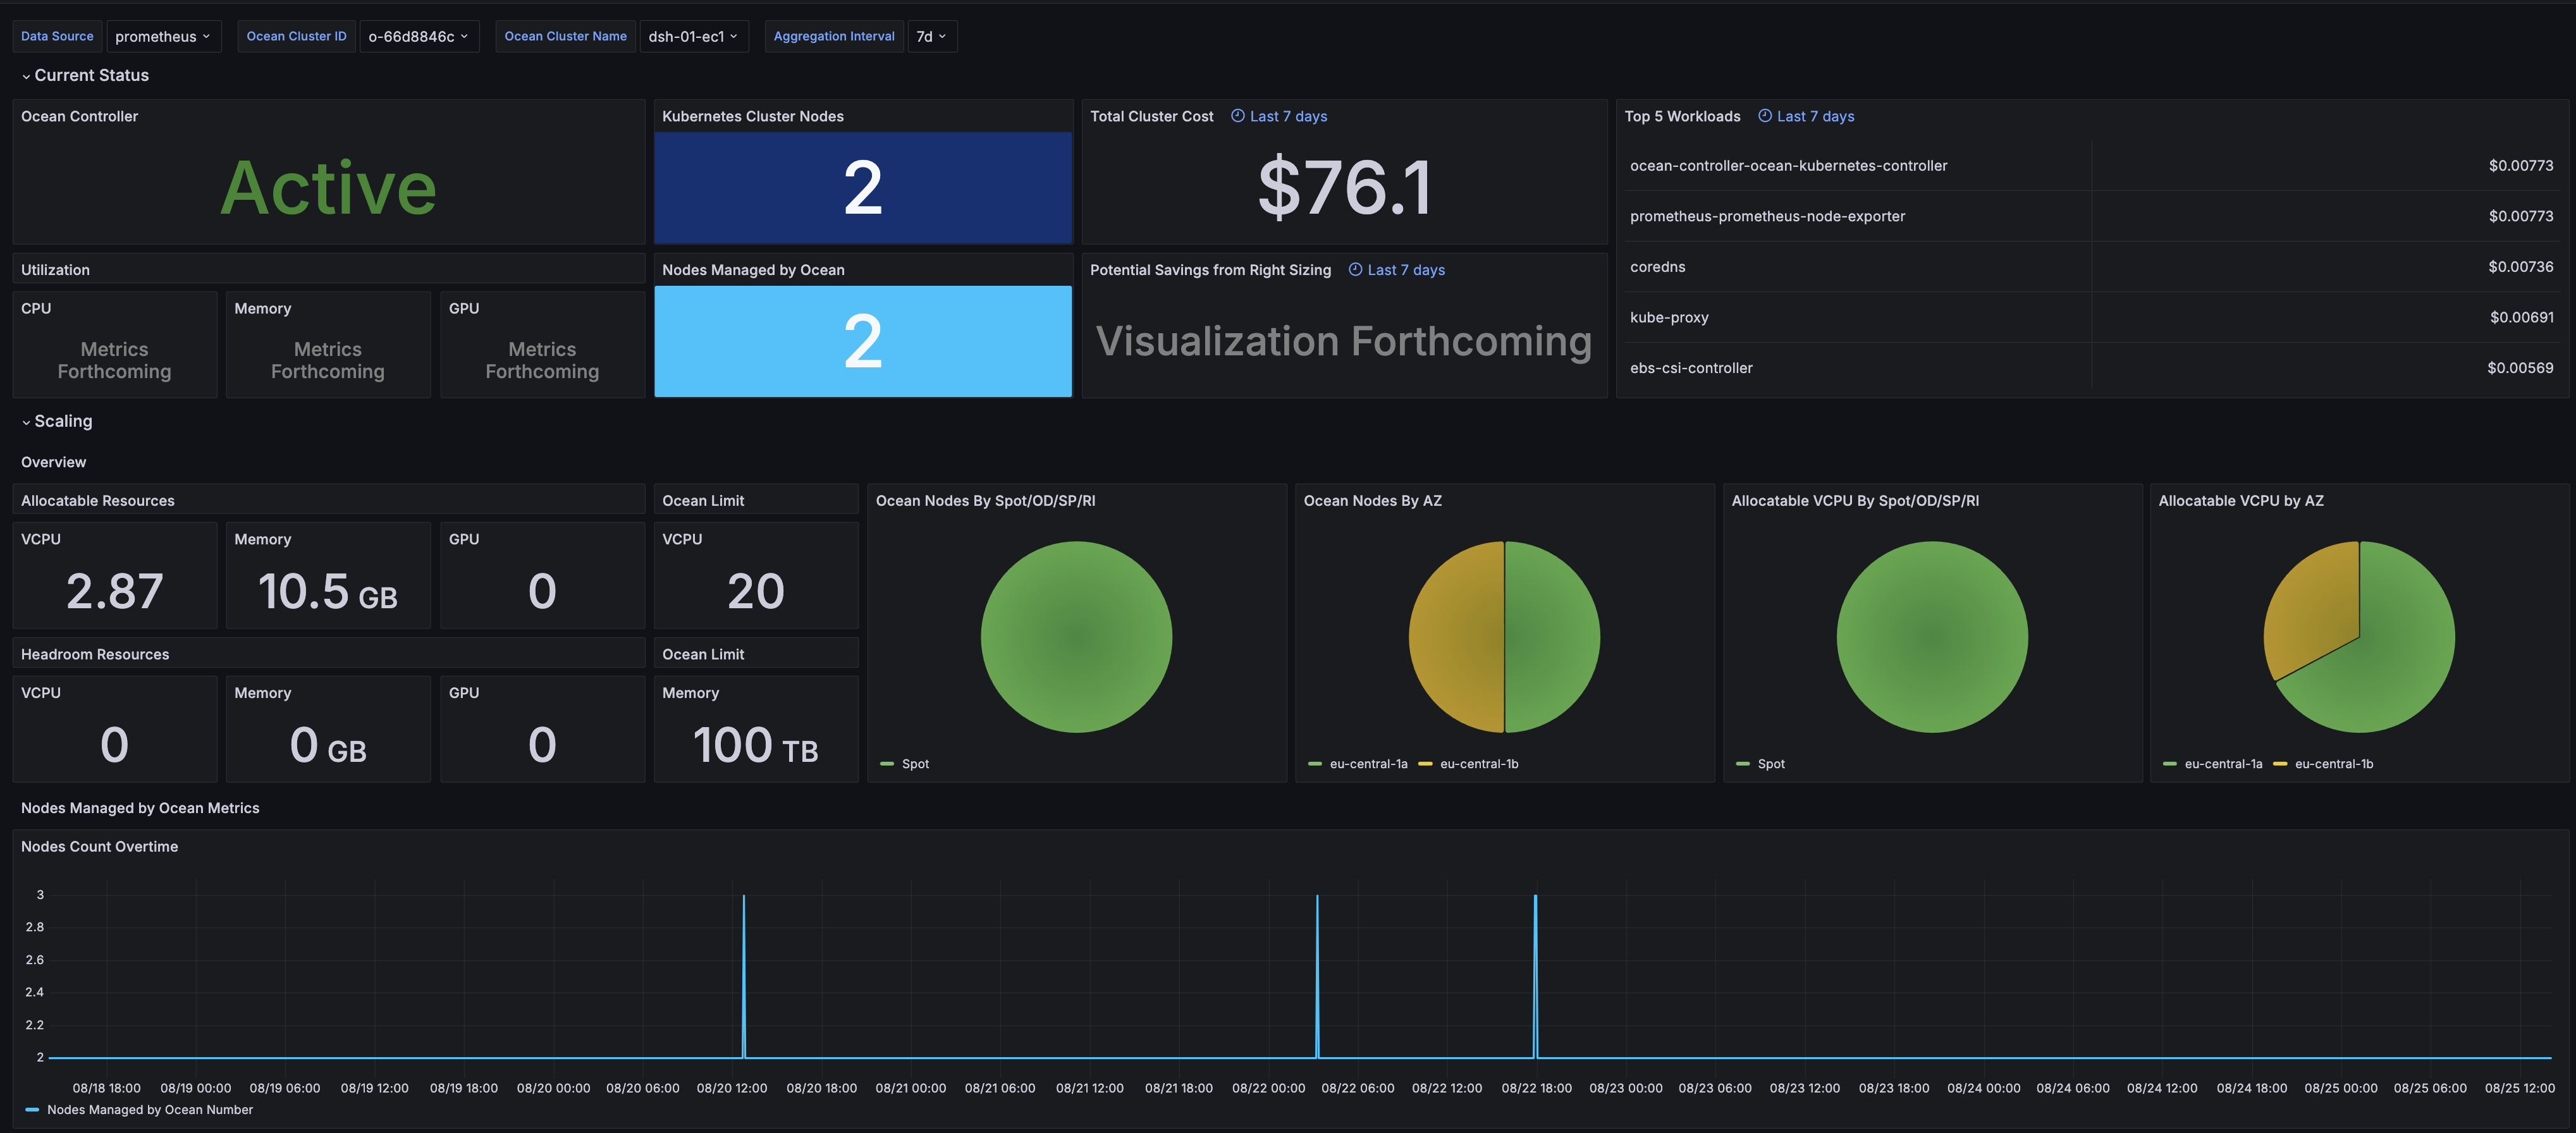
Overview
- Ocean controller status. Source: Ocean.
- Kubernetes cluster Nodes. Source: Kubernetes API server.
- Nodes managed by Ocean. Source: Ocean.
- Cluster resources utilization. Source: Ocean.
- Cluster cost during the selected aggregation interval. Source: Ocean.
- Top 5 workloads with maximum cost during the selected aggregation interval. Source: Ocean.
- Cluster cost's potential savings suggested by the right-sizing feature. Source: Ocean.
Scaling
Overview
- Cluster nodes' allocatable resources (CPU, memory, GPU). Source: Ocean.
- Ocean cluster headroom allocatable resources (CPU, memory, GPU). Source: Ocean.
- Ocean cluster resources limit (CPU, memory). Source: Ocean.
- Ocean nodes breakdown by instance lifecycle and availability zone. Source: Ocean.
- Cluster nodes' allocatable resources breakdown by instance lifecycle and availability zone. Source: Ocean.
Nodes Managed by Ocean Metrics
- Ocean nodes count over time. Source: Ocean.
- Ocean nodes count by instance lifecycle and availability zone over time. Source: Ocean.
- Cluster nodes' allocatable resources count by instance lifecycle and availability zone over time. Source: Ocean.
Resources Utilization Metrics
- Cluster resources (CPU, memory, GPU) utilization over time. Source: Ocean.
Pods Metrics
- Average time for Pod to become ready over time. Source: Kubernetes API server.
- Pods in Running state. Source: Kubernetes API server.
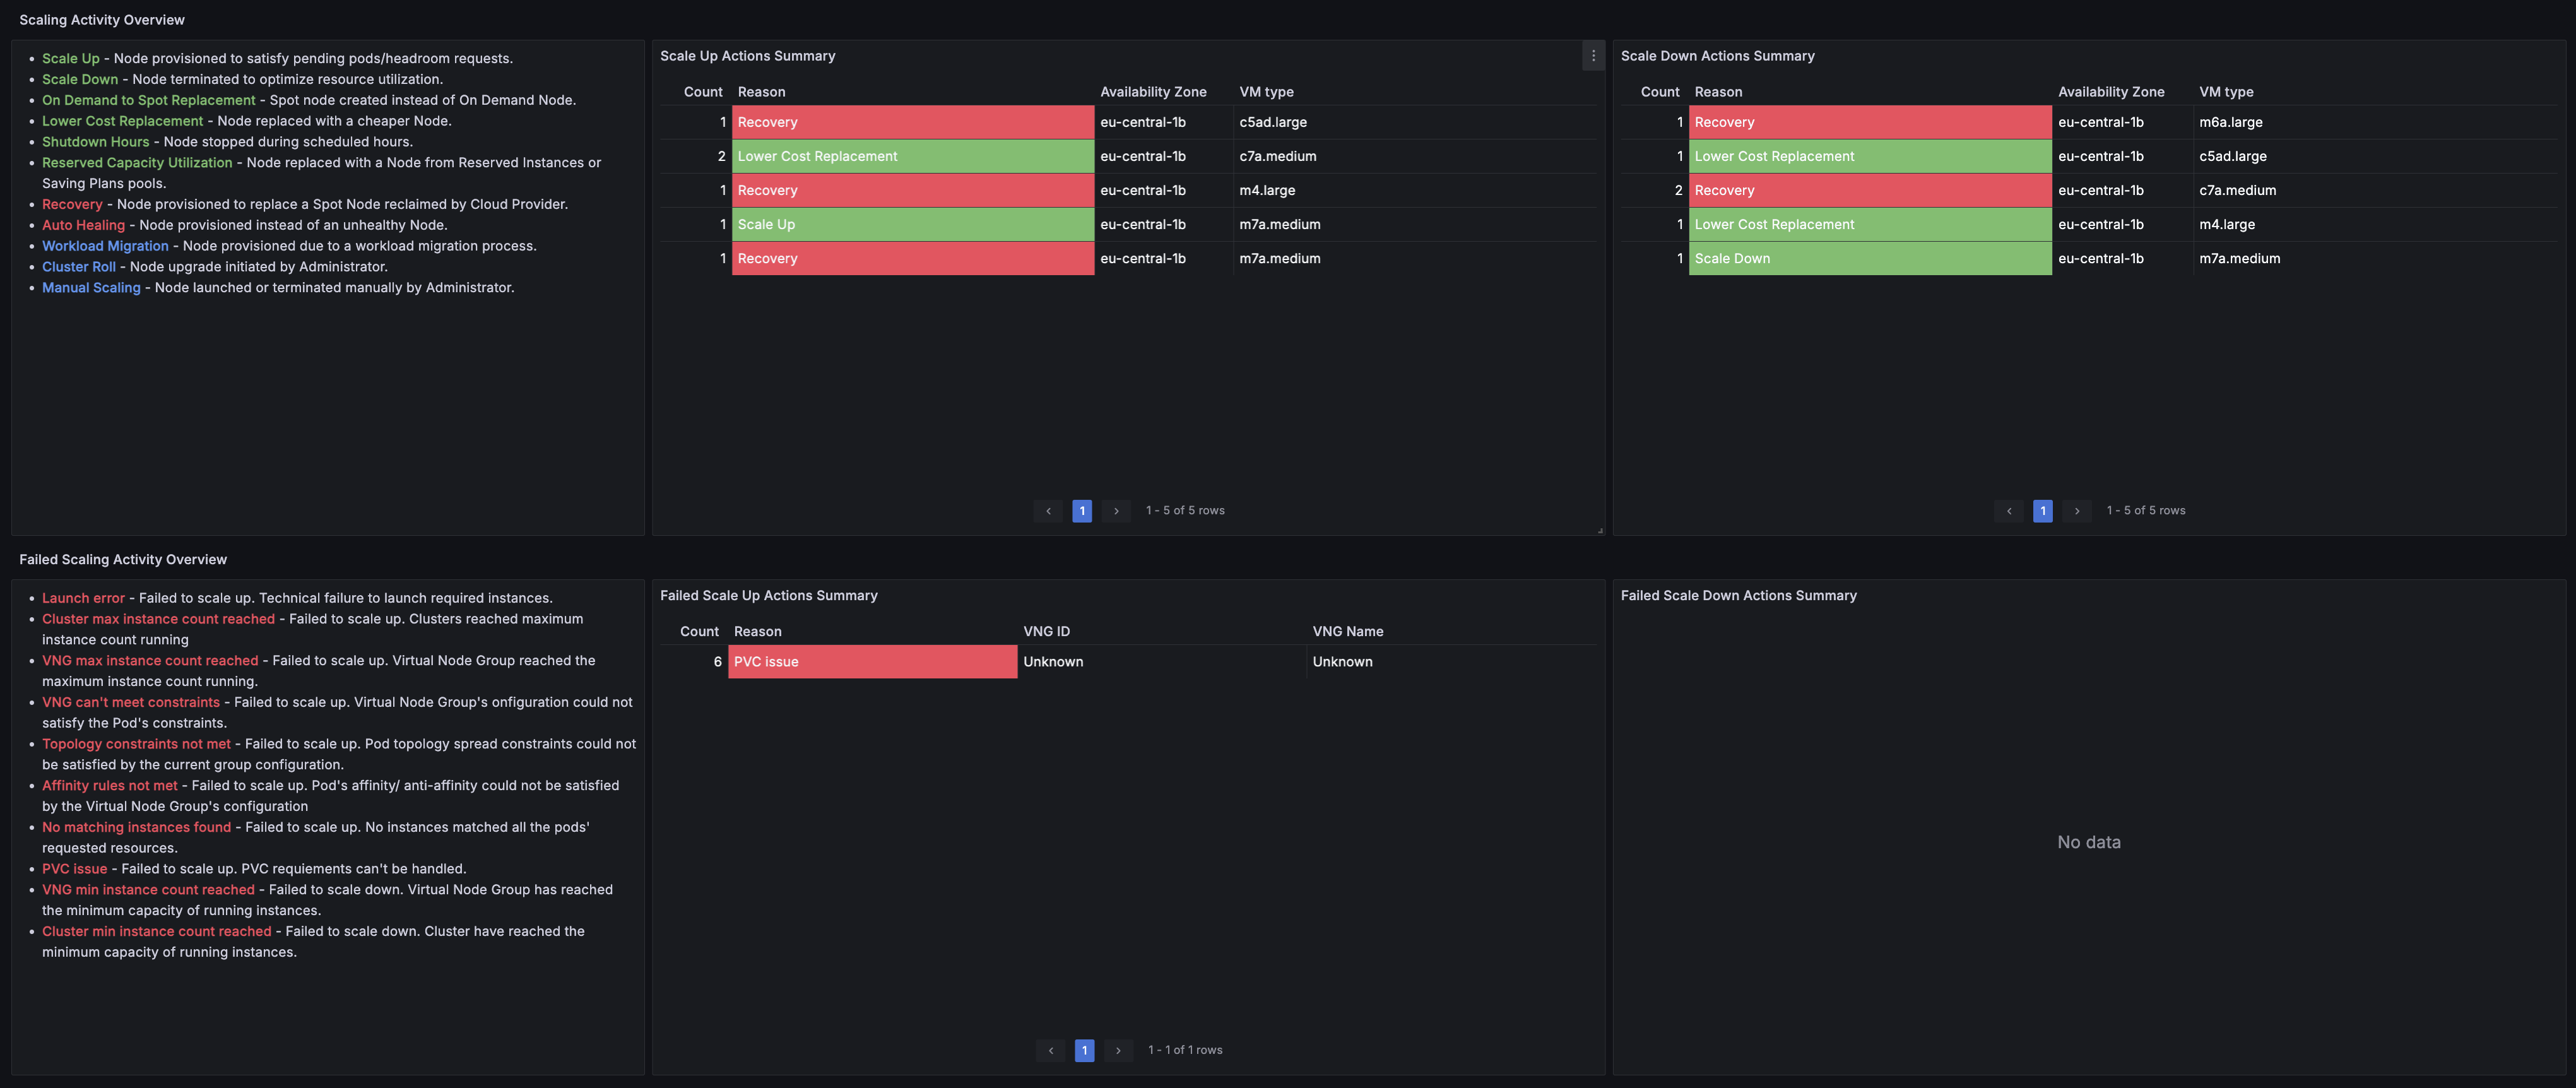
Scaling Activity Overview
- Scaling up and down events summaries. Source: Ocean.
- Nodes Added Over Time. Source: Ocean.
- Nodes Removed Over Time. Source: Ocean.
- Failed scaling up and down events summaries. Source: Ocean.
- Failed Scales Up Overtime. Source: Ocean.
Ocean Controllers Metrics
- Ocean Kubernetes controller status over time. Source: Ocean.
- Ocean Kubernetes controllers pods over time. Source: Kubernetes API server.
- Ocean Kubernetes controllers memory consumption over time. Source: Kubernetes API server.
- Ocean metrics controllers memory consumption over time. Source: Kubernetes API server.
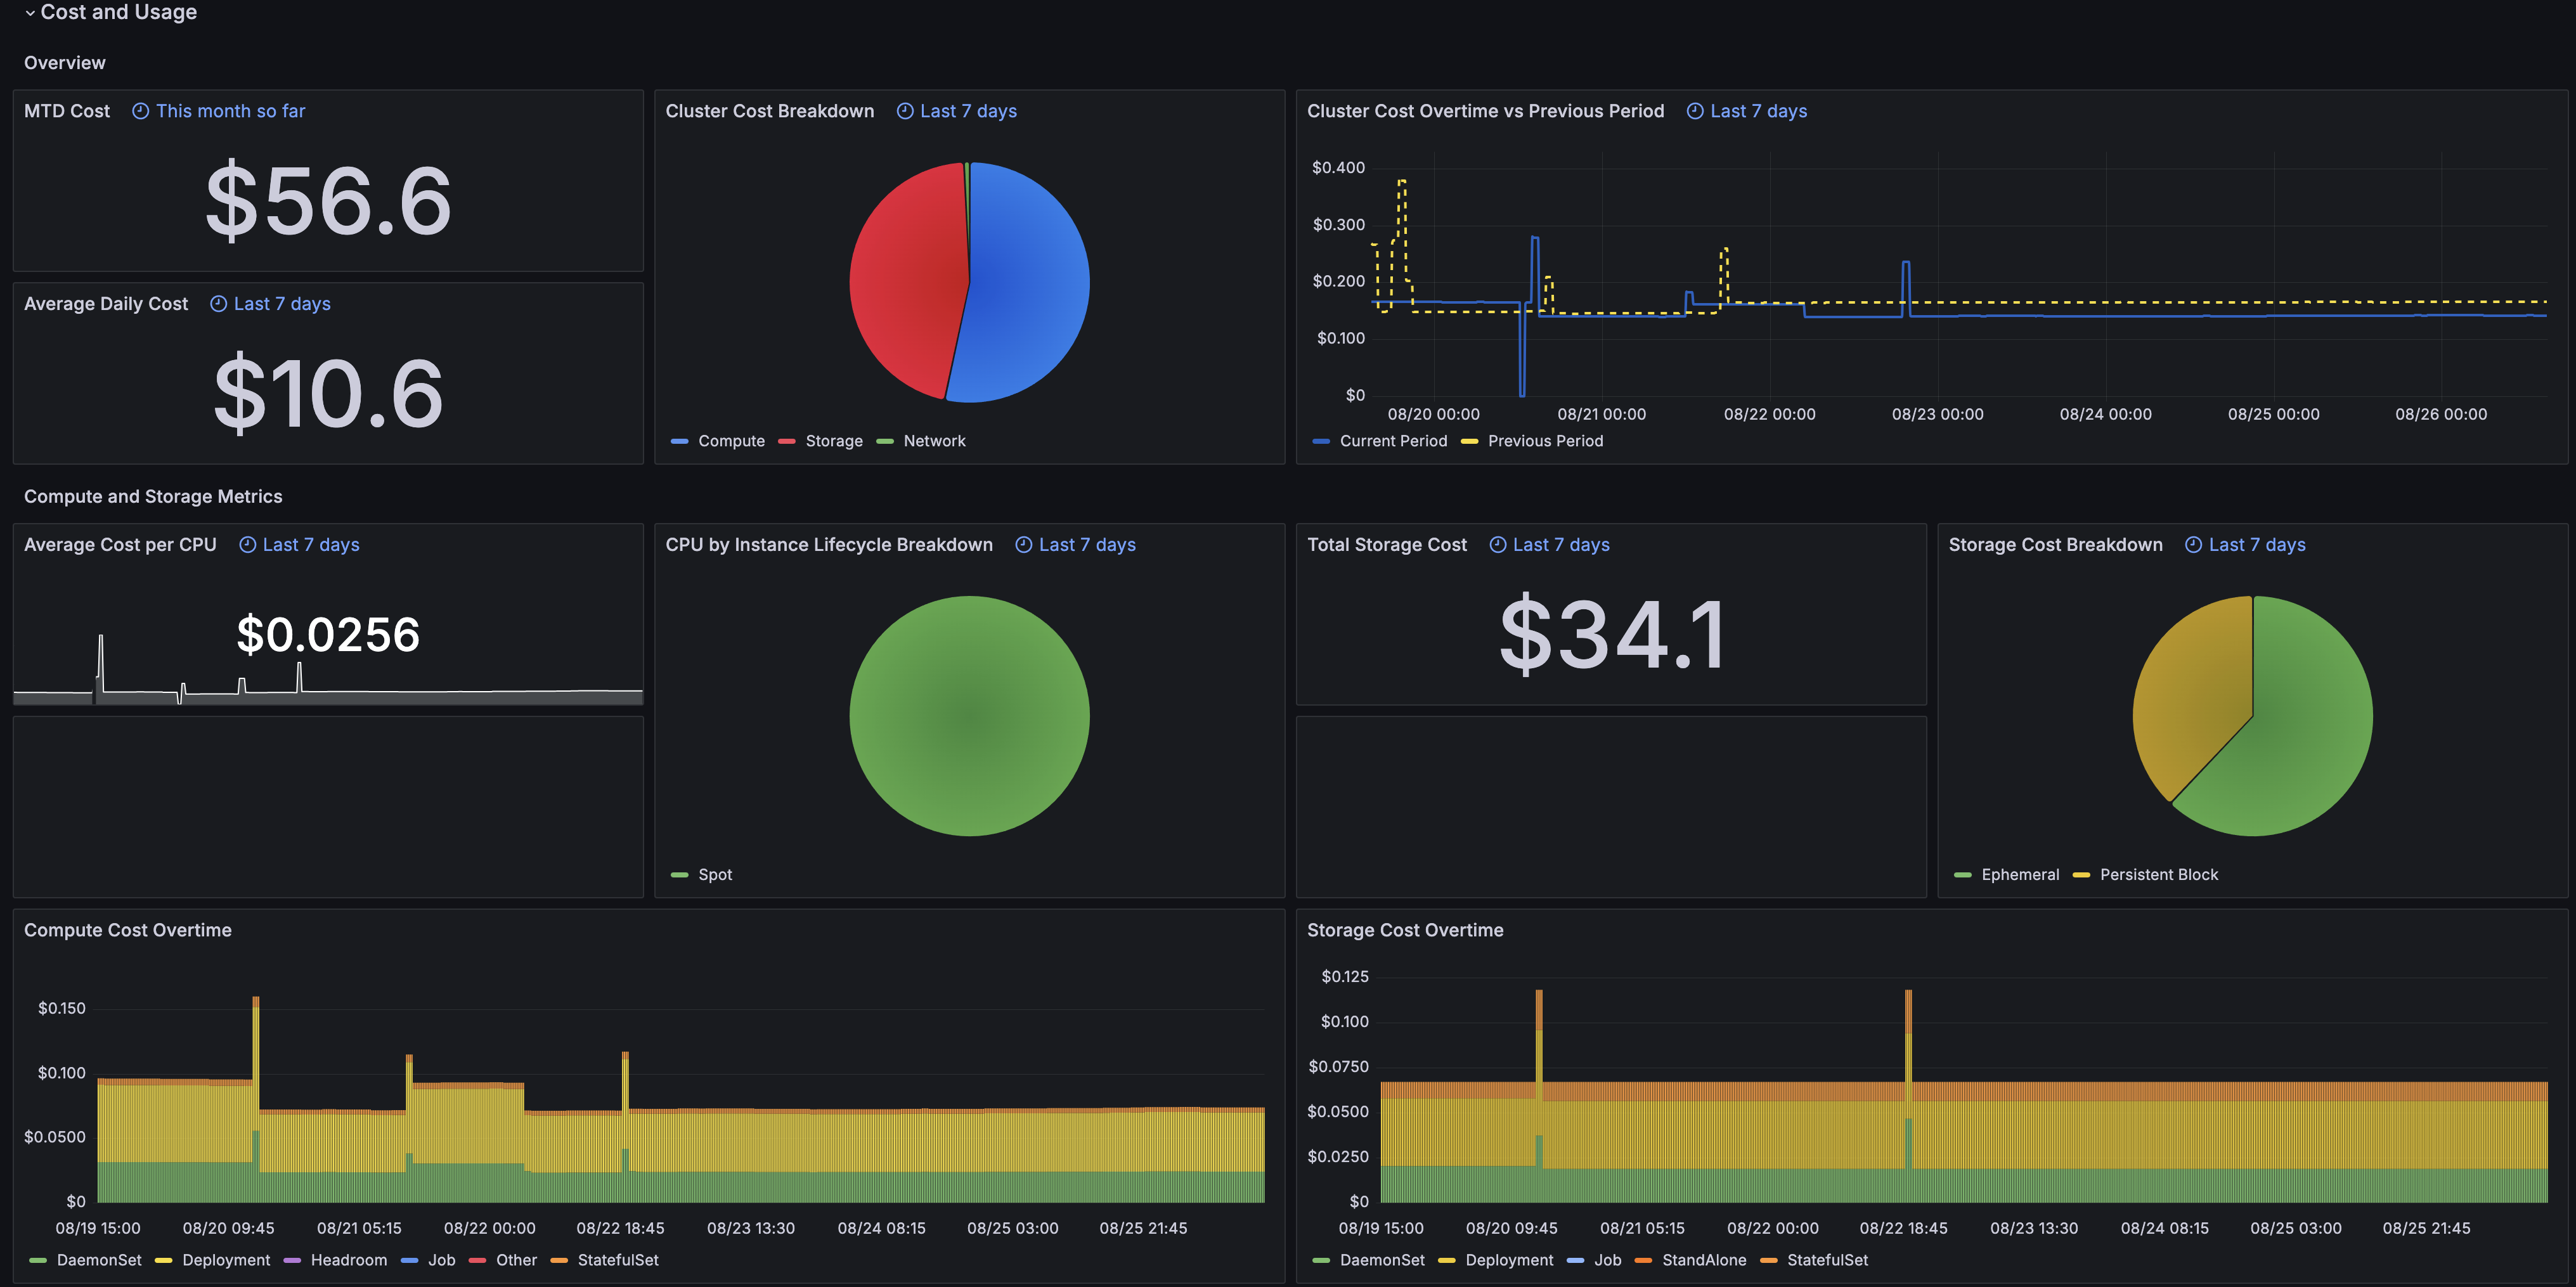
Cost Metrics
Current Status
- Month-to-Date cluster cost. Source: Ocean.
- Average daily cluster cost during the selected aggregation interval. Source: Ocean.
- Cluster cost breakdown during the selected aggregation interval. Source: Ocean.
- Cluster cost over time during the selected aggregation interval vs previous period. Source: Ocean.
Compute and Storage Metrics
- Average cost per CPU during the selected aggregation interval. Source: Ocean.
- CPU by instance lifecycle breakdown during the selected aggregation interval. Source: Ocean.
- Cluster storage cost during the selected aggregation interval. Source: Ocean.
- Cluster storage cost breakdown during the selected aggregation interval. Source: Ocean.
- Cluster compute cost over time. Source: Ocean.
- Cluster storage cost over time. Source: Ocean.
- Cluster CPU usage over time. Source: Ocean.
- Cluster memory usage over time. Source: Ocean.
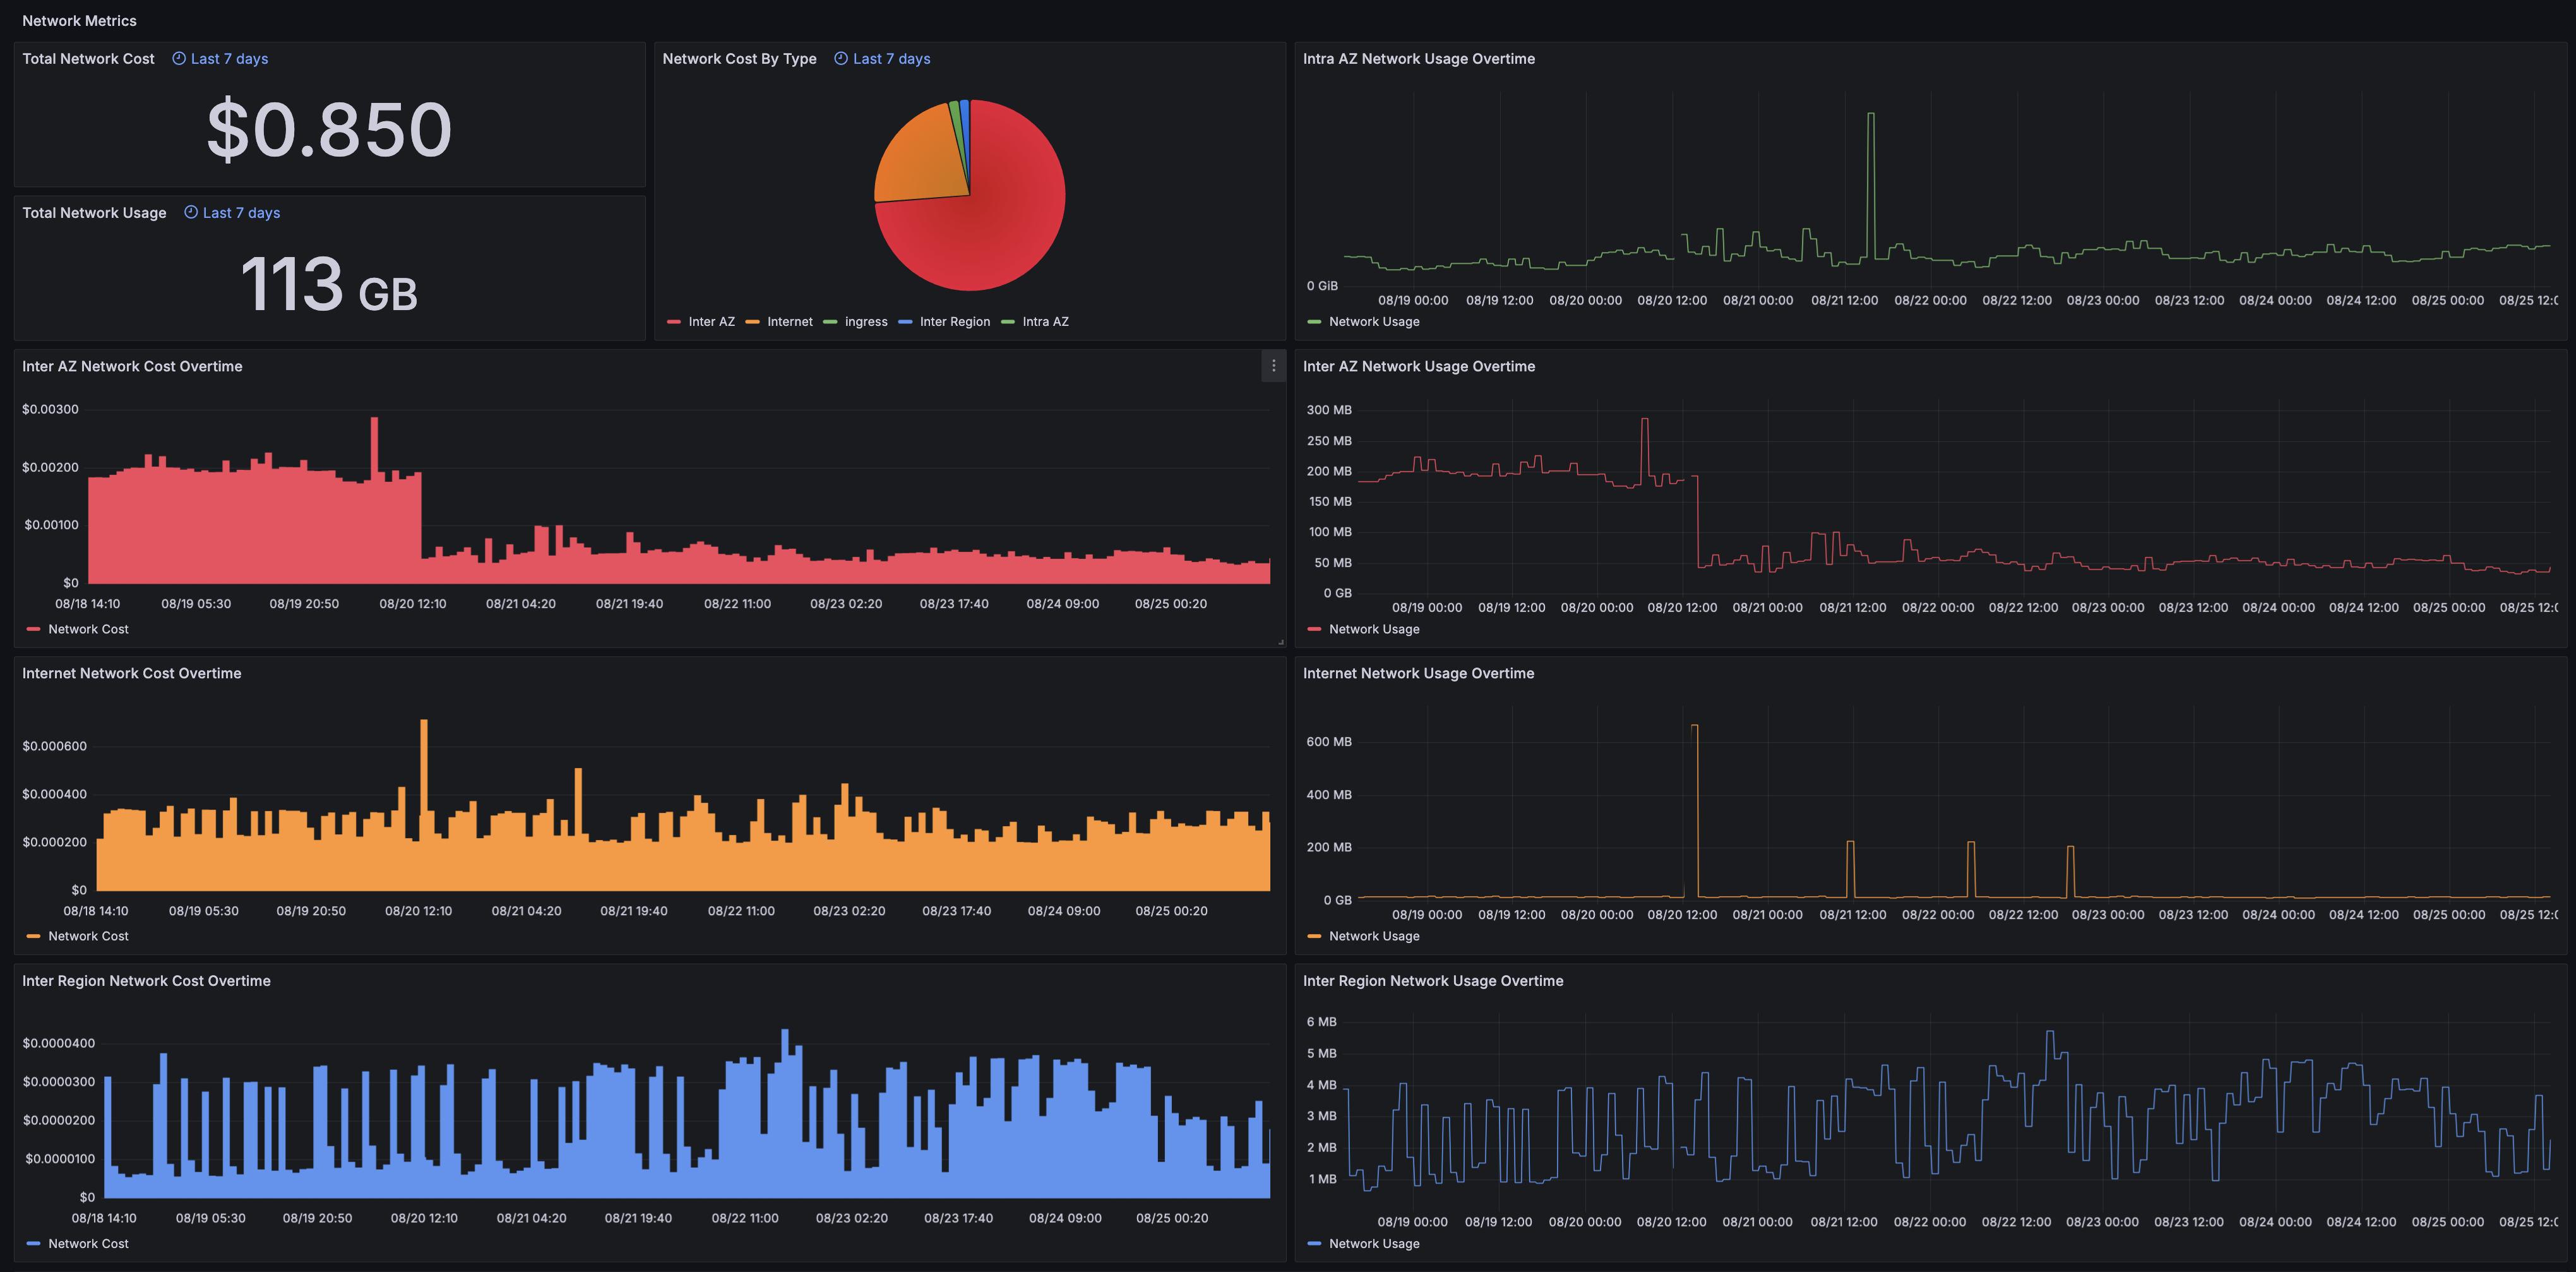
Network Metrics
- Cluster network cost during the selected aggregation interval. Source: Ocean.
- Cluster network usage during the selected aggregation interval. Source: Ocean.
- Cluster network cost breakdown during the selected aggregation interval. Source: Ocean.
- Cluster Intra-AZ network usage over time. Source: Ocean.
- Cluster Inter-AZ network cost over time. Source: Ocean.
- Cluster Inter-AZ network usage over time. Source: Ocean.
- Cluster Internet network cost over time. Source: Ocean.
- Cluster Internet network usage over time. Source: Ocean.
- Cluster Inter-Region network cost over time. Source: Ocean.
- Cluster Inter-Region network usage over time. Source: Ocean.
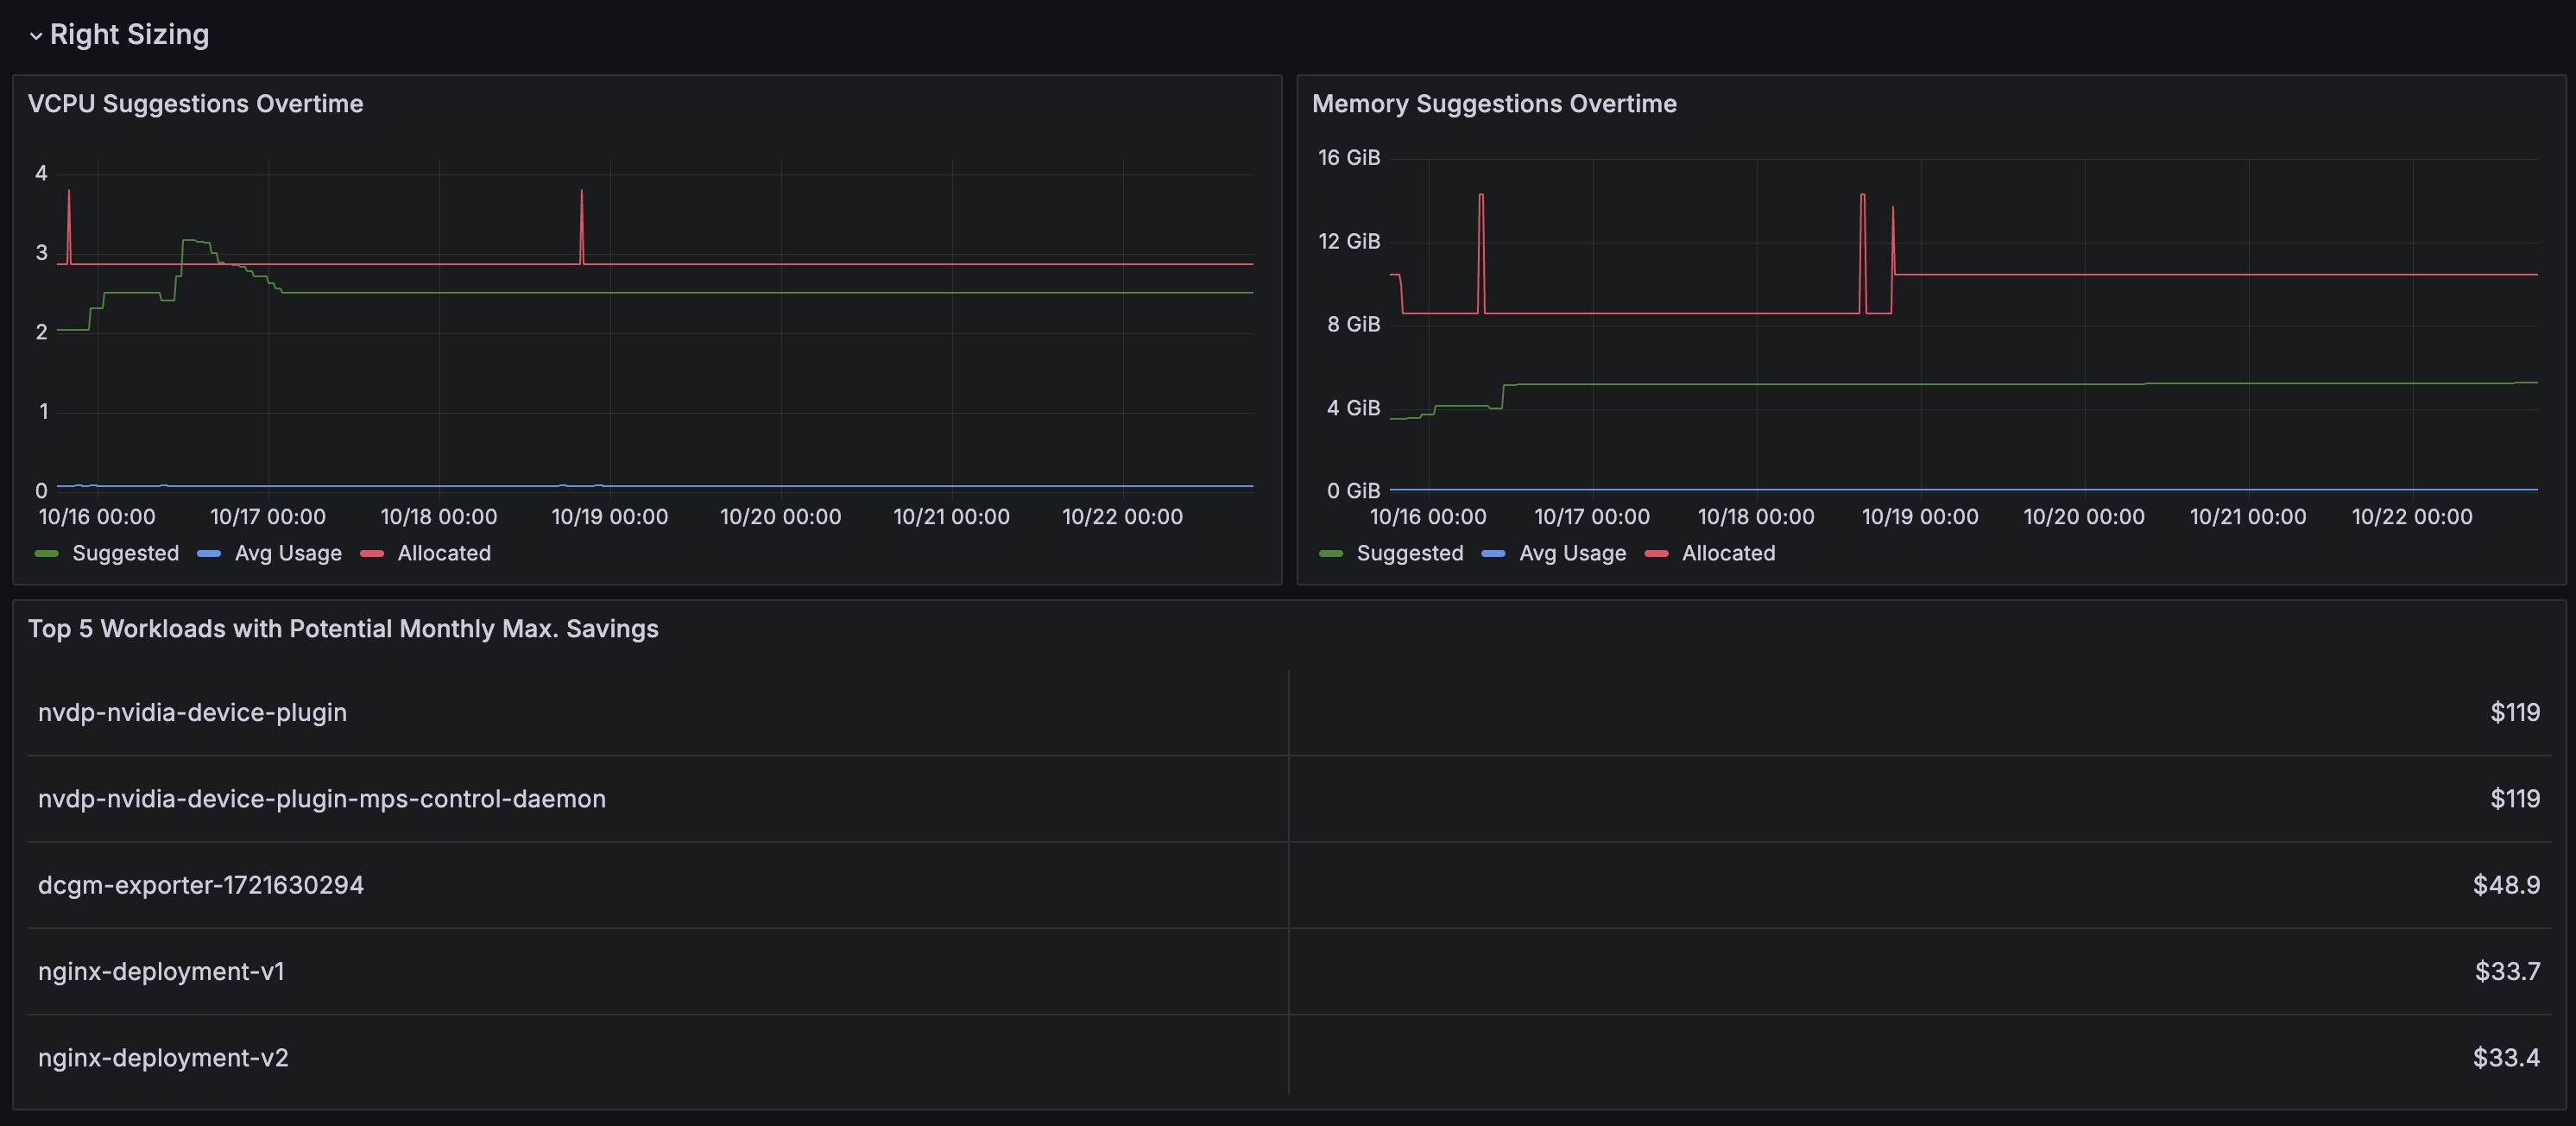
Right-Sizing Metrics
- VCPU Suggestions Overtime. Source: Ocean.
- Memory Suggestions Overtime. Source: Ocean.
- Top 5 Workloads with Potential Monthly Max. Savings. Source: Ocean.
Ocean metrics are relevant to Ocean Prometheus Exporter for EKS, AKS, and GKE.
More information at https://docs.spot.io/ocean/tools-and-integrations/prometheus/
Cluster Dependencies / Prerequisites
- Ocean controller. More information at https://docs.spot.io/ocean/overview-kubernetes
- Ocean network client. More information at https://docs.spot.io/ocean/tutorials/install-network-client-v2
- Ocean metric exporter. More information at https://docs.spot.io/ocean/tools-and-integrations/prometheus/scrape
- kube-state-metrics service.
- Prometheus server.
Customer Feedback
The template is also available in the Spot Ocean public repository https://github.com/spotinst/spot-ocean-grafana-dashboards, where it's possible to submit feedback regarding any issues or propose new features to further enhance the dashboard's functionality.
Next Plans
- Complete metrics set
- Add alerts templates
- Improve continuously
Data source config
Collector config:
Upload an updated version of an exported dashboard.json file from Grafana
| Revision | Description | Created | |
|---|---|---|---|
| Download |