
Substrate Node Metrics
An updated version of "My Polkadot Metrics" Grafana dashboard.
An updated version of My Polkadot Metrics Grafana dashboard.
Metrics
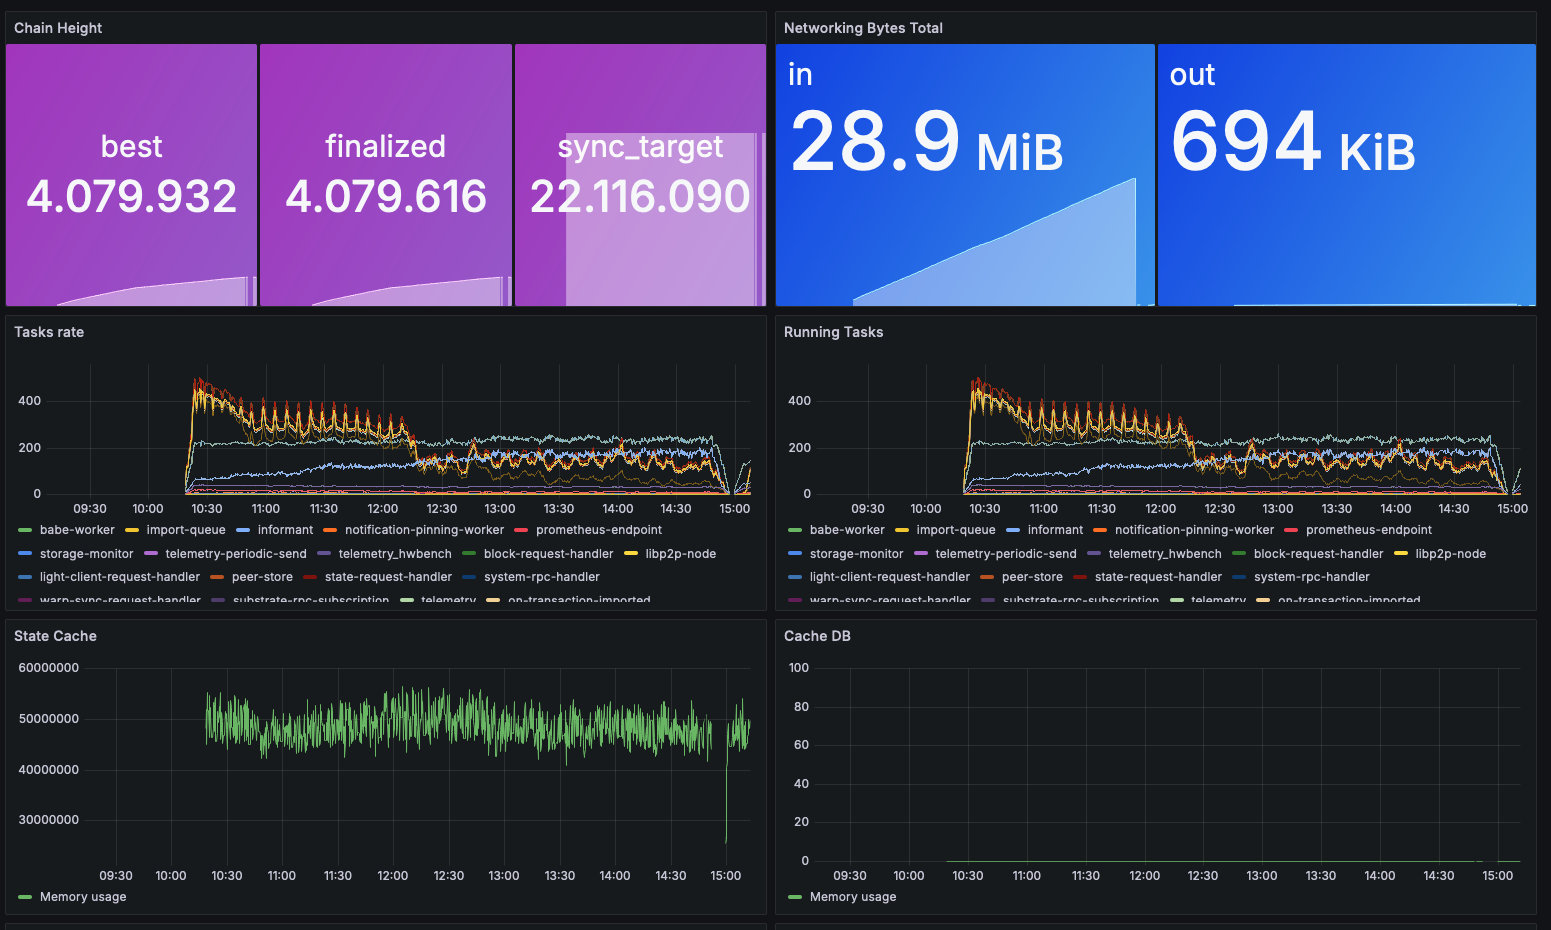
- Chain height
- Network downstream/upstream traffic
- Tasks rate
- Running Tasks
- State Cache
- Database Cache
- Peers connected & discovered
- Number of peers in sync with
- Number of blocks in import queue
- Blocks processed by import queue
- Number of known chain leaves (aka forks)
- GRANDPA validator messages
- Number of transactions in the ready queue
- Number of extra justifications requests per status
Data source config
Collector type:
Collector plugins:
Collector config:
Revisions
Upload an updated version of an exported dashboard.json file from Grafana
| Revision | Description | Created | |
|---|---|---|---|
| Download |
Linux Server
Monitor Linux with Grafana. Easily monitor your Linux deployment with Grafana Cloud's out-of-the-box monitoring solution.
Learn more