
Podman Exporter Dashboard
This dashboard leverages Prometheus podman exporter as the data source and utilizes various visualization panels like time series and tables, providing critical insights into the operational metrics of Podman containers.
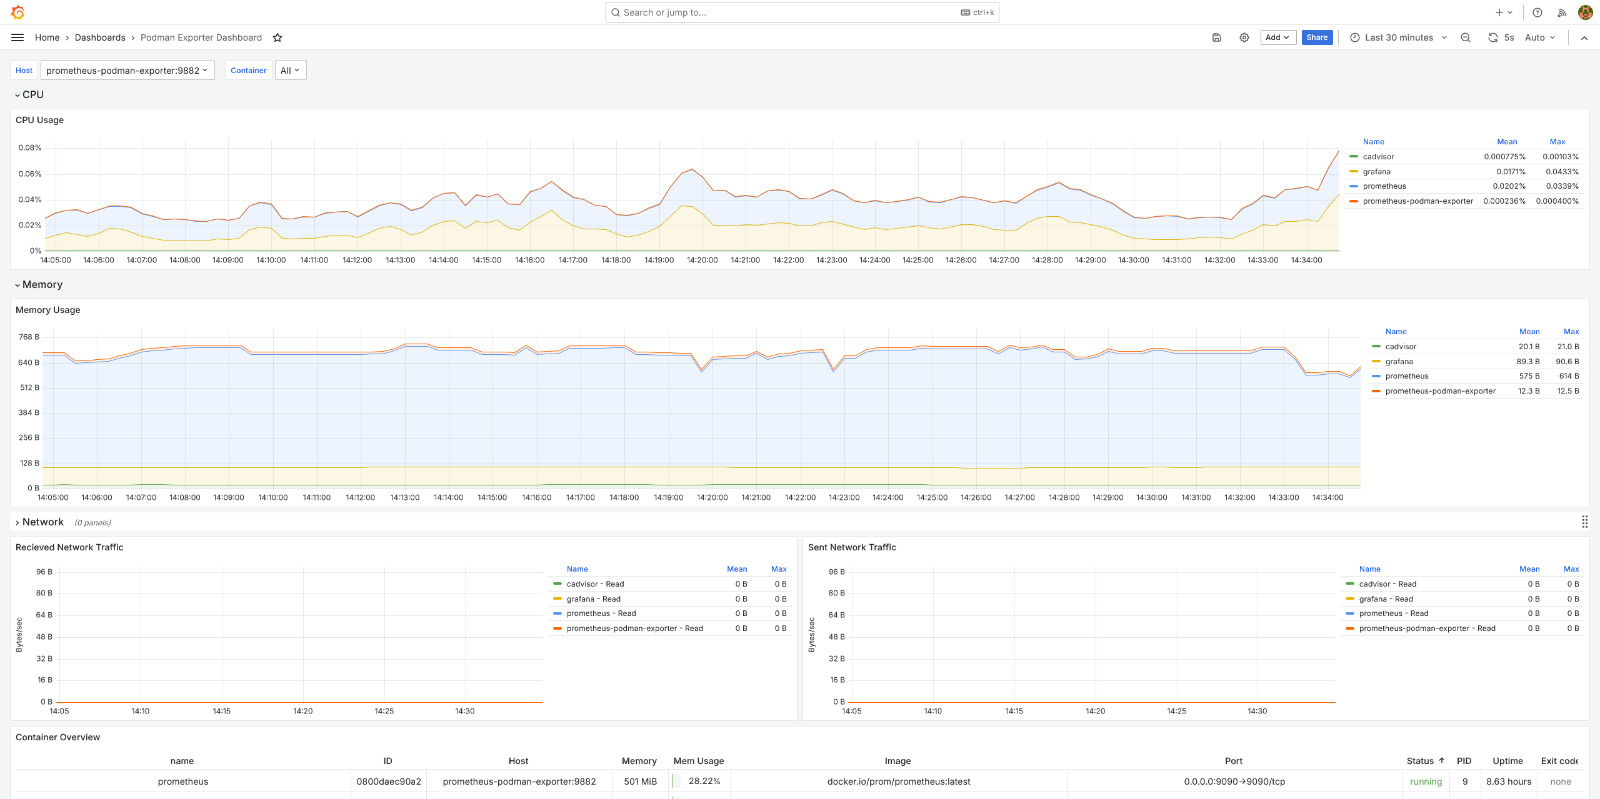
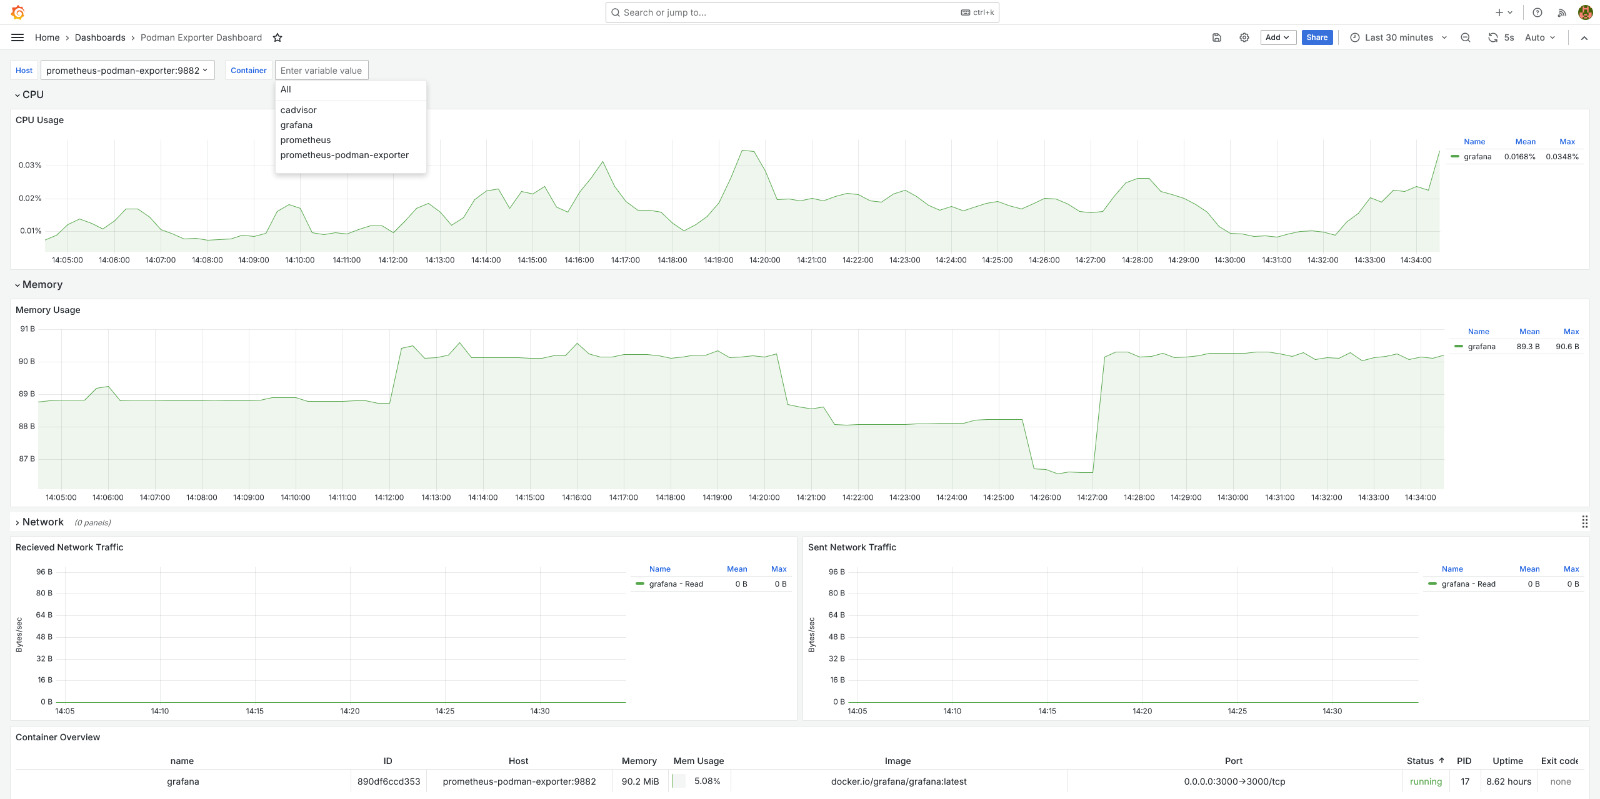
The Podman Exporter Dashboard dashboard uses the prometheus data source to create a Grafana dashboard with the table and timeseries panels.
Data source config
Collector type:
Collector plugins:
Collector config:
Revisions
Upload an updated version of an exported dashboard.json file from Grafana
| Revision | Description | Created | |
|---|---|---|---|
| Download |