K6 Prome Load Test
with Native Histograms - v1
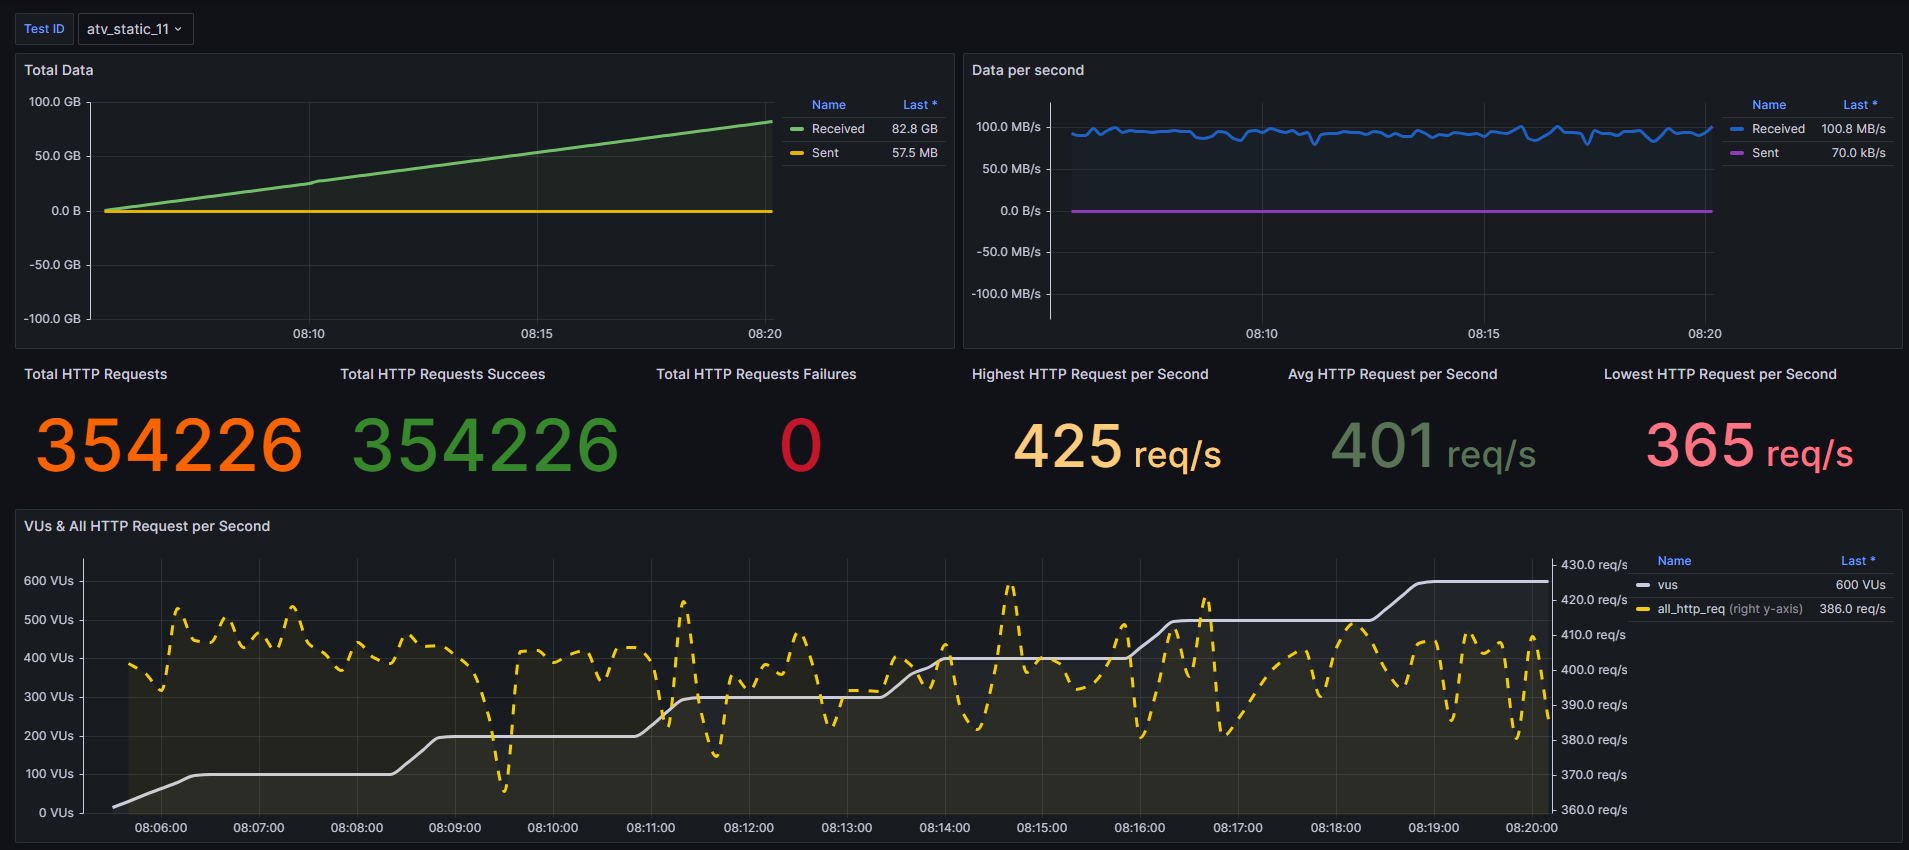
Dashboard to help you view k6 load test results with Prometheus as Data Source, Trend statistics, and Native Histogram enabled on k6
Feature :
- Total Sent/Receive Data
- Sent/Receive Data per Second
- HTTP Requests (Total, Success, Failures, Highest/Avg/Lowest RPS) with Time Series format
- VUs with Time Series format
- Success/Error Request Statistic with Table format ( Method, status code, min, max, p95, pss)
Data source config
Collector config:
Upload an updated version of an exported dashboard.json file from Grafana
| Revision | Description | Created | |
|---|---|---|---|
| Download |


