
Kubernetes / Overview
This dashboard is designed to be a one-stop solution for monitoring your Kubernetes cluster
Grafana Dashboard Overview
This dashboard provides a comprehensive view of the health and resource utilization within a Kubernetes cluster. It is designed to assist cluster administrators and DevOps engineers in monitoring and optimizing their deployments.
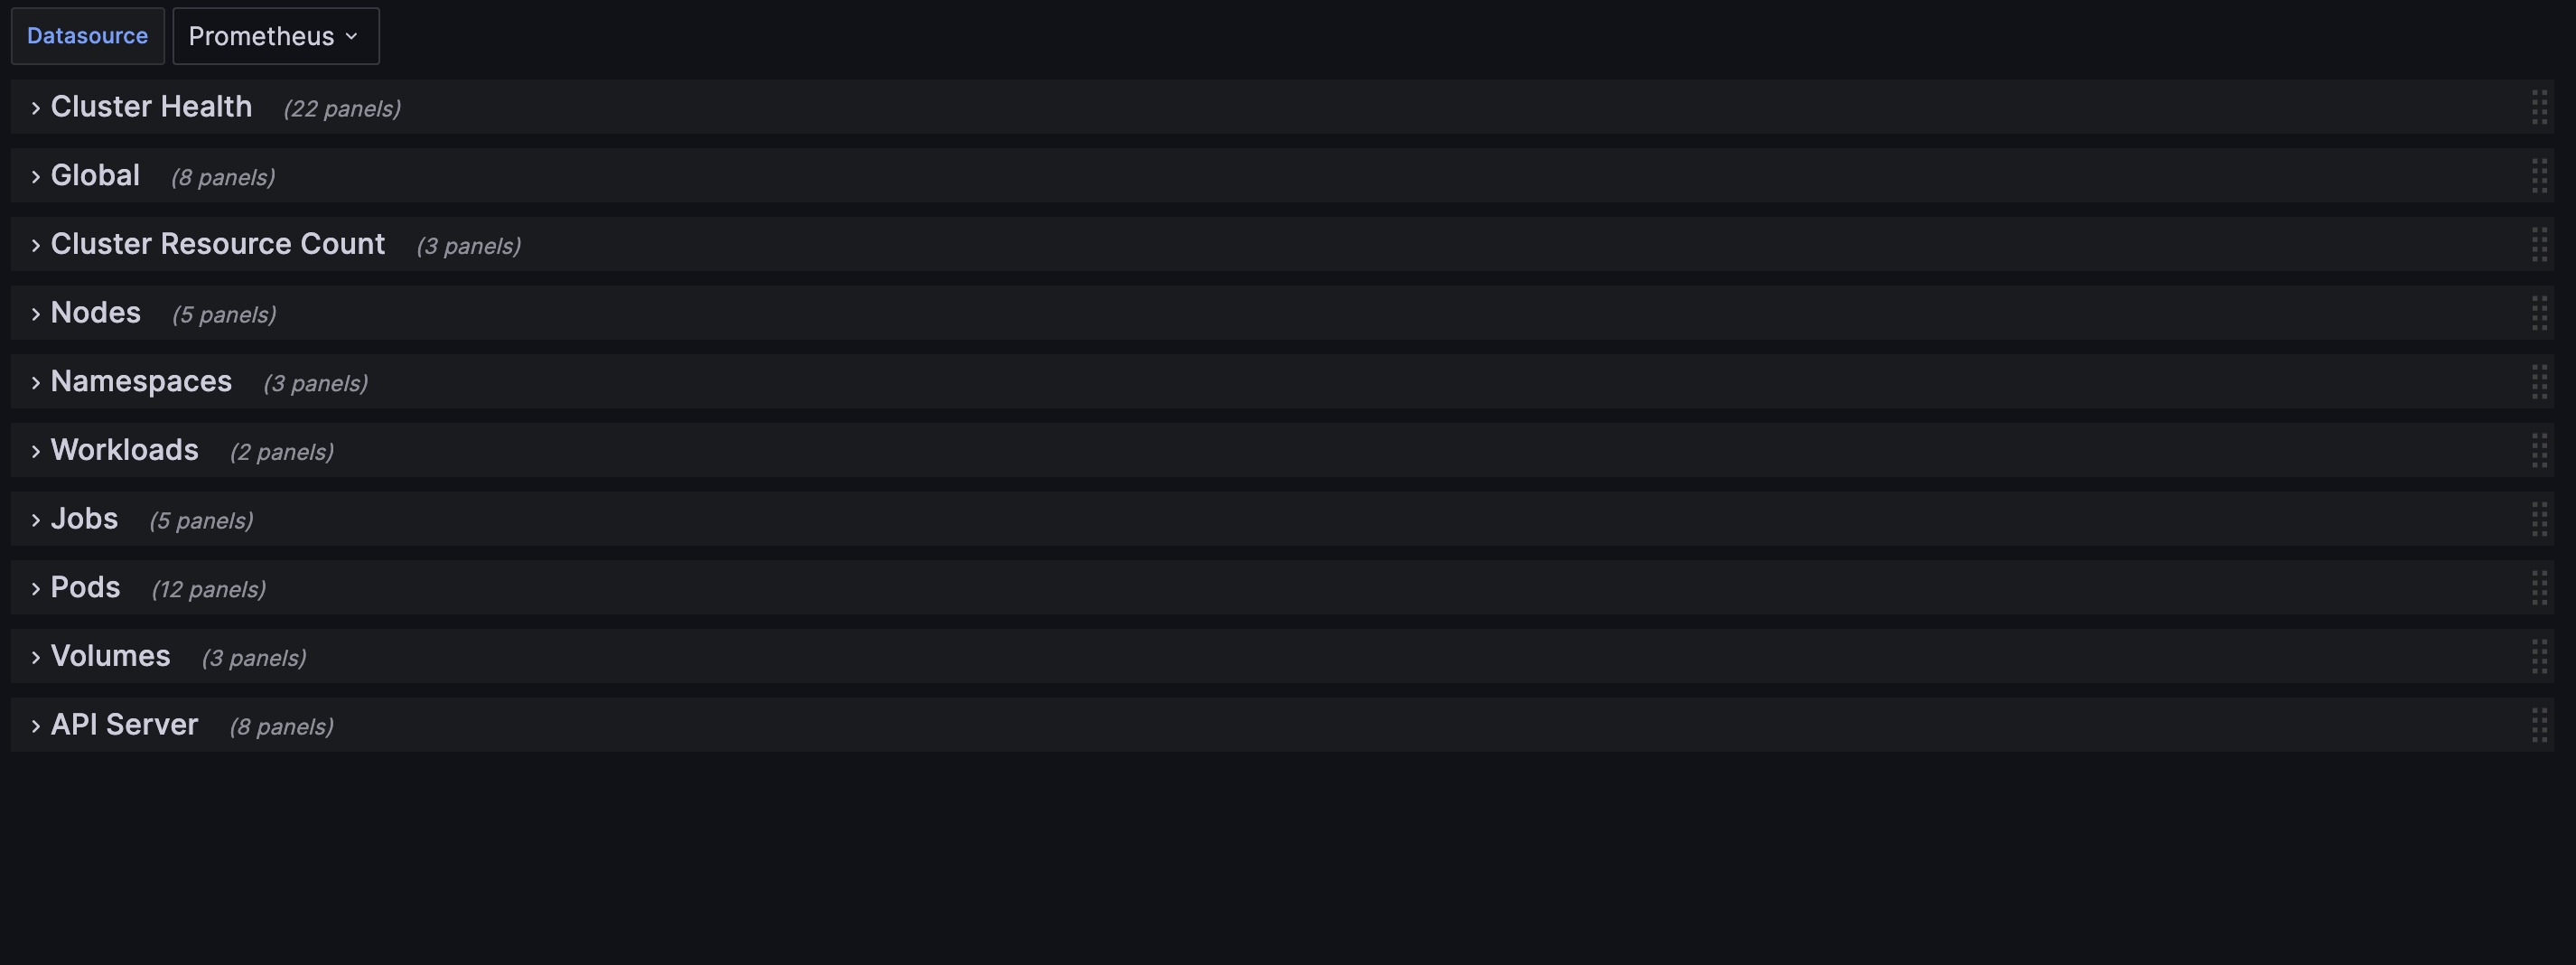
Here are the key sections of the dashboard:
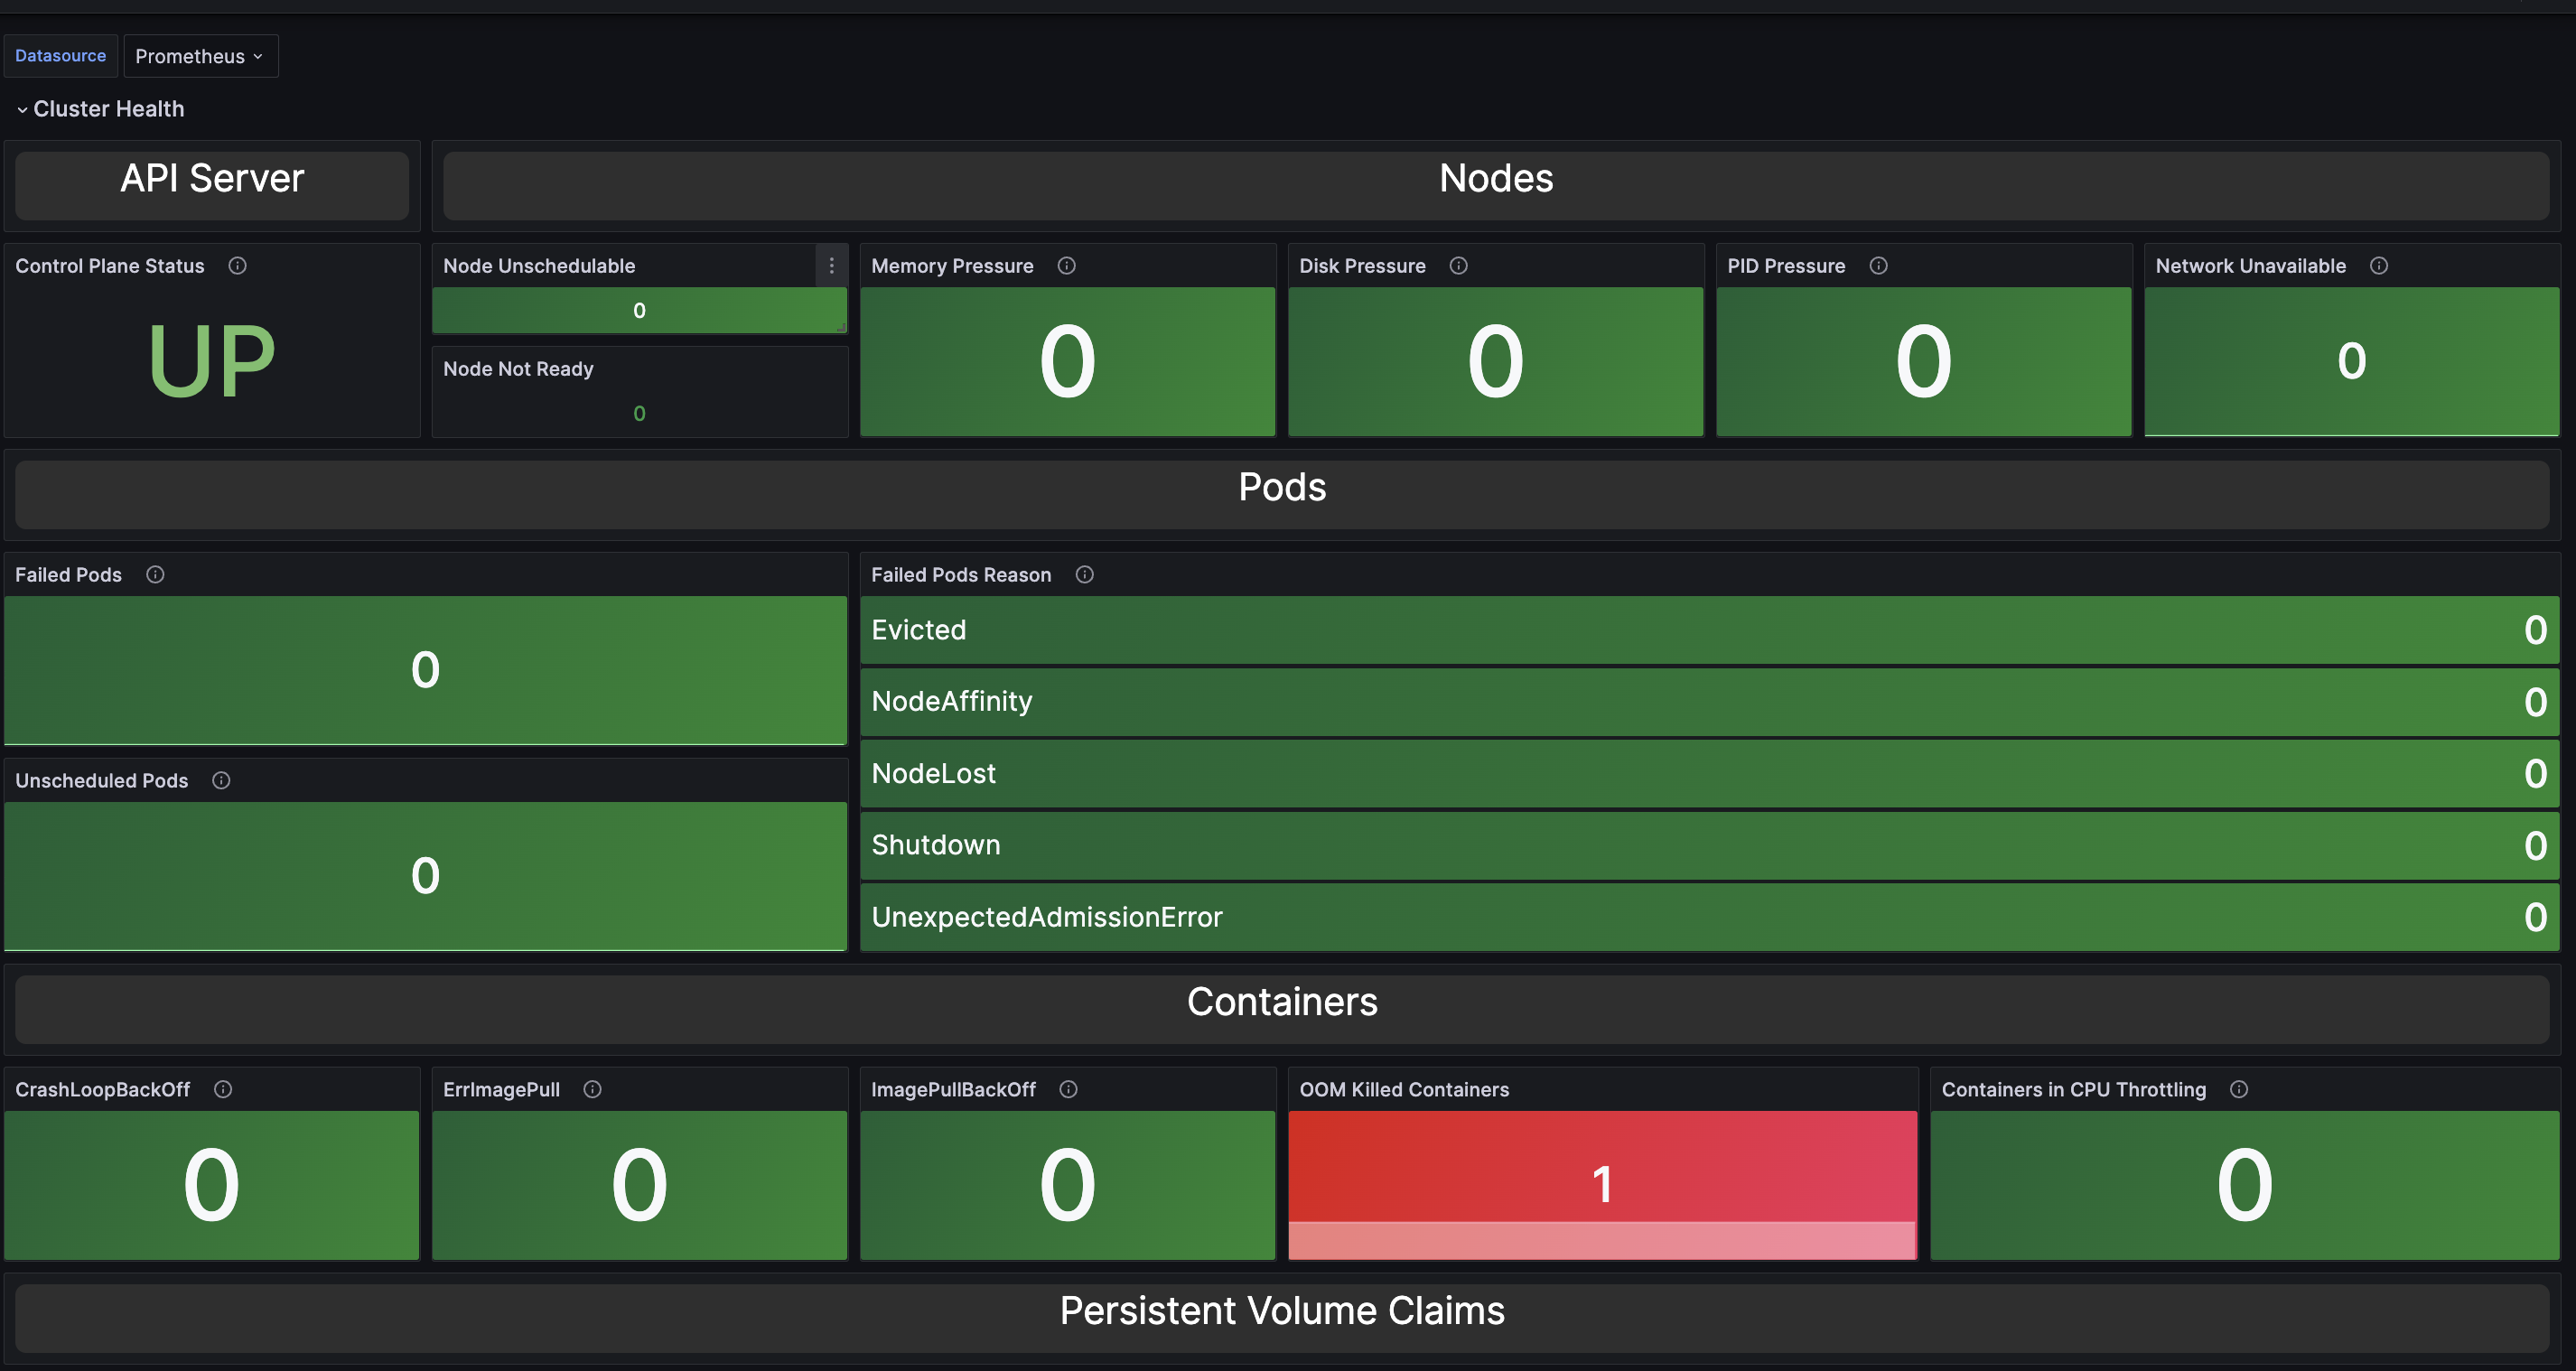
- Cluster Health
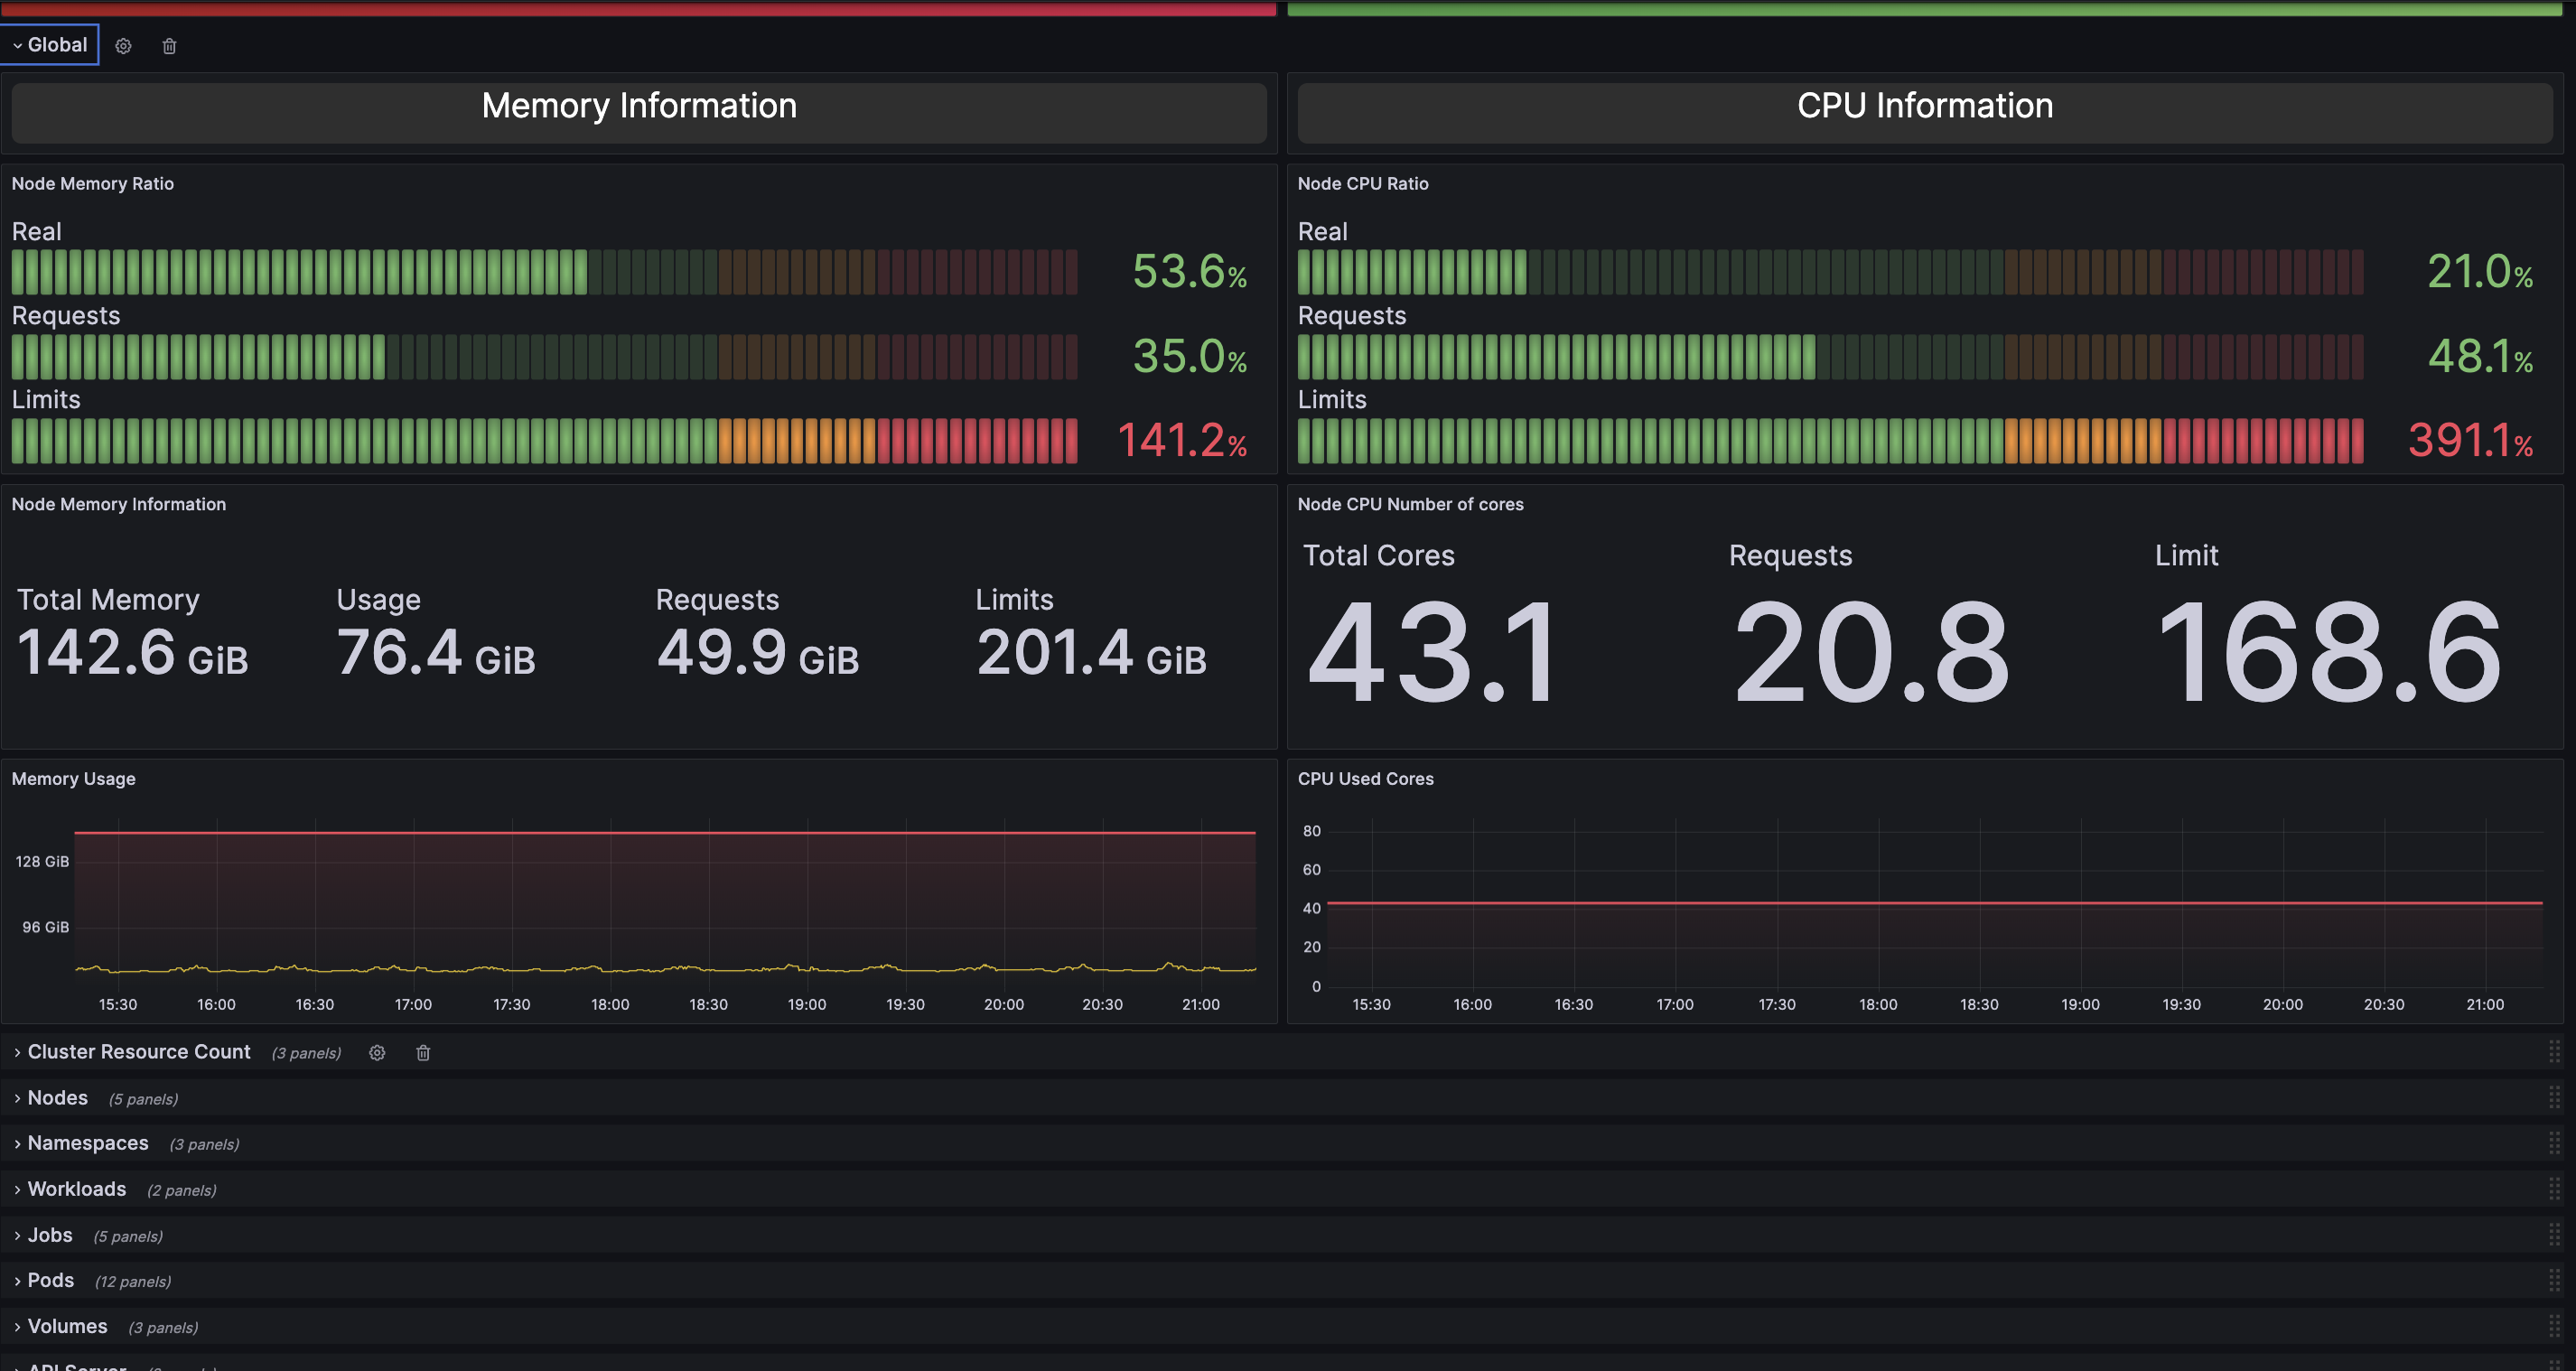
- Resource Usage and Commitment
- Nodes Usage and Commitment
- Persistent Volume Claims (PVCs)
- API Server Resources
Data source config
Collector type:
Collector plugins:
Collector config:
Revisions
Upload an updated version of an exported dashboard.json file from Grafana
| Revision | Description | Created | |
|---|---|---|---|
| Download |
Kubernetes
Monitor your Kubernetes deployment with prebuilt visualizations that allow you to drill down from a high-level cluster overview to pod-specific details in minutes.
Learn more