
Microsoft SQL Server Dashboard
This is a comprehensive Microsoft SQL Server Dashboard designed to monitor key performance indicators. It provides real-time insights into your SQL Server environment.
Microsoft SQL Server Dashboard
Overview
This is a comprehensive Grafana dashboard designed for monitoring Microsoft SQL Server. It provides real-time insights into your SQL Server environment, making it easy for both technical and non-technical users to understand the performance of their SQL Server instances.
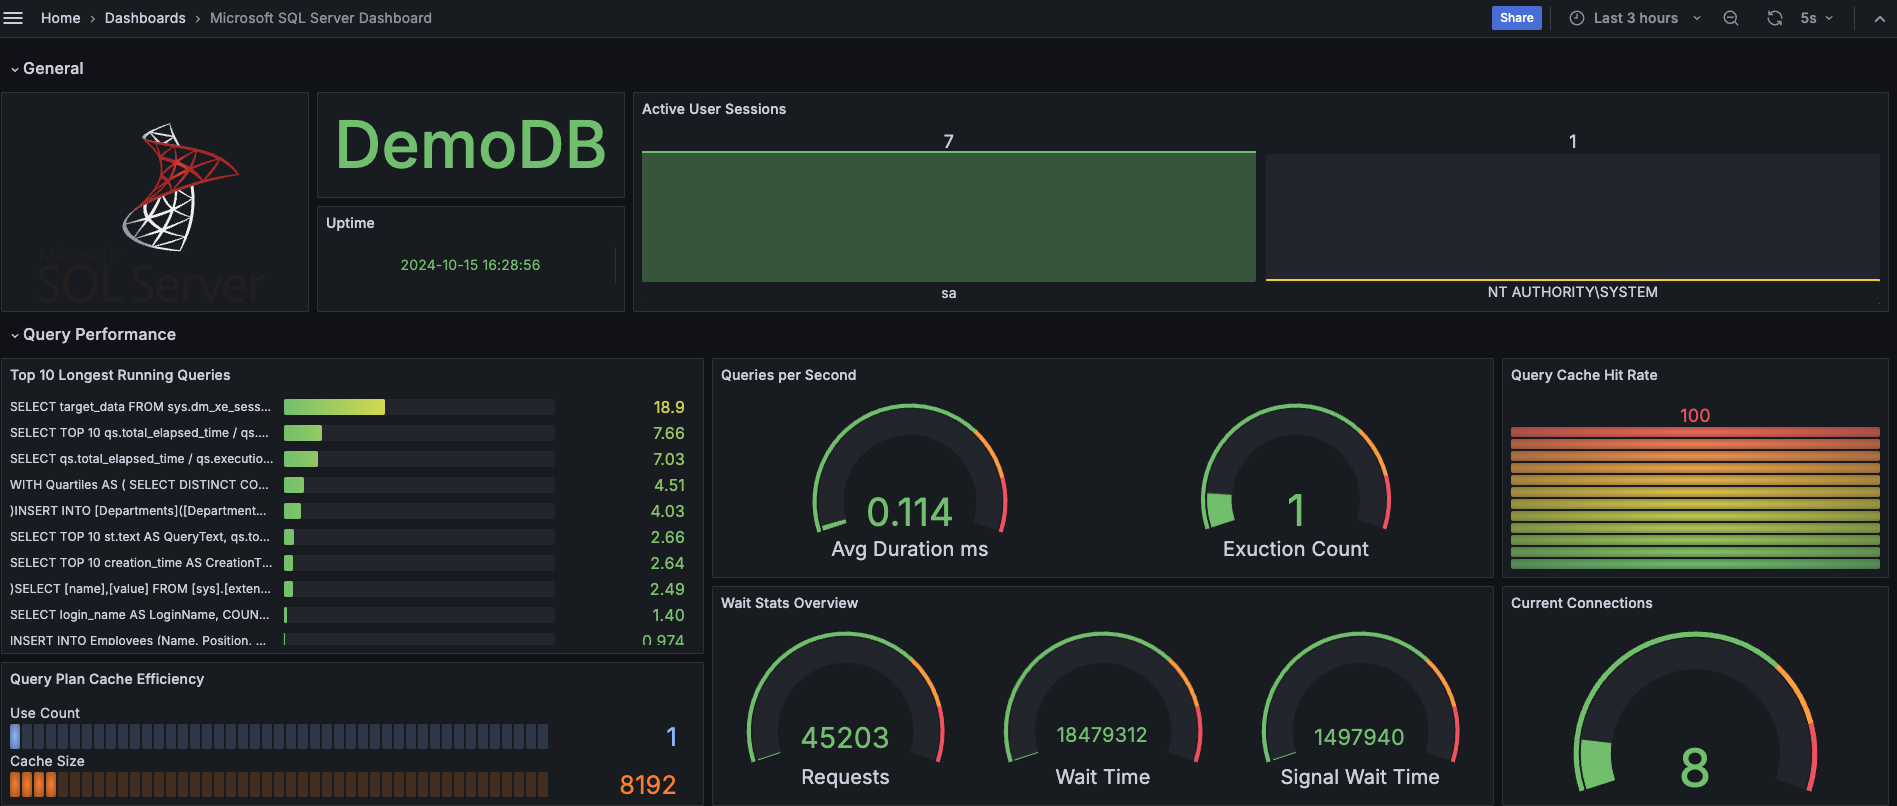
General
- Database name: Displays the database name.
- Uptime: Displays the SQL Server start time.
- Active User Sessions: Shows the count of active user sessions by login name.
Query Performance
- Top 10 Longest Running Queries: Lists the top 10 queries with the longest average duration.
- Queries per Second: Provides average duration and execution count of queries.
- Query Cache Hit Rate: Visualizes the cache hit ratio for queries.
- Query Plan Cache Efficiency: Shows the efficiency of cached query plans.
- Wait Stats Overview: Displays an overview of wait statistics in SQL Server.
- Current Connections: Indicates the current number of connections to the SQL Server.
- Query Latency: Visualizes latency for recent queries.
- Execution Plans Performance: Monitors performance metrics of executed plans.
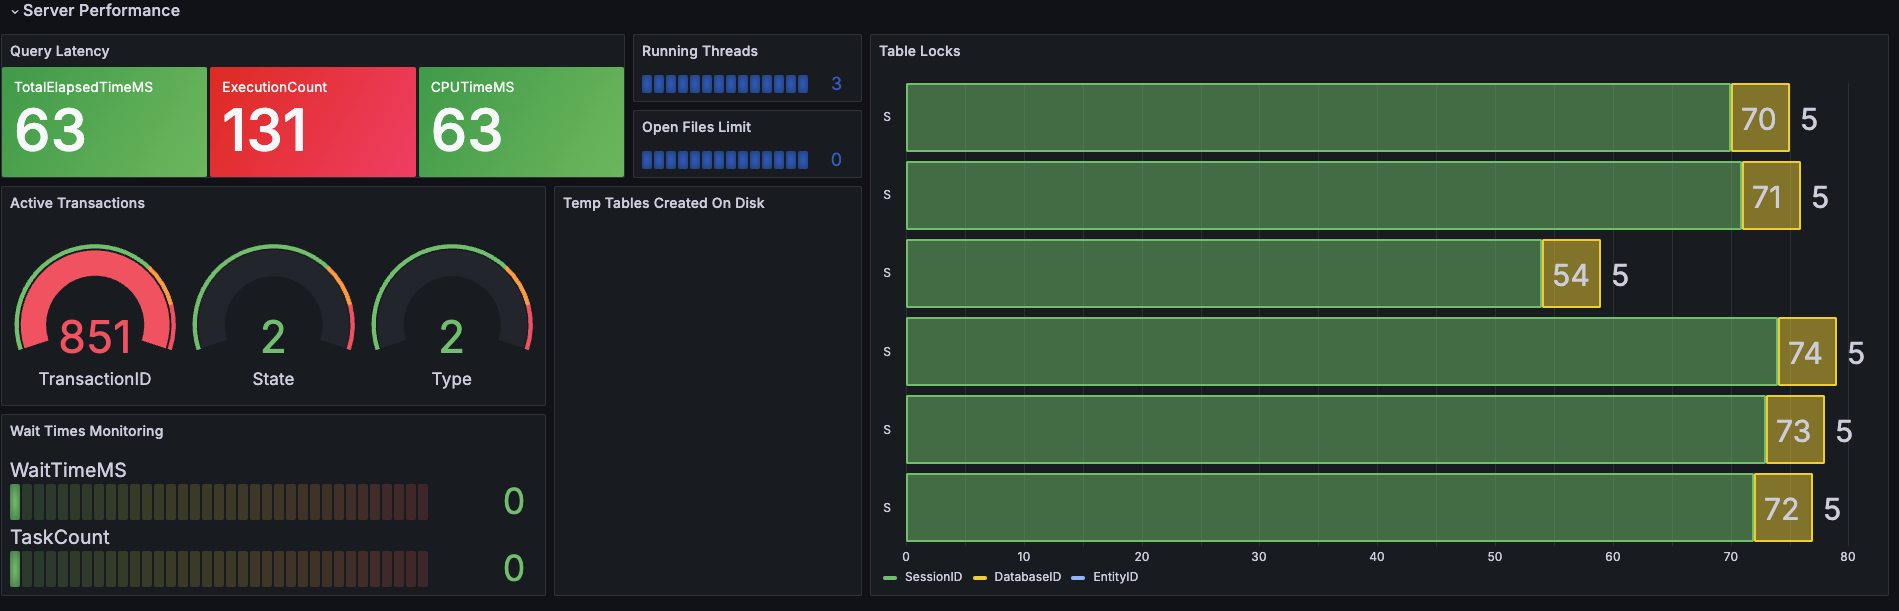
Server Performance
- Query Latency: Displays the top 10 longest running queries based on total elapsed time.
- Running Threads: Displays the number of running threads in the SQL Server.
- Open Files Limit: Shows the count of currently open files.
- Active Transactions: Provides details on active transactions in the system.
- Temp Tables Created On Disk: Monitors the number of temporary tables created on disk.
- Table Locks: Displays information on current table locks.
- Waiting Times Monitoring: Provides an overview of wait statistics in SQL Server.
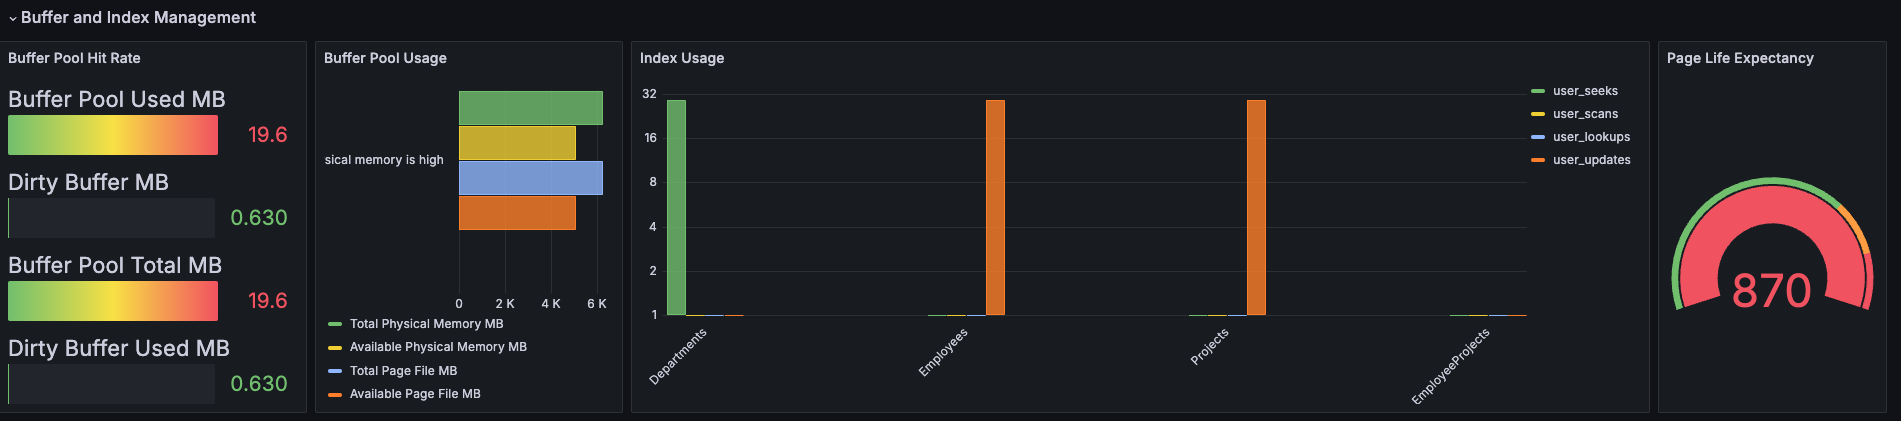
Buffer and Index Management
- Buffer Pool Hit Rate: Visualizes the hit rate of the buffer pool.
- Buffer Pool Usage: Monitors the overall usage of the buffer pool.
- Index Usage: Displays usage statistics for database indexes.
- Page Life Expectancy: Shows the average time pages stay in the buffer pool.
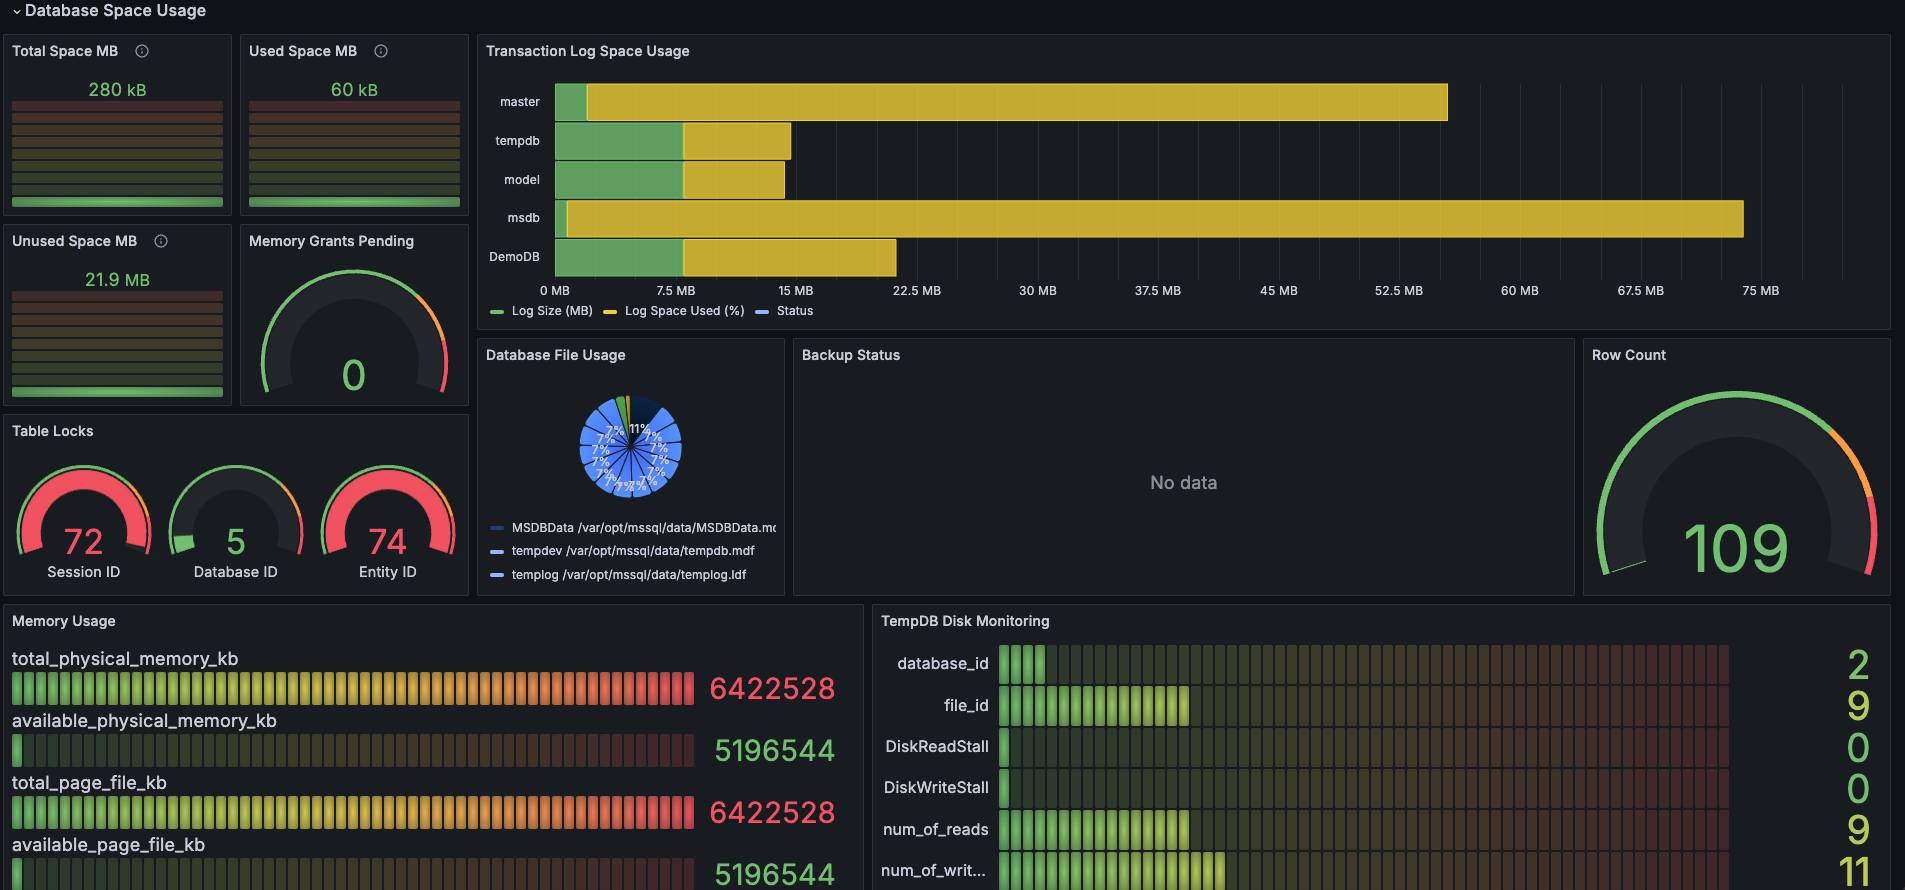
Database Space Usage
- Total Space: Displays the total space allocated to all tables in the database.
- Used Space: Shows the space currently used by all tables.
- Unused Space: Provides information on unused space in the database.
- Memory Grants Pending: Indicates the count of pending memory grants.
- Transaction Log Space Usage: Displays the usage of transaction log space.
- Database File Usage: Shows details about database files and their sizes.
- Table Locks: Provides information on current table locks.
- Backups Status: Displays the status of recent database backups.
- Memory Usage: Visualizes overall memory usage in SQL Server.
- TempDB Disk Monitoring: Monitors I/O stalls for TempDB files.
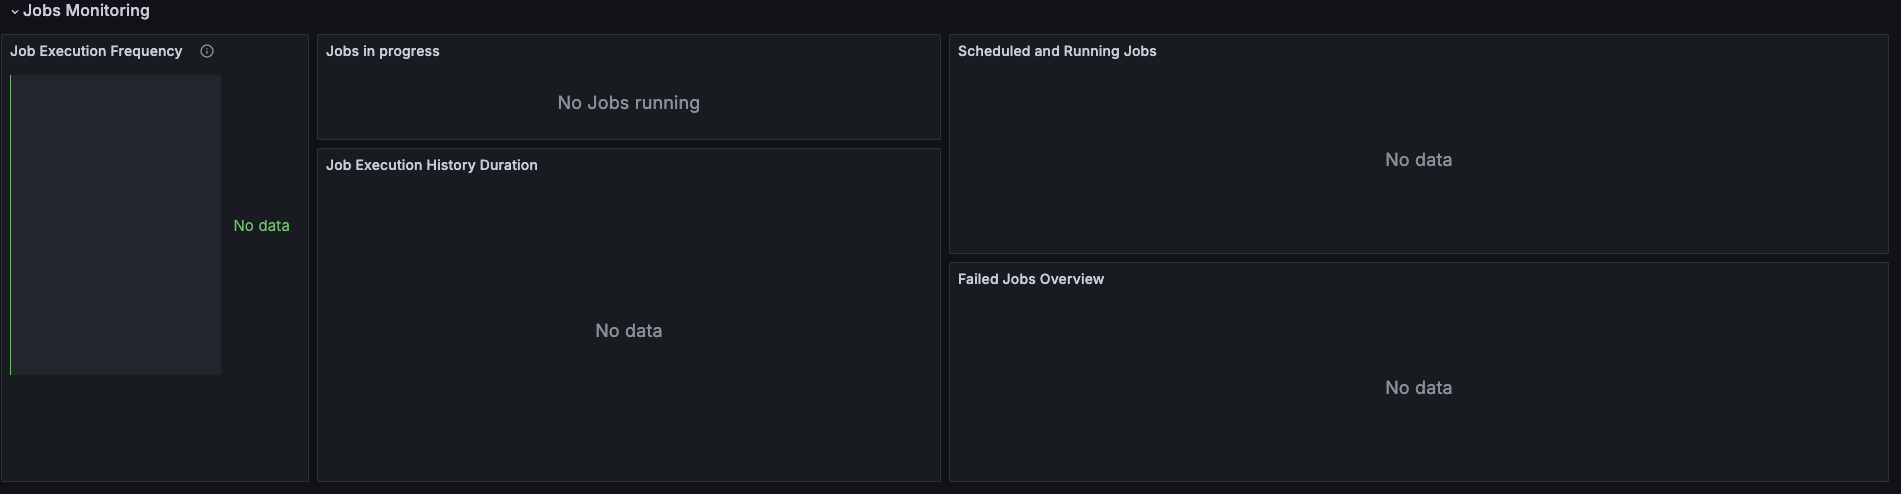
Jobs Monitoring
- Job Execution Frequency: Displays the execution count of jobs over the last week.
- Job Execution History Duration: Shows job execution history along with durations.
- Jobs in Progress: Lists jobs that are currently running along with their durations.
- Failed Jobs Overview: Provides an overview of recently failed jobs and their error messages.
- Scheduled and Running Jobs: Displays the status of scheduled and currently running jobs.
You are welcome to contribute to the project at this link. If you find it interesting, please consider giving it a star ⭐️ ! Your support is greatly appreciated.
Data source config
Collector config:
Upload an updated version of an exported dashboard.json file from Grafana
| Revision | Description | Created | |
|---|---|---|---|
| Download |
Microsoft Azure Observability
Easily visualize and alert on Microsoft Azure Service resources using the fully managed Grafana Cloud platform.
Learn more