
VAST 4.7 Cluster Statistics
Dashboard for visualizing VAST 4.7 cluster metrics
Introduction
The VAST Data Platform unifies storage, database, and containerized compute into a single, scalable software platform to power AI & deep learning in modern data centers and clouds.
In addition to the in-depth analytics provided in the product UI, VAST versions 4.5.0 and later have built-in Prometheus exporters for easy integration into existing monitoring infrastructure.
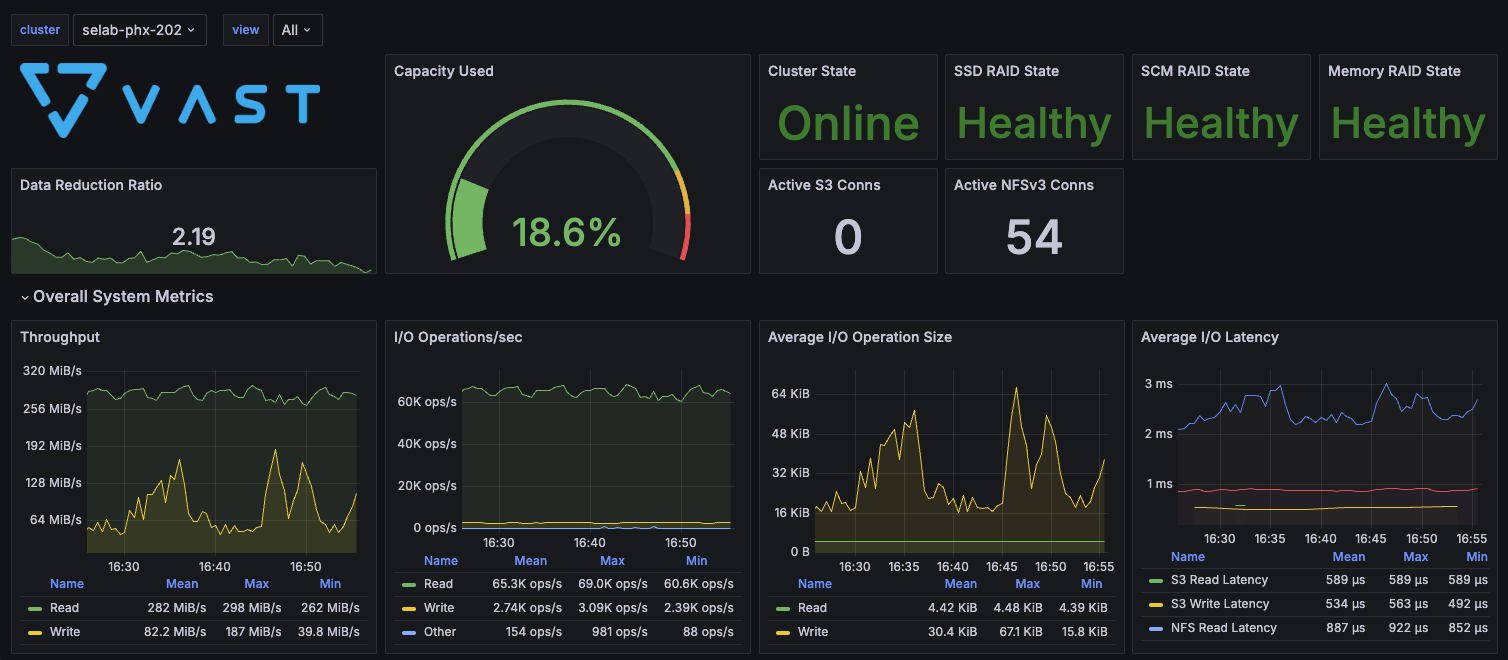
This dashboard provides a heads-up view for visualizing:
- Cluster health and statistics
- NFSv3 and S3 protocol statistics
- View statistics
- User statistics
- Hardware health and statistics
Compatibility
For VAST 5.0 and later, see the new VAST Cluster Statistics dashboard.
This dashboard supports VAST 4.7 and later with the built-in Prometheus exporter. For a 4.6 dashboard, or one that sources from the external exporter, please contact VAST support.
Prometheus Configuration
VAST clusters running 4.6.0-sp11 and later provide separate metrics endpoints to give more control on which metrics to fetch and how often to fetch them. This allows users to customize the trade off between metric freshness and the cost of fetching the data.
Here's an example prometheus.yml configuration for the 4 endpoints used by this dashboard with some guidelines on scraping intervals.
scrape_configs:
# Base metrics contain key cluster and protocol stats
# Recommended scrape interval is >= 30s
- job_name: 'vast_base'
metrics_path: '/api/prometheusmetrics/'
scrape_interval: 30s
scrape_timeout: 20s
scheme: https
static_configs:
- targets: ['10.71.10.202:443']
tls_config:
insecure_skip_verify: true
basic_auth:
username: 'admin'
password: 'xxxxxx'
Device metrics can be data intensive for larger clusters
Recommended scrape interval is >= 60s
job_name: 'vast_devices'
metrics_path: '/api/prometheusmetrics/devices'
scrape_interval: 60s
scrape_timeout: 45s
scheme: https
static_configs:
- targets: ['10.71.10.202:443']
tls_config:
insecure_skip_verify: true
basic_auth:
username: 'admin'
password: 'xxxxxx'
View metrics can be data intensive for clusters with many views
Recommended scrape interval is >= 60s
job_name: 'vast_views'
metrics_path: '/api/prometheusmetrics/views'
scrape_interval: 60s
scrape_timeout: 45s
scheme: https
static_configs:
- targets: ['10.71.10.202:443']
tls_config:
insecure_skip_verify: true
basic_auth:
username: 'admin'
password: 'xxxxxx'
User metrics can be data intensive for clusters with many users
Recommended scrape interval is >= 60s
job_name: 'vast_users'
metrics_path: '/api/prometheusmetrics/users'
scrape_interval: 60s
scrape_timeout: 45s
scheme: https
static_configs:
- targets: ['10.71.10.202:443']
tls_config:
insecure_skip_verify: true
basic_auth:
username: 'admin'
password: 'xxxxxx'
Data source config
Collector config:
Upload an updated version of an exported dashboard.json file from Grafana
| Revision | Description | Created | |
|---|---|---|---|
| Download |