
Monitoring Golden Signals for Kubernetes
This comprehensive Grafana dashboard provides a detailed view of the key metrics that can be categorized under the Four Golden Signals: Latency, Traffic, Errors, and Saturation. Designed for quick issue identification, this dashboard offers real-time insights into the performance and health of your Kubernetes cluster. Ideal for DevOps teams and SREs, this dashboard is your go-to resource for proactive Kubernetes cluster management.
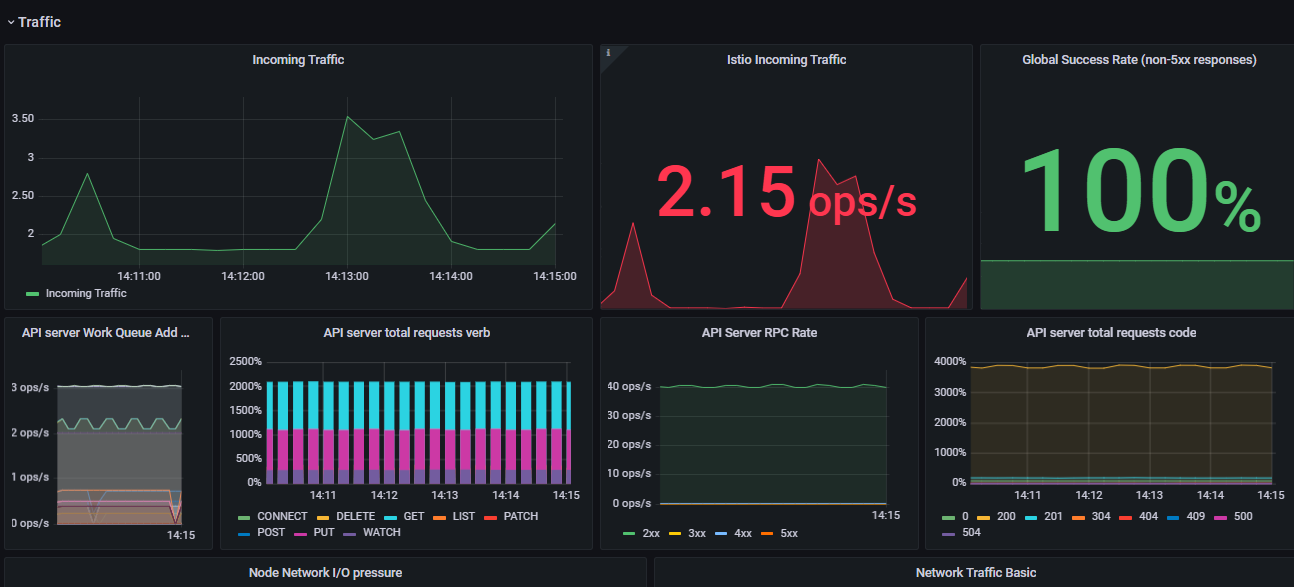
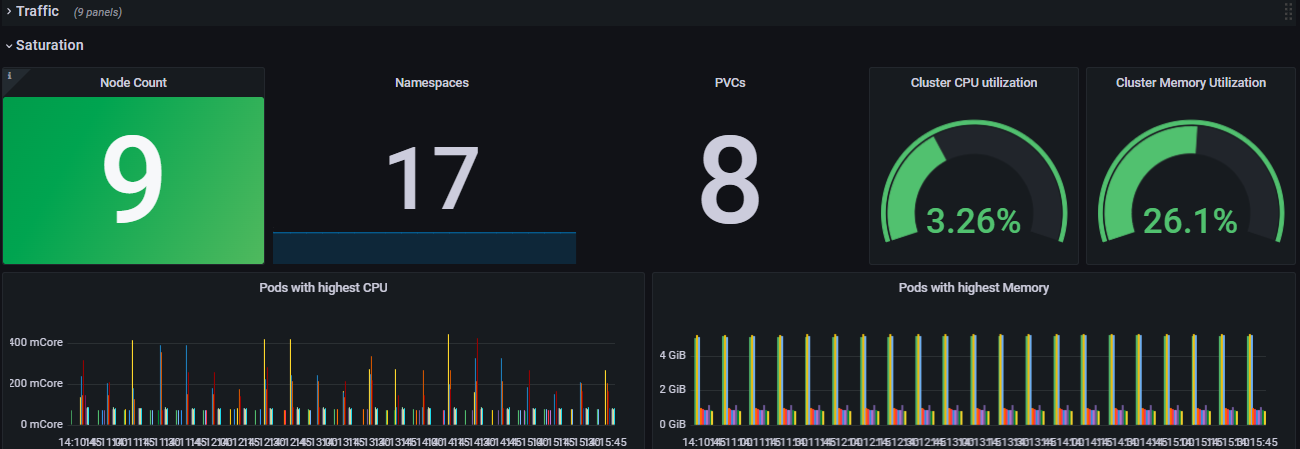
The Monitoring Golden Signals for Kubernetes dashboard uses the prometheus data source to create a Grafana dashboard with the barchart, gauge, stat, table and timeseries panels.
Data source config
Collector type:
Collector plugins:
Collector config:
Revisions
Upload an updated version of an exported dashboard.json file from Grafana
| Revision | Description | Created | |
|---|---|---|---|
| Download |
Kubernetes
Monitor your Kubernetes deployment with prebuilt visualizations that allow you to drill down from a high-level cluster overview to pod-specific details in minutes.
Learn more