Windows Monitoring
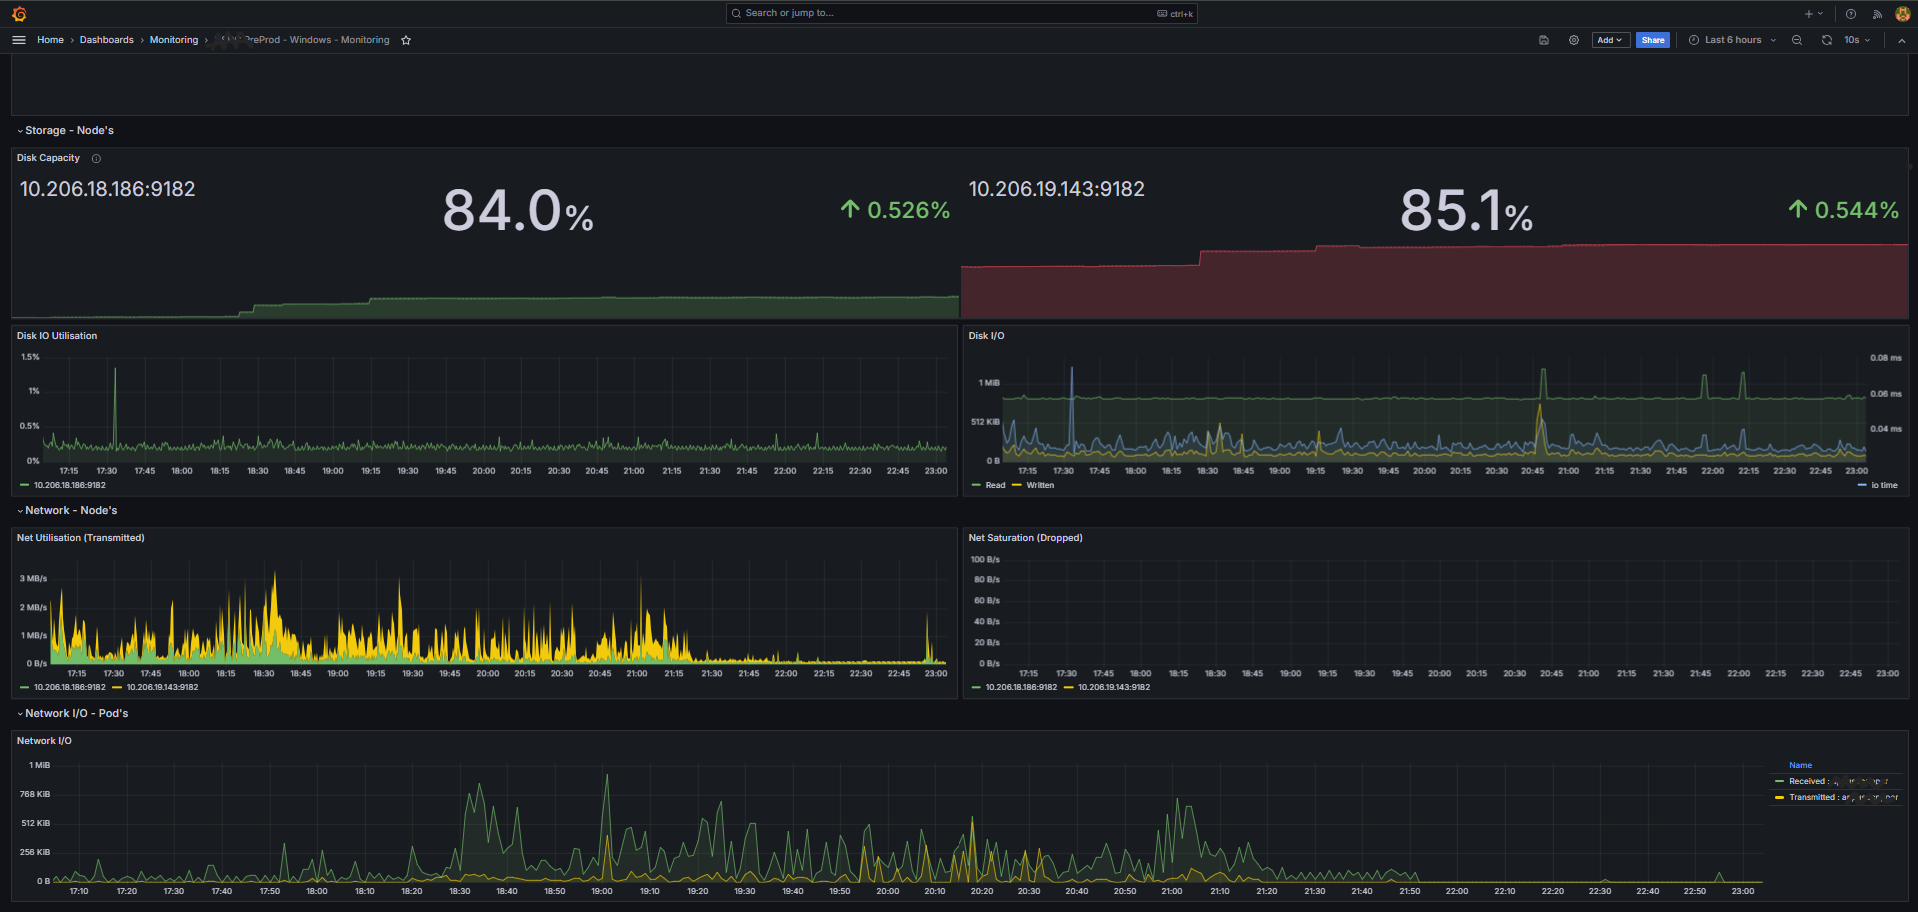
This Grafana dashboard offers a detailed overview of the performance and resource utilization of Windows nodes in a Kubernetes cluster. It includes metrics for CPU, memory, storage, and network usage at the node, namespace, and pod levels, facilitating efficient monitoring and troubleshooting.
The provided Grafana dashboard offers a detailed and comprehensive view of the performance and resource utilization of your Windows nodes in a Kubernetes cluster. Here's a more precise description of each section:
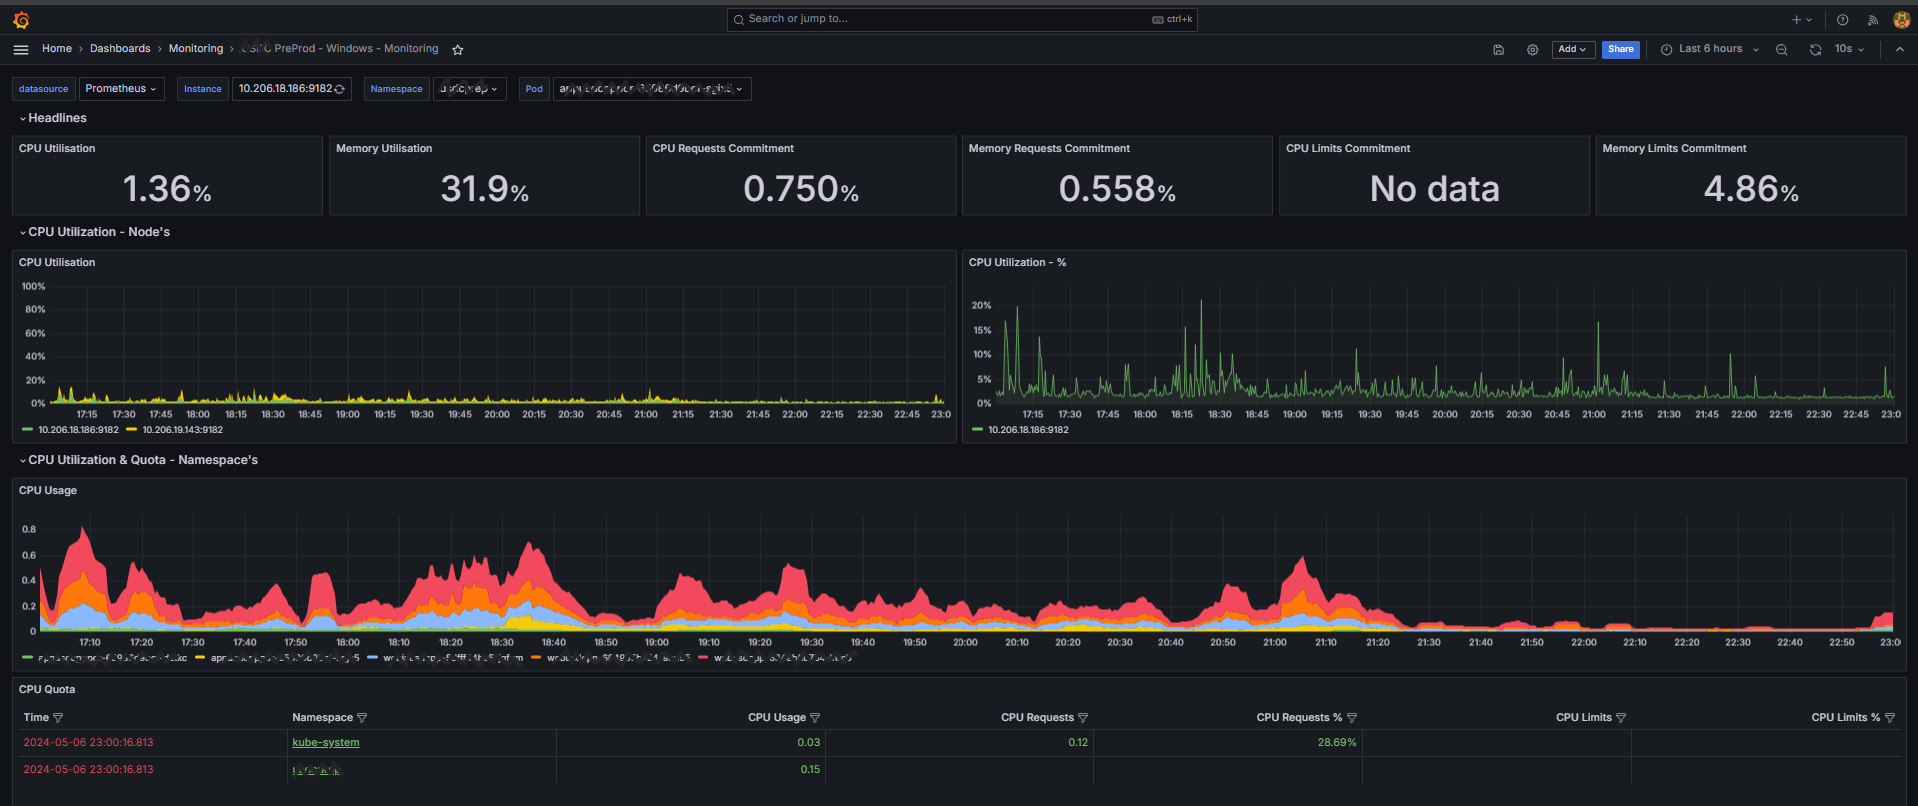
Headlines: This section provides a high-level snapshot of the Namespace, including metrics such as CPU Utilization, Memory Utilization, CPU Requests and Limits, and Memory Requests and Limits.
CPU Utilization - Nodes: This section displays the CPU utilization for each node in the cluster, helping you understand the extent of CPU resource usage and identify nodes that might be under heavy load.
CPU Utilization & Quota - Namespaces: This section presents the CPU utilization and quota for each namespace, helping you understand the CPU resources consumed by each namespace and identify any namespaces that are nearing their quota. This includes metrics for CPU usage, requests, and limits. Additionally, it provides metrics for maximum and average CPU utilization, offering a more comprehensive view of CPU usage patterns.
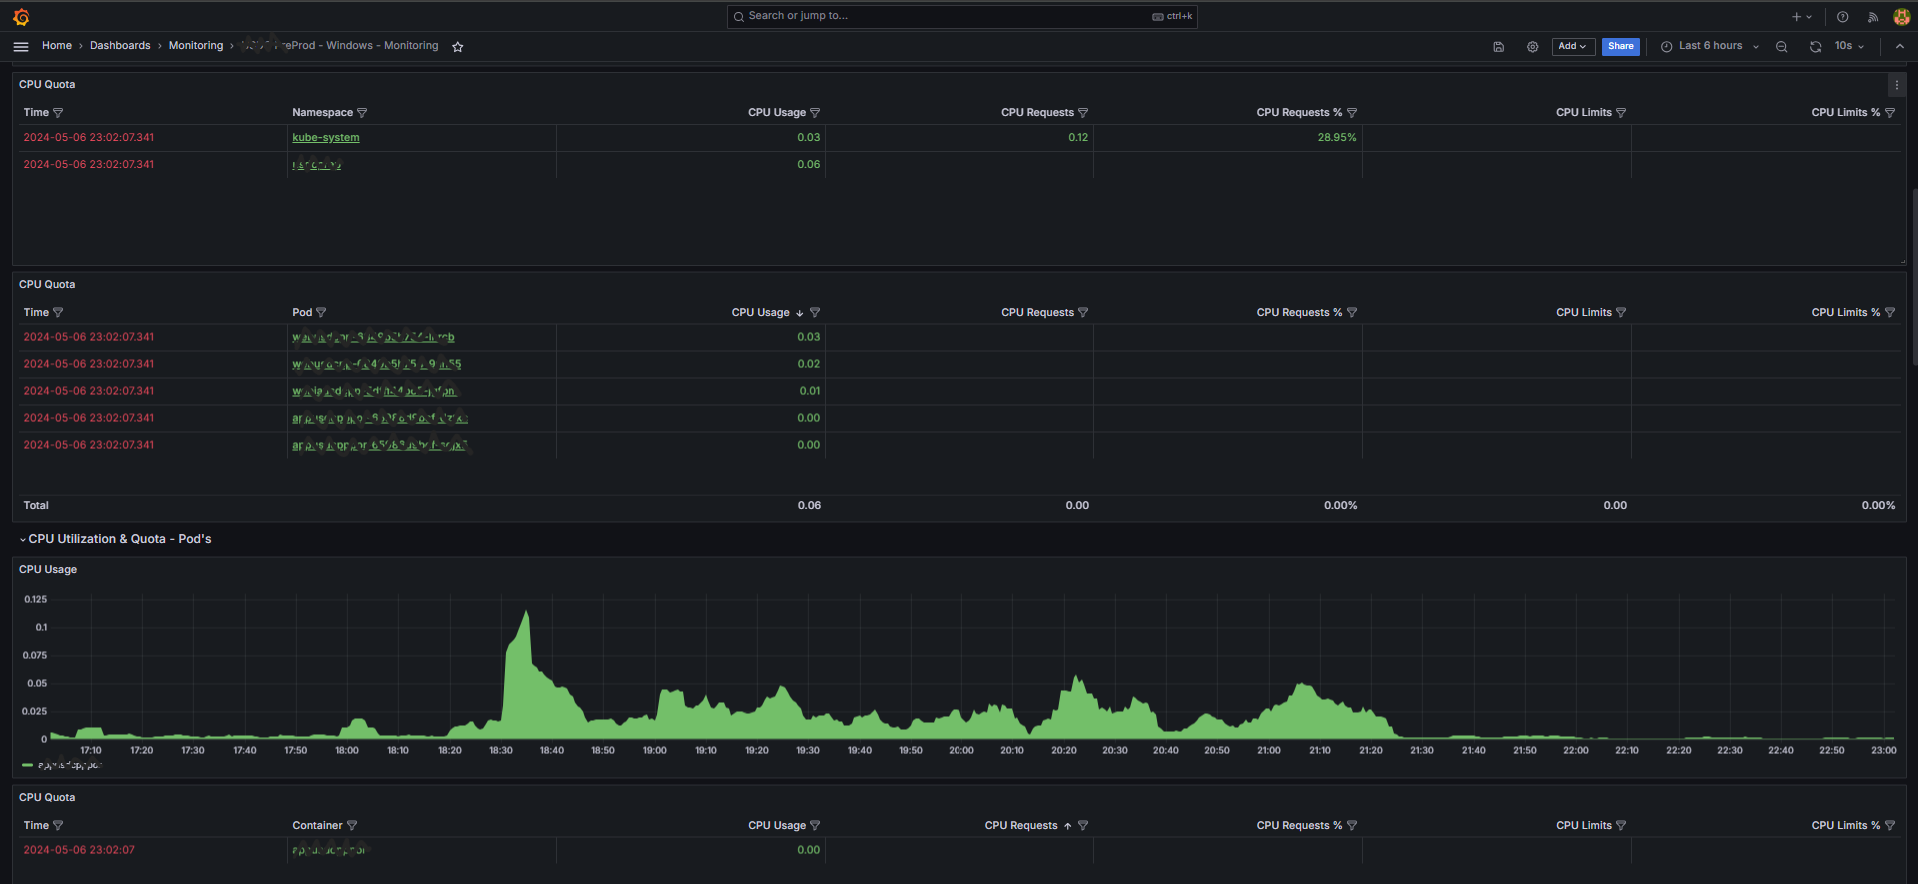
CPU Utilization & Quota - Pods: This section displays the CPU utilization and quota for each pod, helping you understand the CPU resources consumed by each pod and identify any pods that are nearing their quota. This includes metrics for CPU usage, requests, and limits.
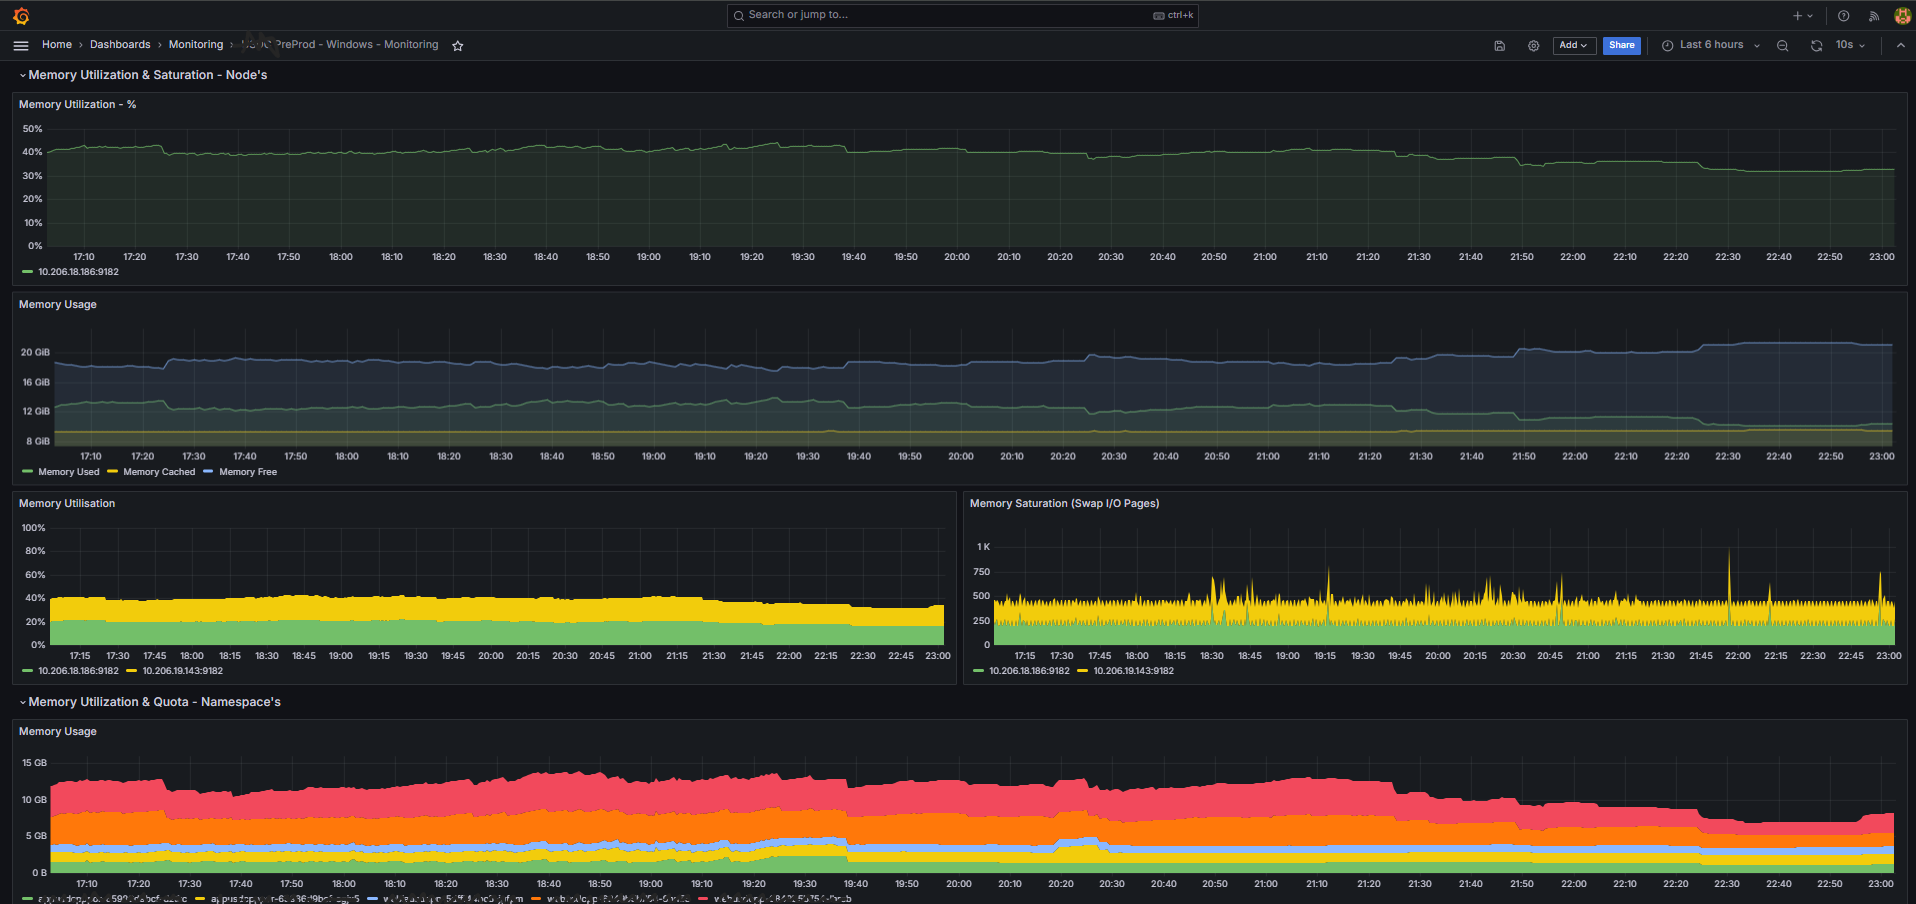
Memory Utilization & Saturation - Nodes: This section presents the memory utilization and saturation for each node, helping you understand the extent of memory resource usage and identify nodes that might be running out of memory. This includes metrics for memory used, available, and freed.
Memory Utilization & Quota - Namespaces: This section displays the memory utilization and quota for each namespace, helping you understand the memory resources consumed by each namespace and identify any namespaces that are nearing their quota. This includes metrics for memory usage, requests, and limits. Additionally, it provides metrics for maximum and average memory usage, offering a more comprehensive view of memory usage patterns.
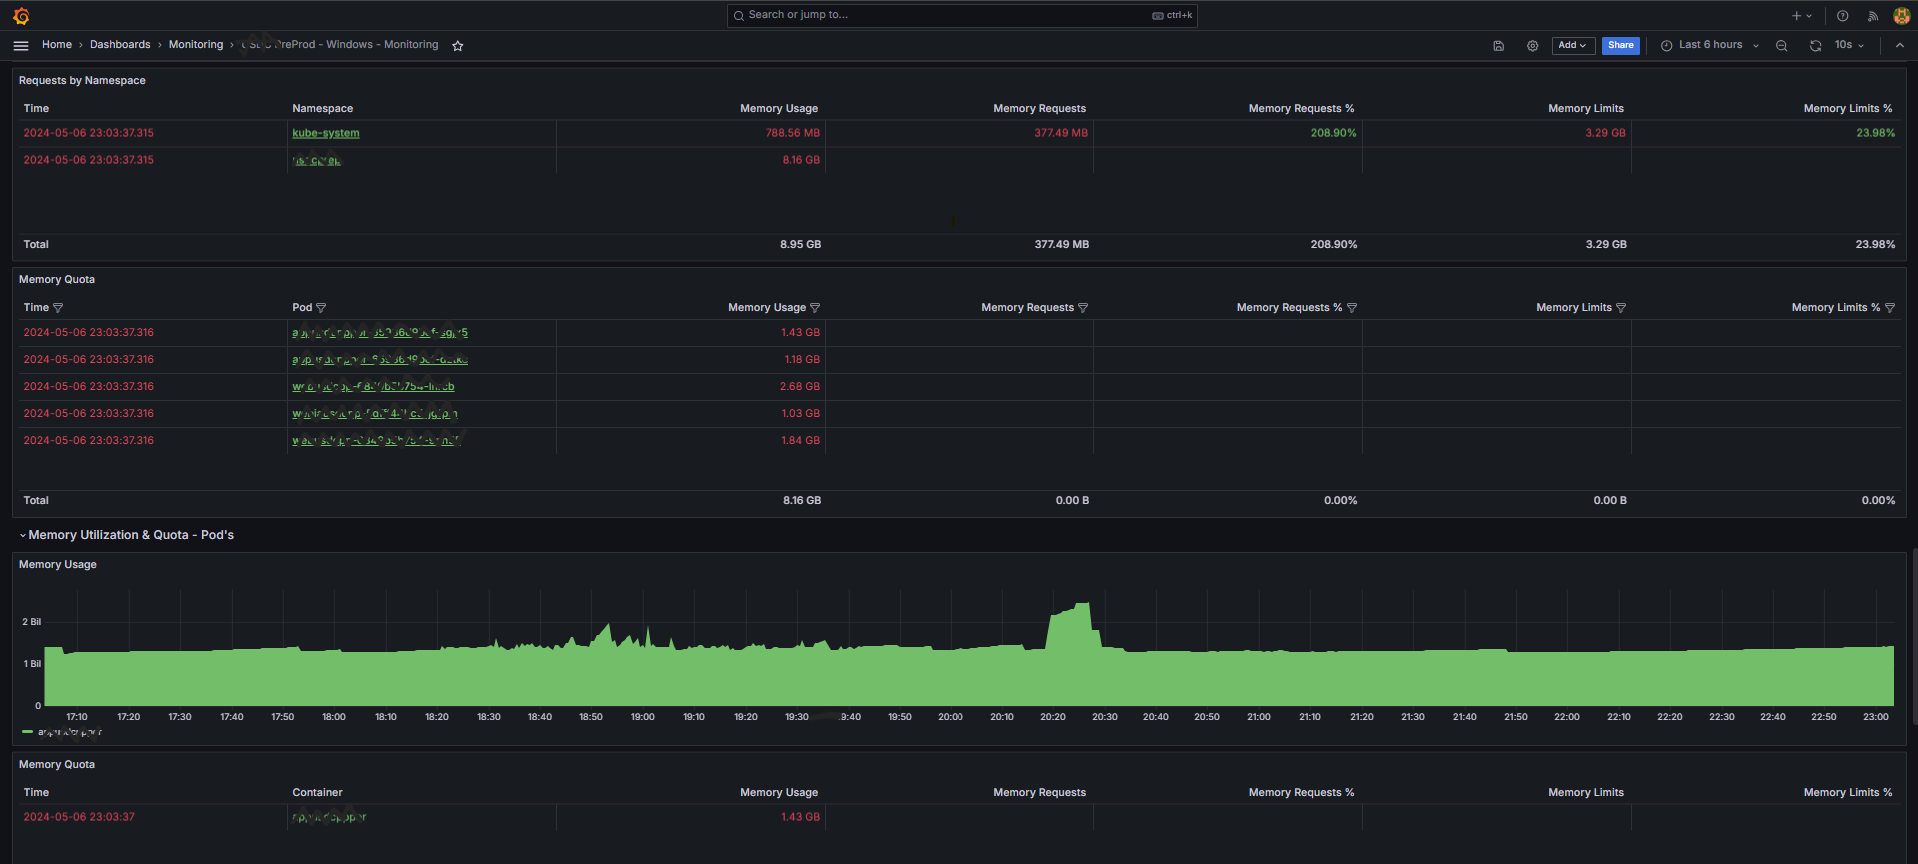
Memory Utilization & Quota - Pods: This section presents the memory utilization and quota for each pod, helping you understand the memory resources consumed by each pod and identify any pods that are nearing their quota.
Storage - Nodes: This section displays the storage usage for each node, helping you understand the extent of storage resource usage and identify nodes that might be running out of storage. This includes metrics for disk capacity, disk I/O utilization, and disk I/O read/write operations.
Network - Nodes: This section presents the network usage for each node, helping you understand the extent of network resource usage and identify nodes that might be experiencing high network traffic. This includes metrics for network transmitted and dropped packets.
Network I/O - Pods: This section displays the network input/output for each pod, helping you understand the extent of network traffic generated or consumed by each pod. This includes metrics for network transmitted and dropped packets.
This dashboard provides a comprehensive view of your cluster's performance and resource utilization, making it easier to monitor and troubleshoot issues. To visualize all the panels present in the dashboard, it's crucial to use the Windows Exporter, as it provides the necessary metrics for monitoring and troubleshooting.
Data source config
Collector config:
Upload an updated version of an exported dashboard.json file from Grafana
| Revision | Description | Created | |
|---|---|---|---|
| Download |
Windows
Easily monitor your deployment of the Windows operating system with Grafana Cloud's out-of-the-box monitoring solution.
Learn more
