
Spring Boot HTTP
Spring Boot (Micrometer) with HTTP requests.
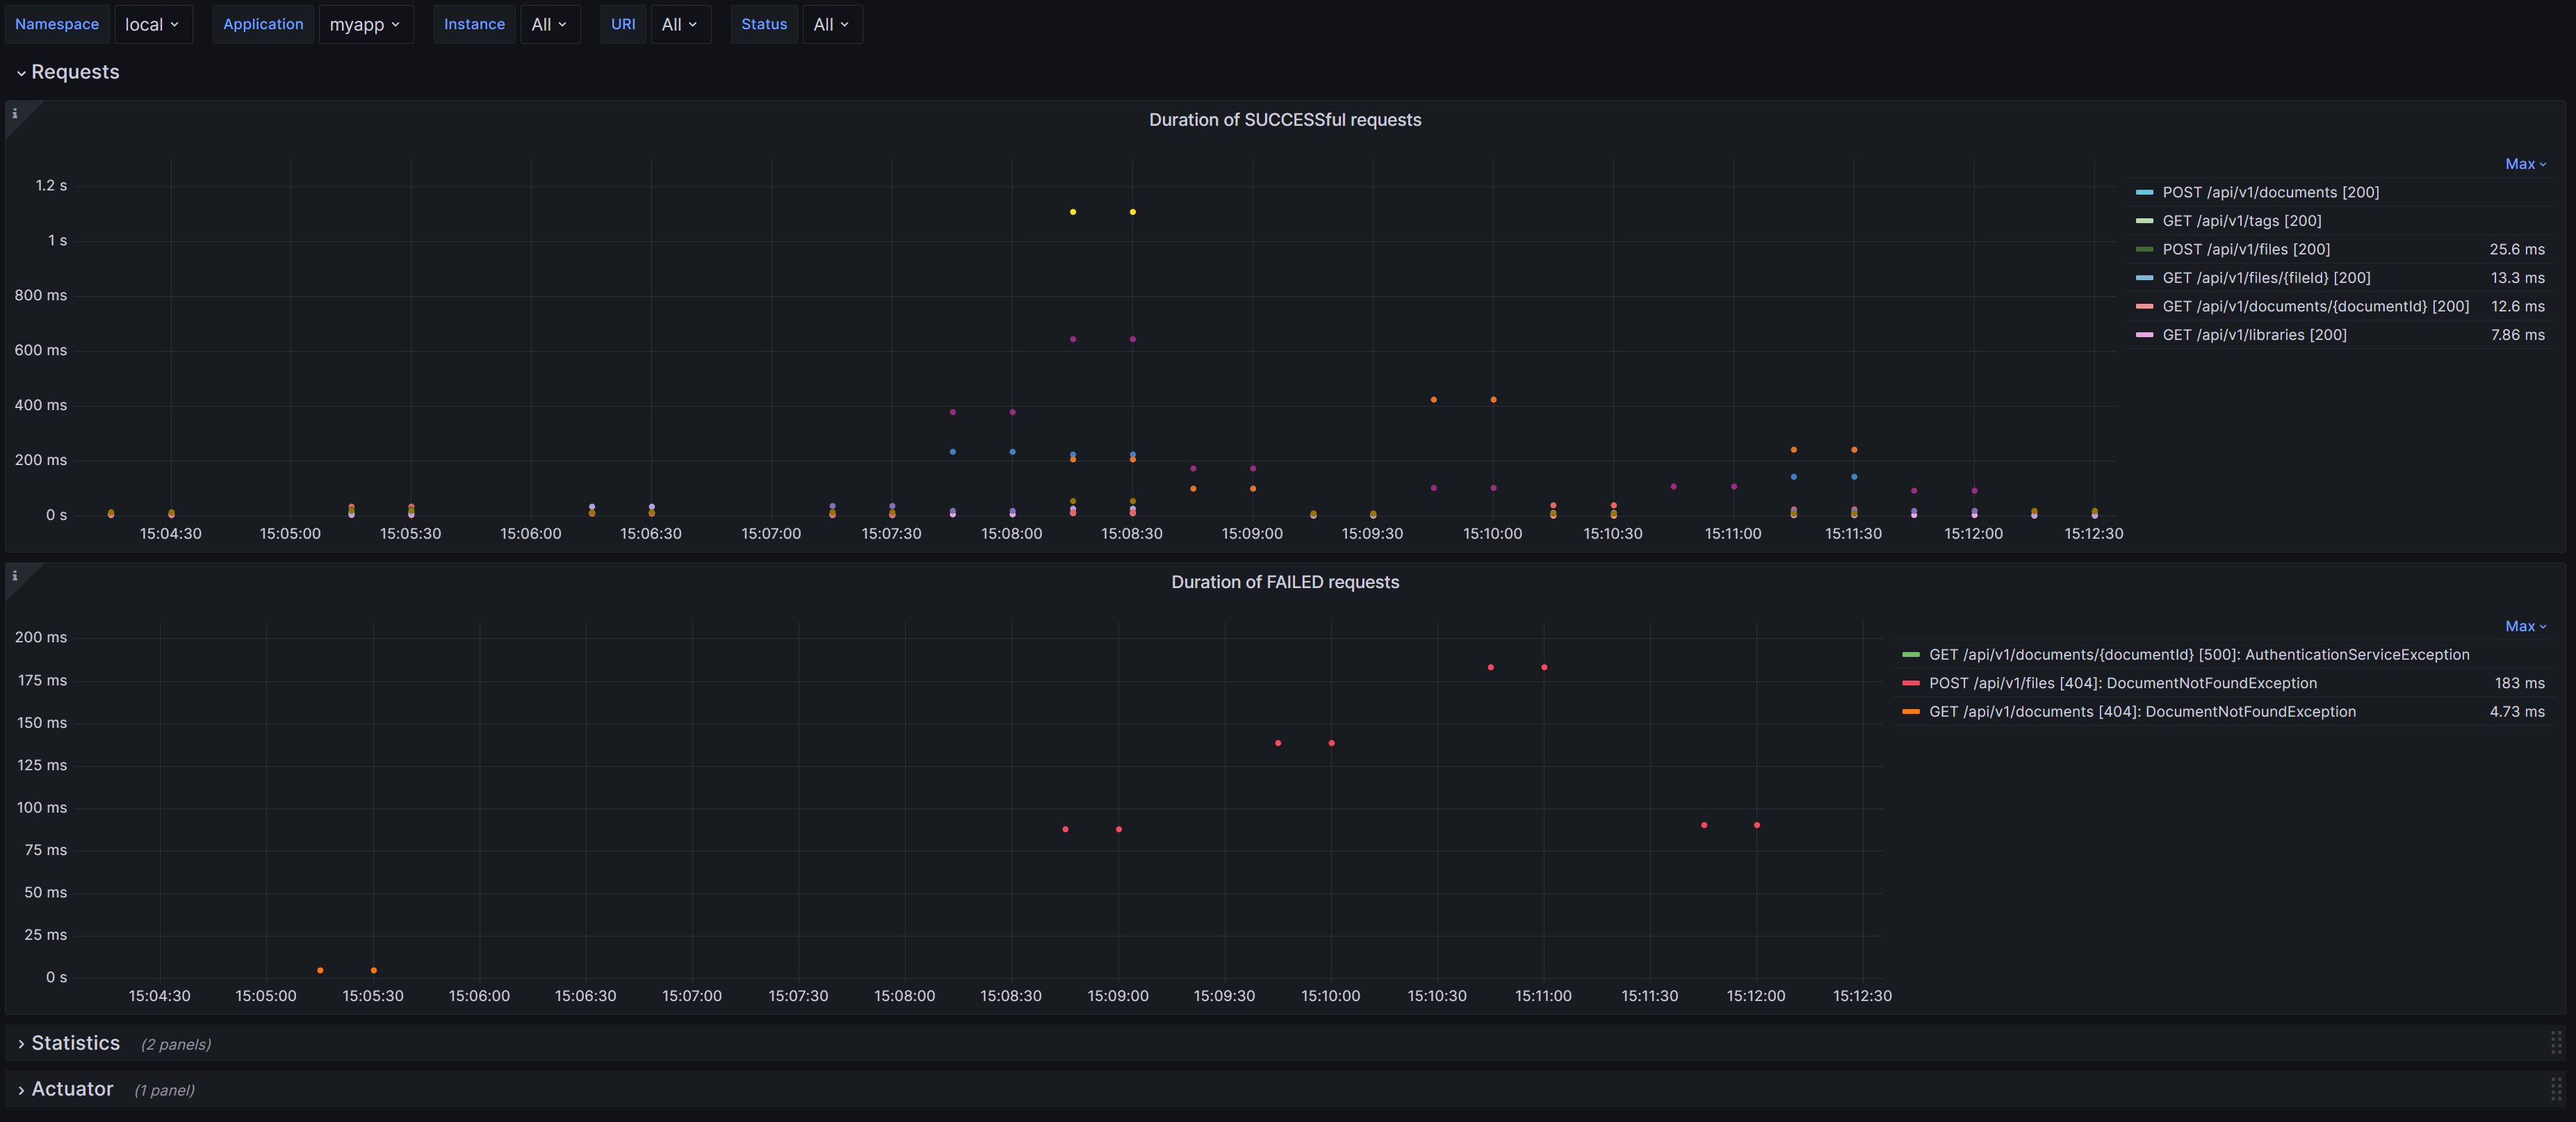
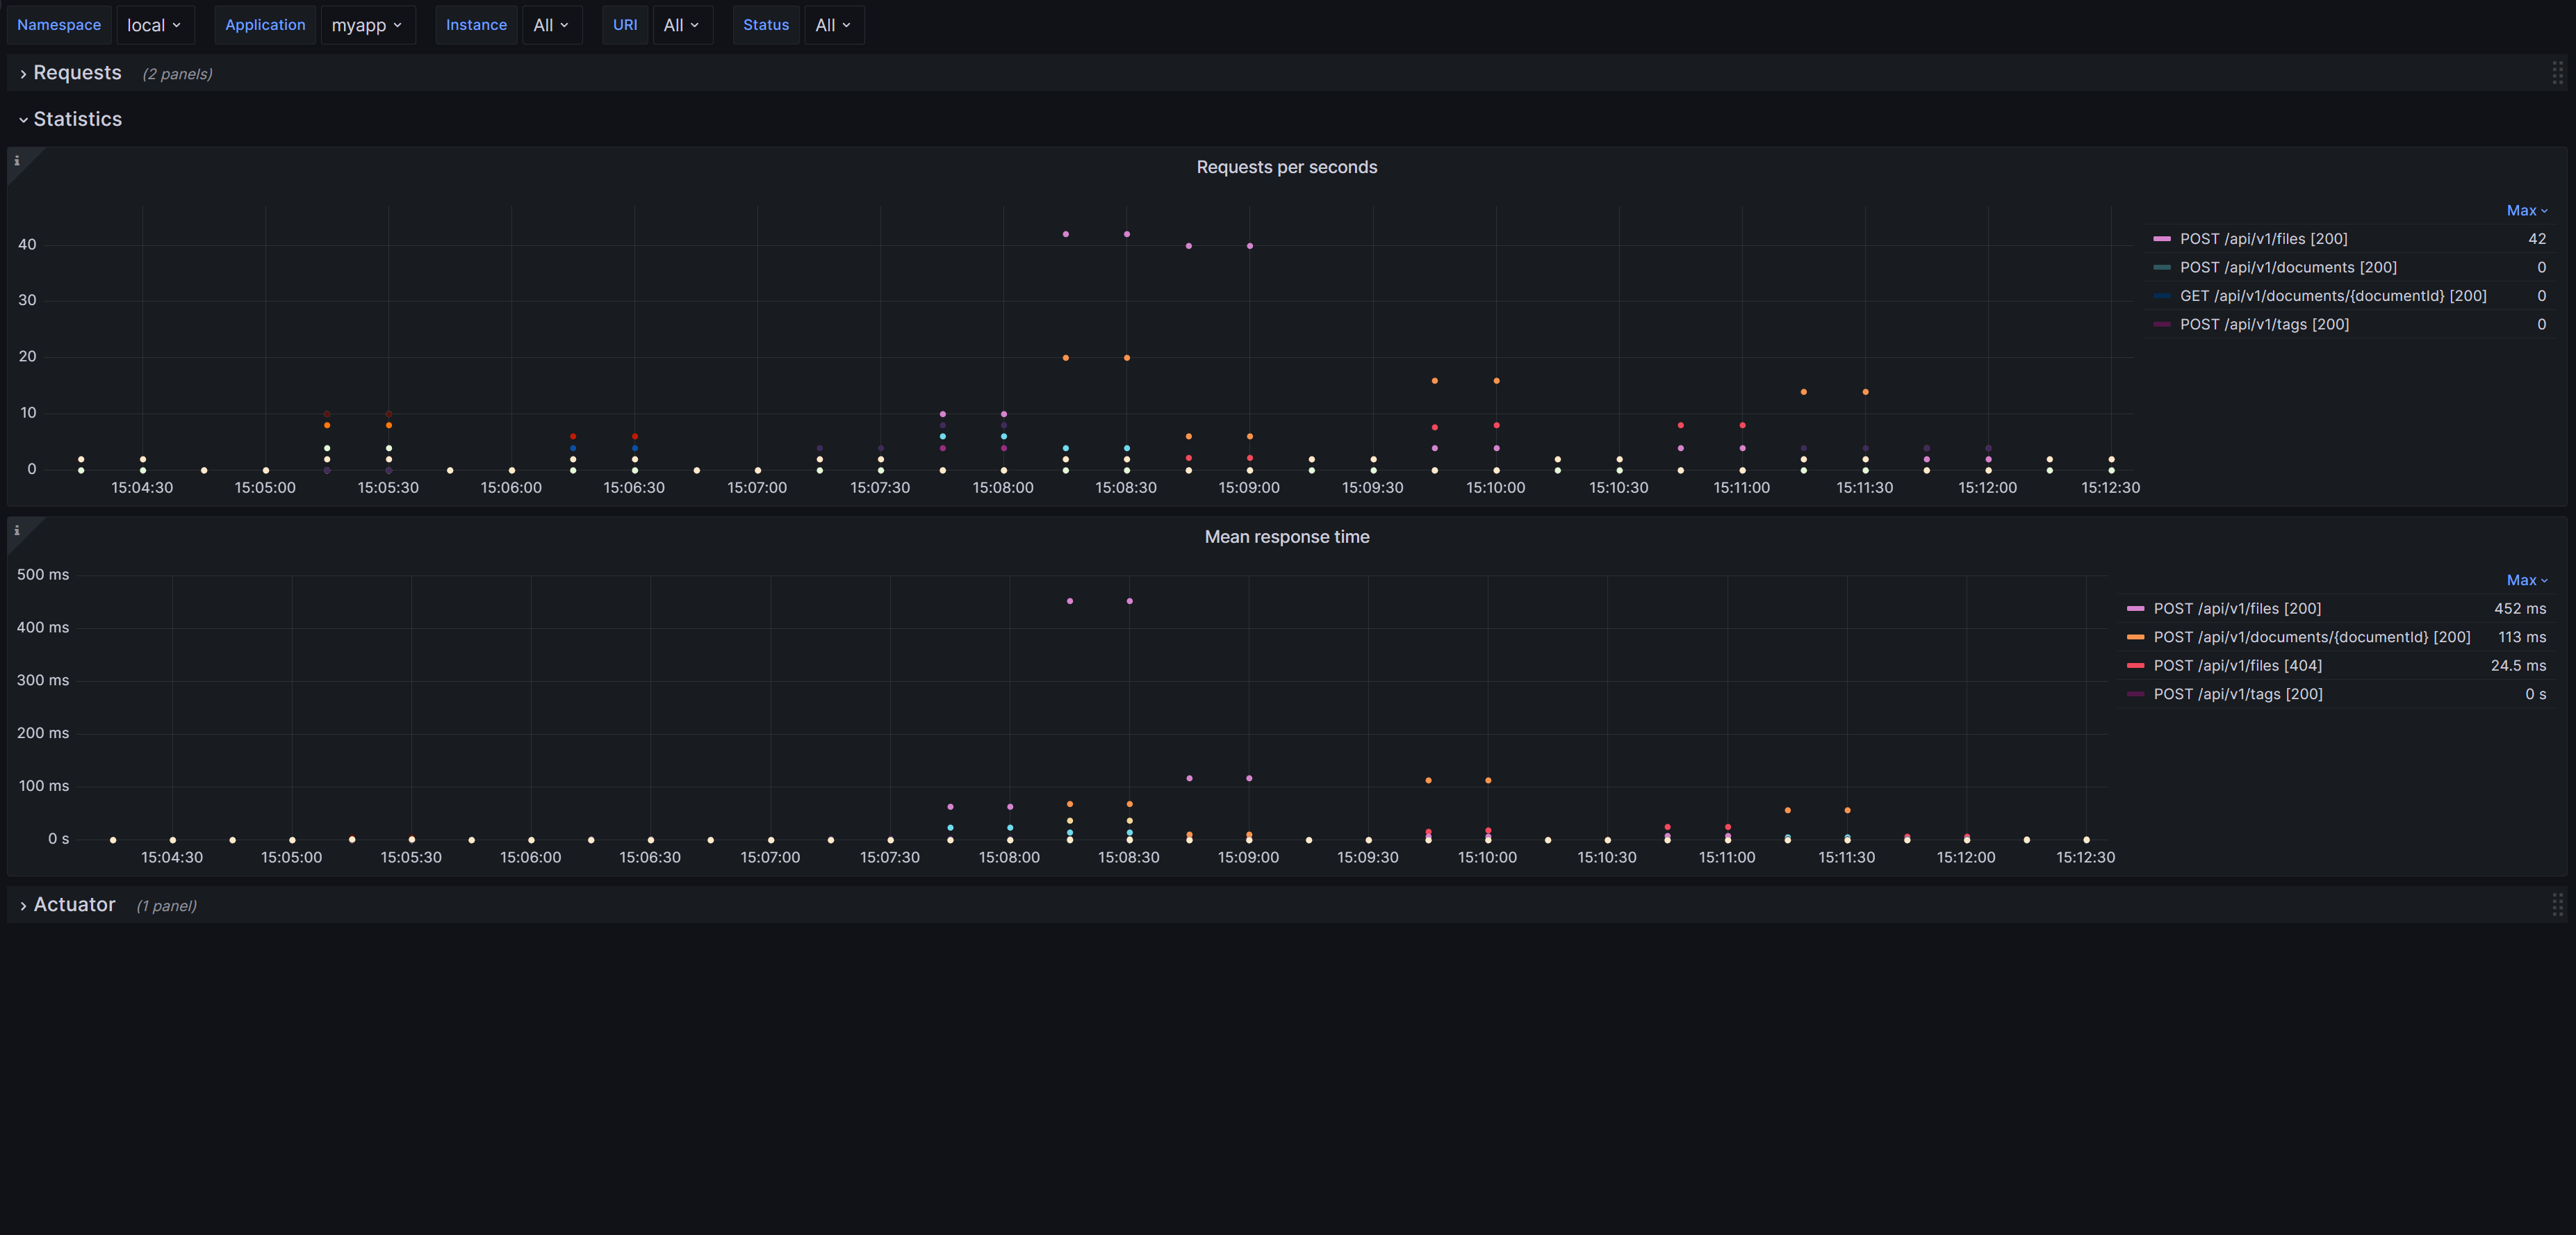
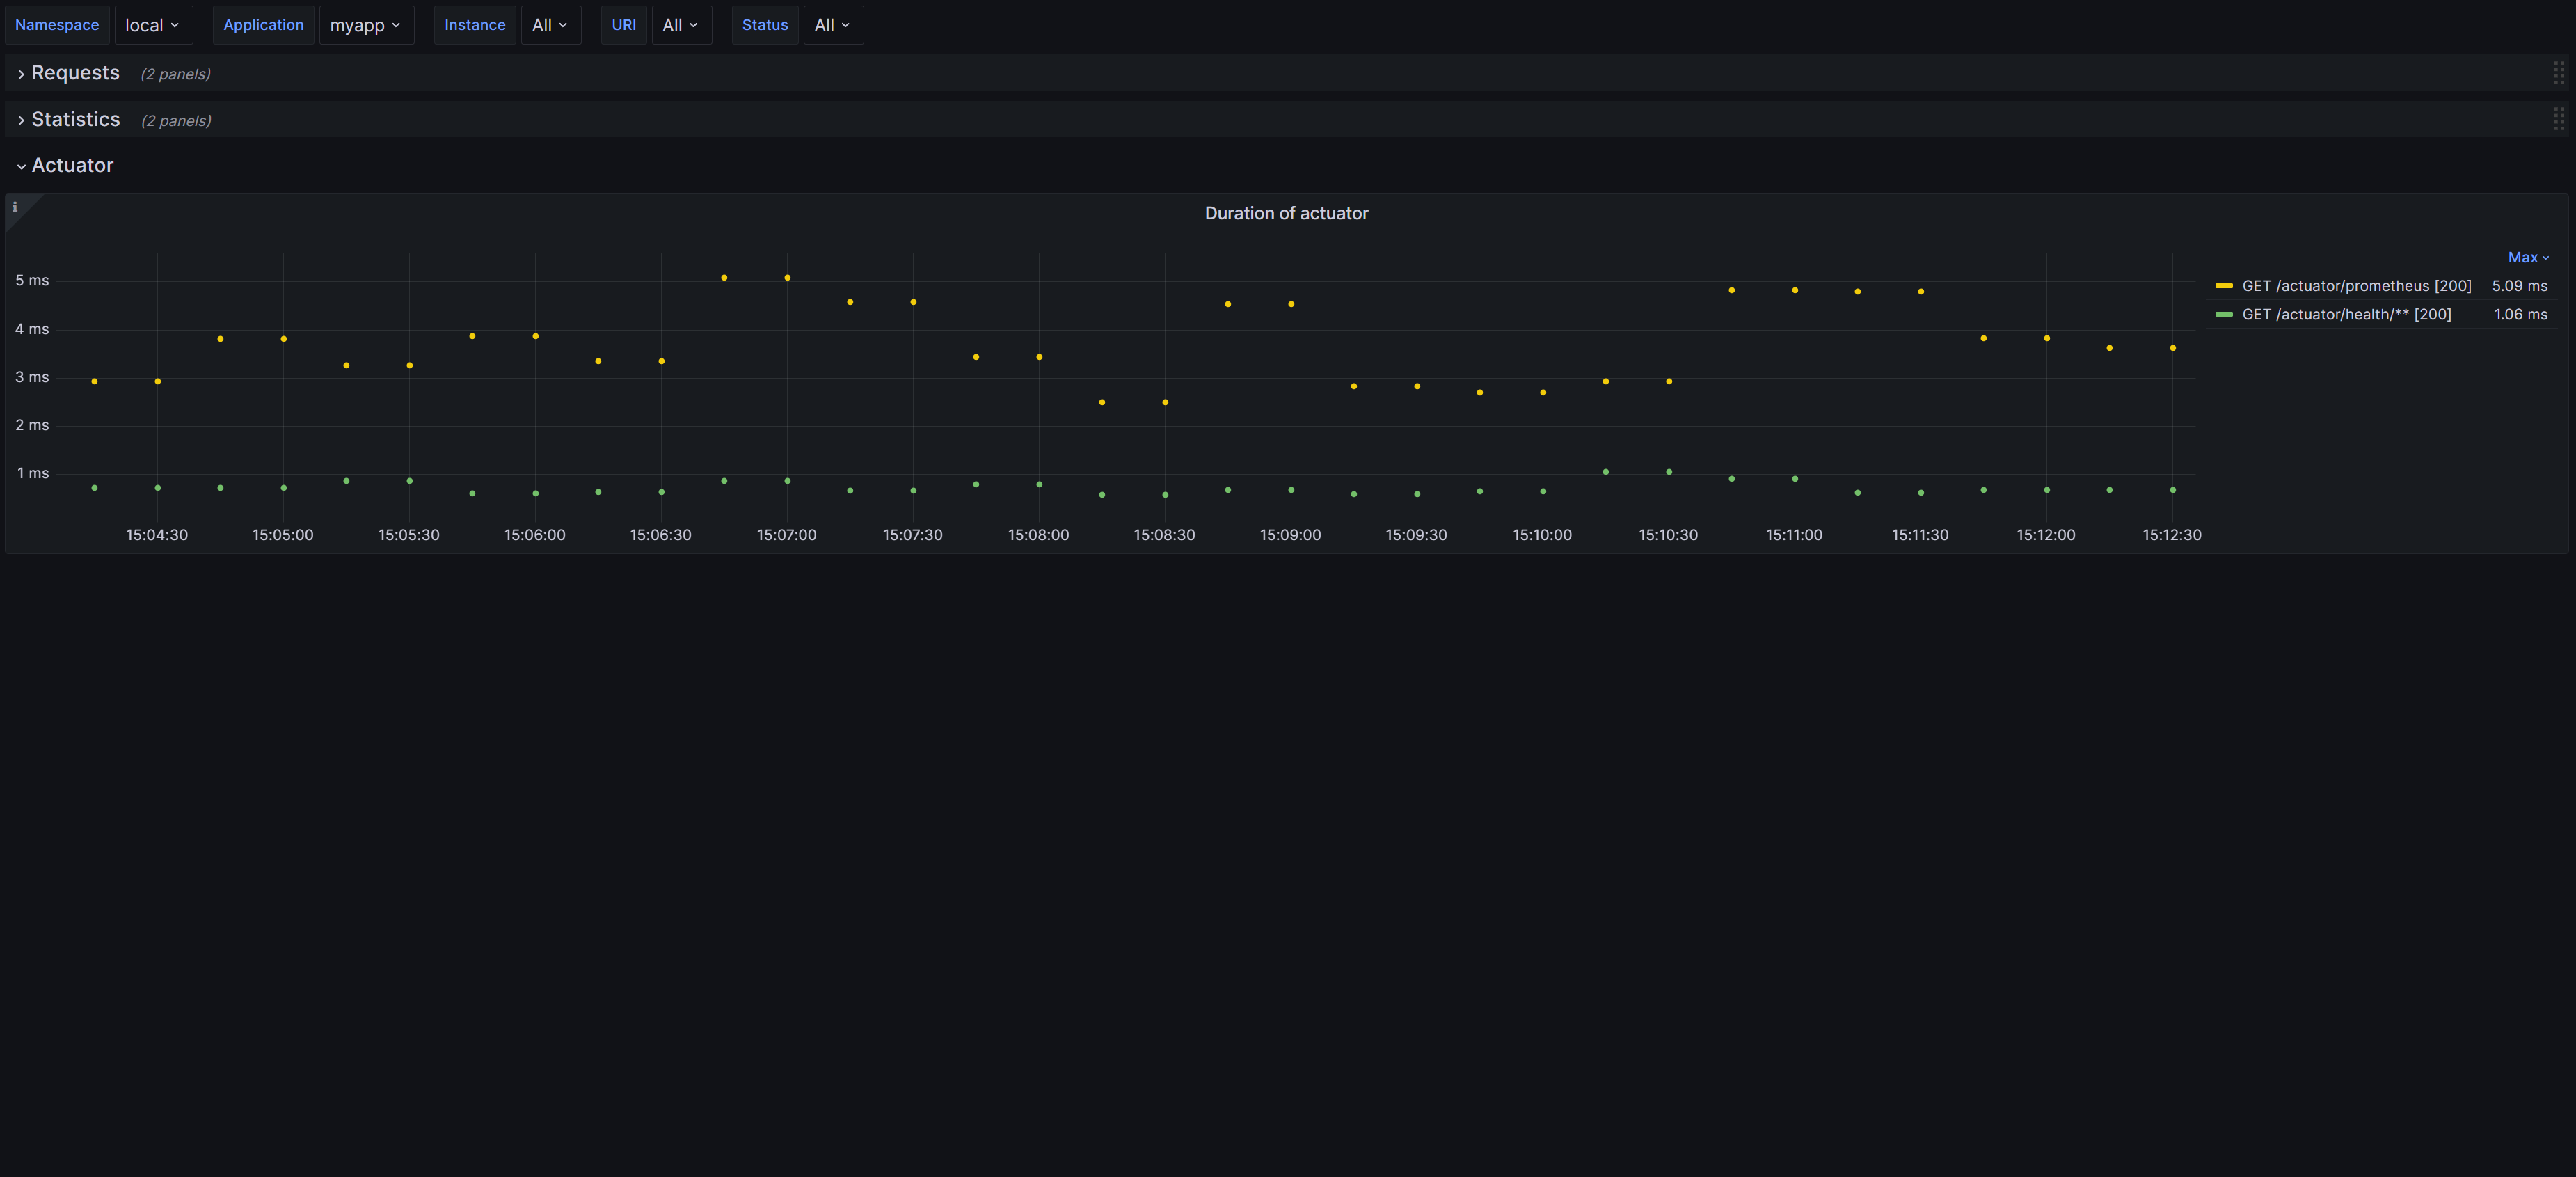
Grafana Dashboard of Spring Boot (by Micrometer metrics from Prometheus) for HTTP requests.
Supported Spring Boot 3.x.
See details in GitHub.
Data source config
Collector type:
Collector plugins:
Collector config:
Revisions
Upload an updated version of an exported dashboard.json file from Grafana
| Revision | Description | Created | |
|---|---|---|---|
| Download |
Apache HTTP Server
Easily monitor Apache HTTP Server, an open source HTTP server for modern operating systems including UNIX and Windows, with Grafana Cloud's out-of-the-box monitoring solution.
Learn more