
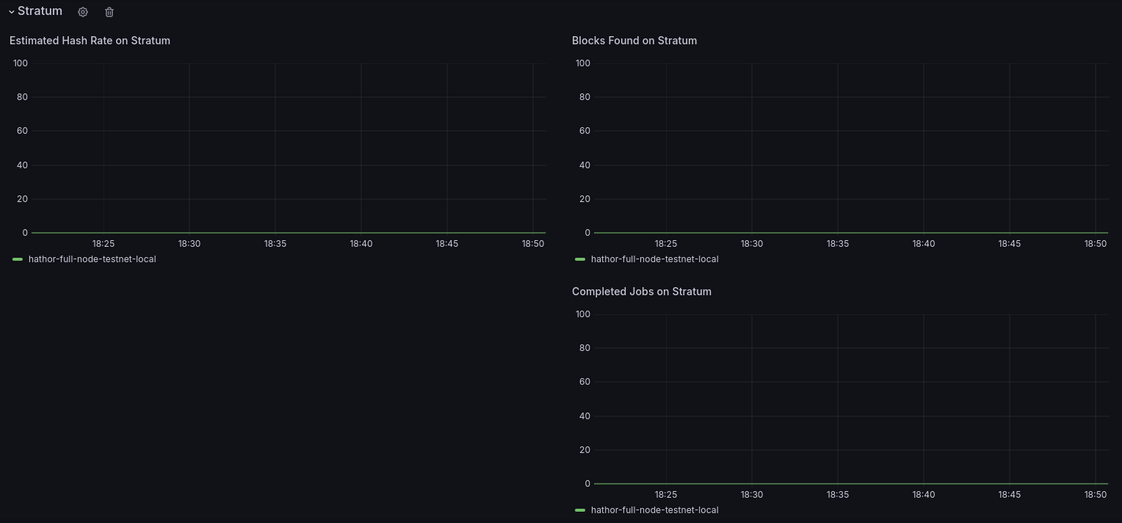
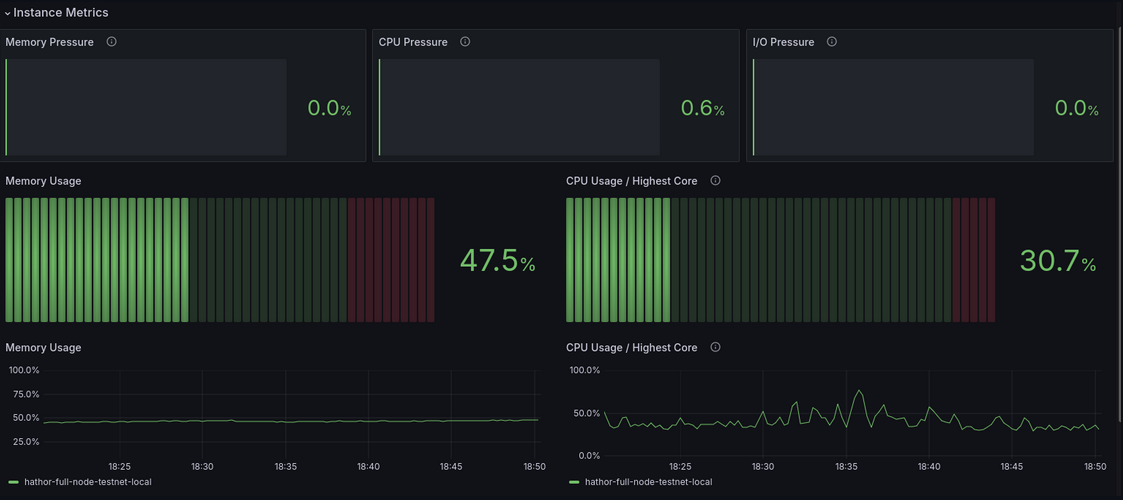
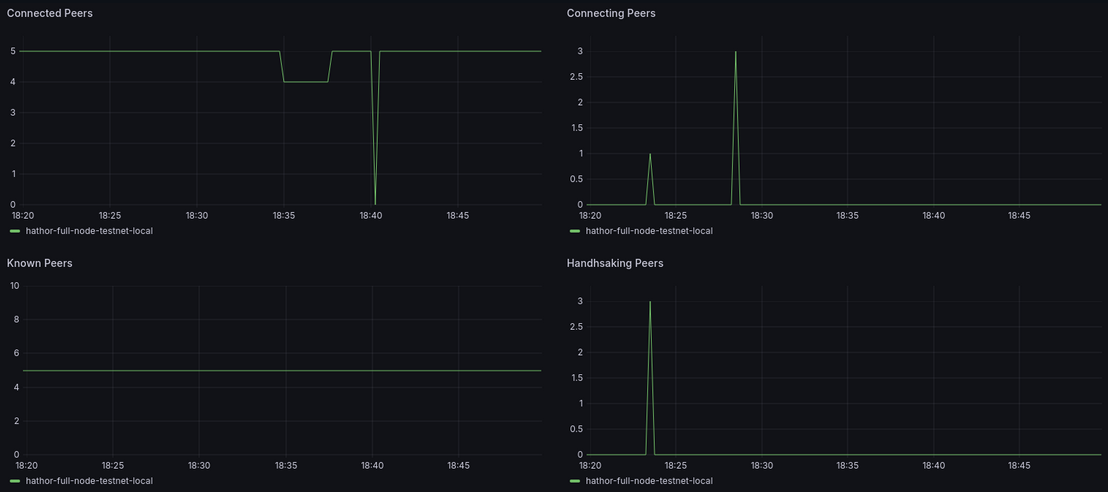
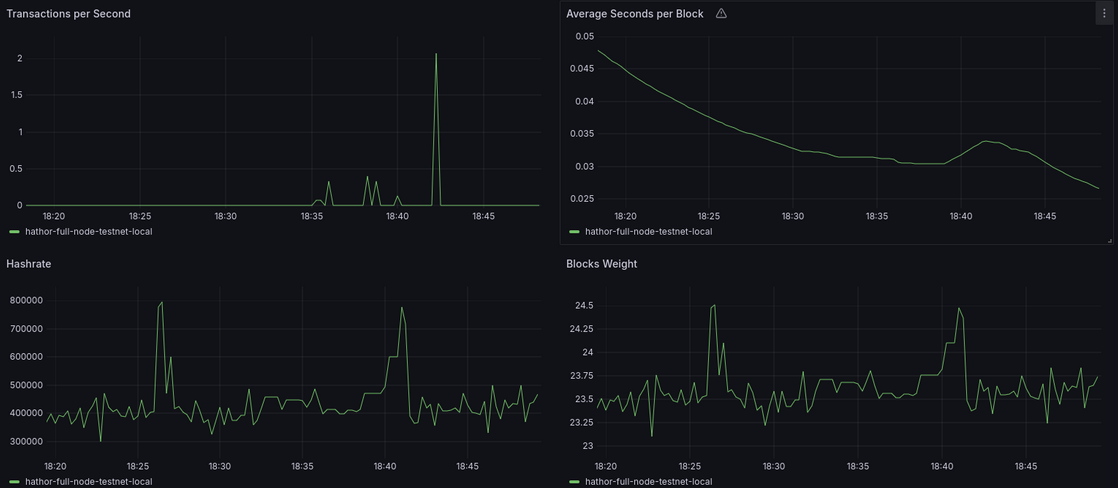
Hathor Fullnodes
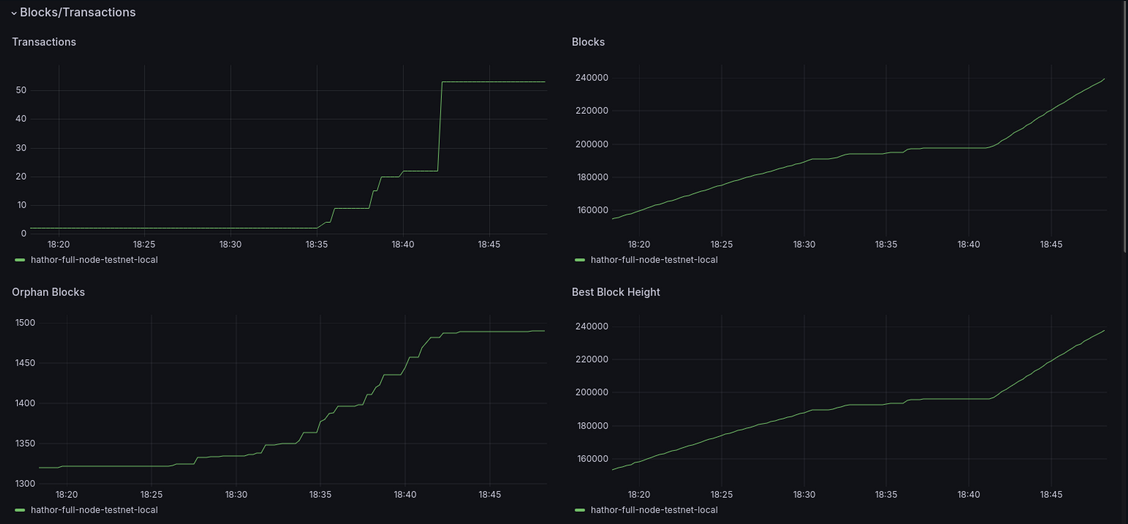
Visualize metrics generated by hathor core fullnodes
This is an example docker-compose.yml file showcasing how you can run a hathor-core fullnode together with node-exporter for metric collection.
You can use it to reproduce the same behavior in any other kind of environment you run your fullnodes. More info about running hathor-core fullnodes can be found in https://docs.hathor.network/
This example assumes you have a hathor-core folder in the same directly as the docker-compose.yml file.
The metrics will be available at localhost:9100/metrics, and should be collected by a Prometheus instance (not showcased here) used as Datasource for this dashboard.
version: '3'
services:
node_exporter:
image: quay.io/prometheus/node-exporter:latest
container_name: node_exporter
command:
- '–path.rootfs=/host'
- '–collector.textfile.directory=/host/data/prometheus'
ports:
- "9100:9100"
pid: host
restart: unless-stopped
volumes:
- ./hathor-core:/host:ro,rslave
networks:
- monitoring
hathor-core:
image: hathornetwork/hathor-core
command: run_node
ports:
- "8000:8000"
- "8001:8001"
volumes:
- ./hathor-core/data:/data
environment:
HATHOR_TESTNET: 'true'
HATHOR_STATUS: '8000'
HATHOR_STRATUM: '8001'
HATHOR_WALLET_INDEX: 'true'
HATHOR_CACHE: 'true'
HATHOR_CACHE_SIZE: '100000'
HATHOR_DATA: /data
HATHOR_PROMETHEUS: 'true'
HATHOR_PROMETHEUS_PREFIX: 'hathor_core:'
networks:
monitoring:
Data source config
Collector config:
Upload an updated version of an exported dashboard.json file from Grafana
| Revision | Description | Created | |
|---|---|---|---|
| Download |