
OpenTelemetry JVM Micrometer
OpenTelemetry JVM Micrometer using RED and USE method
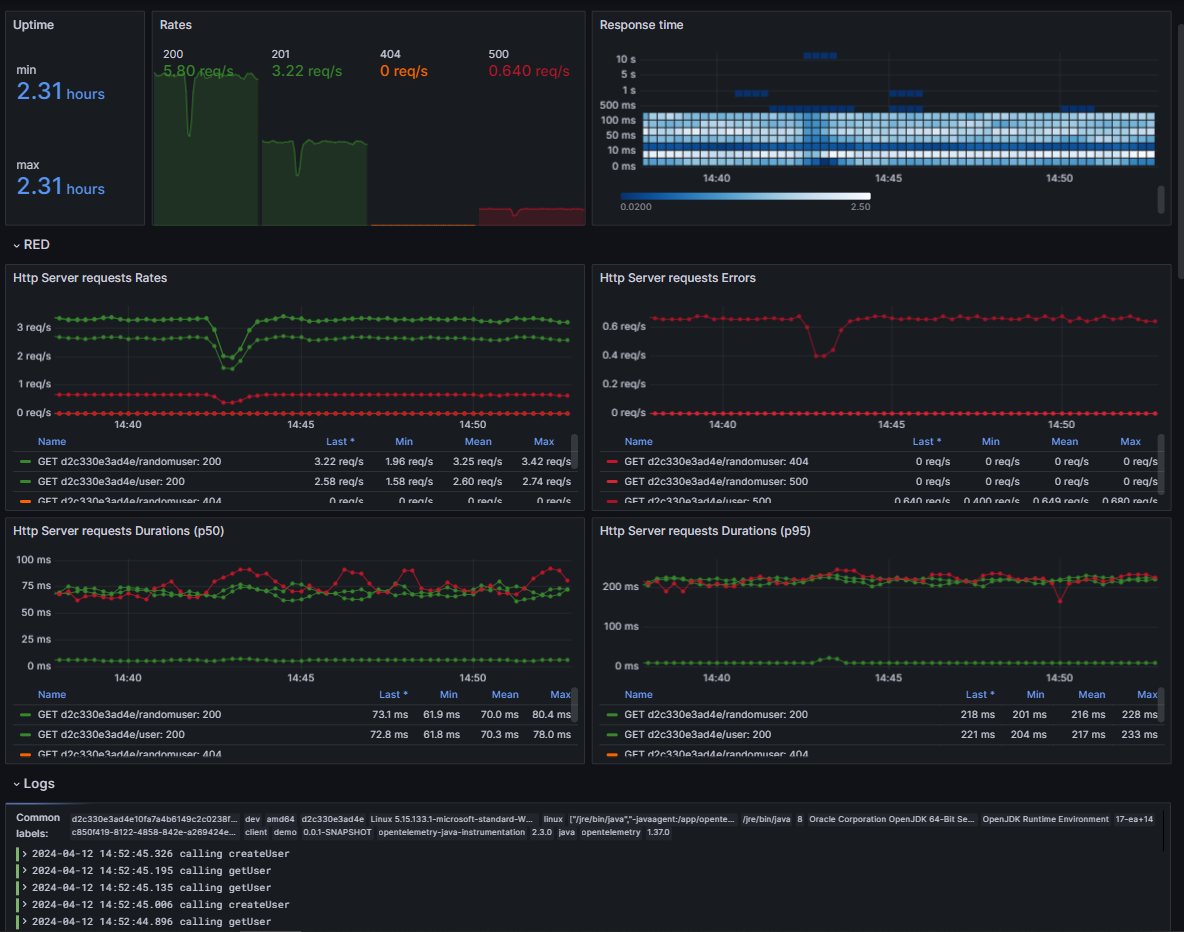


OpenTelemetry JVM Spring Boot dashboard

Metrics are sent via micrometer-otlp. Logs are sent via the opentelemetry exporter.
This dashboard has been built by following:
Blog post with live demo
A complete live demo and blog post with docker compose is available at github.
Stats
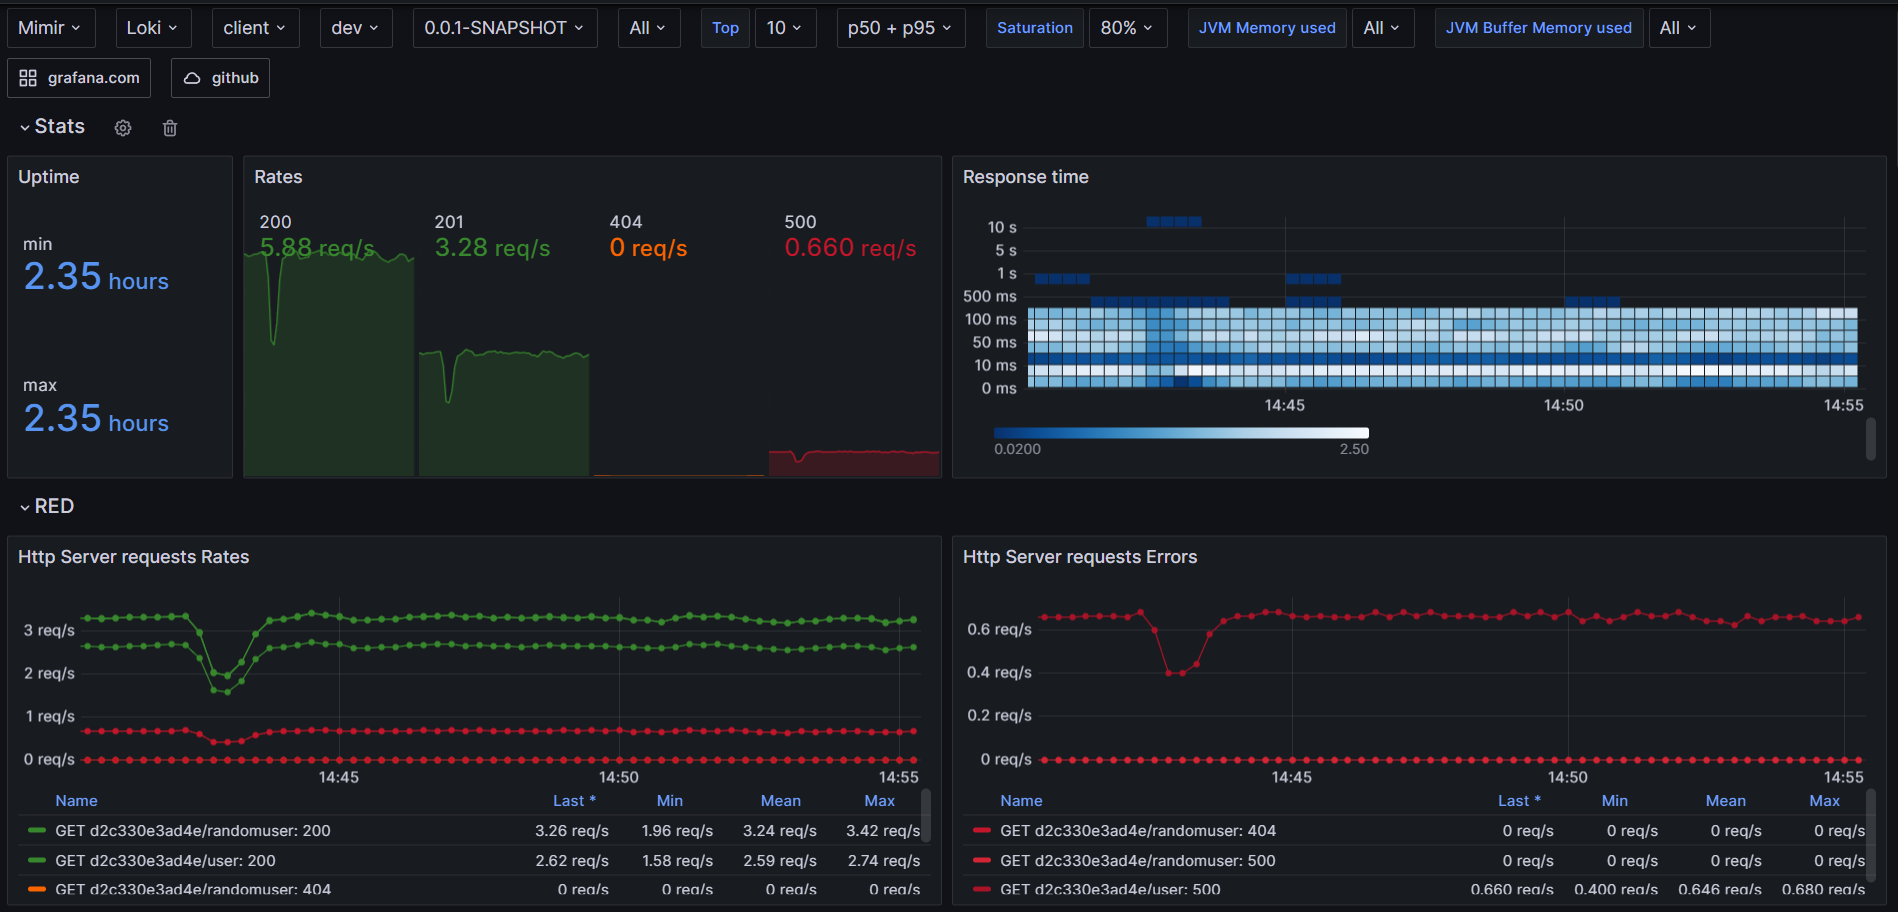
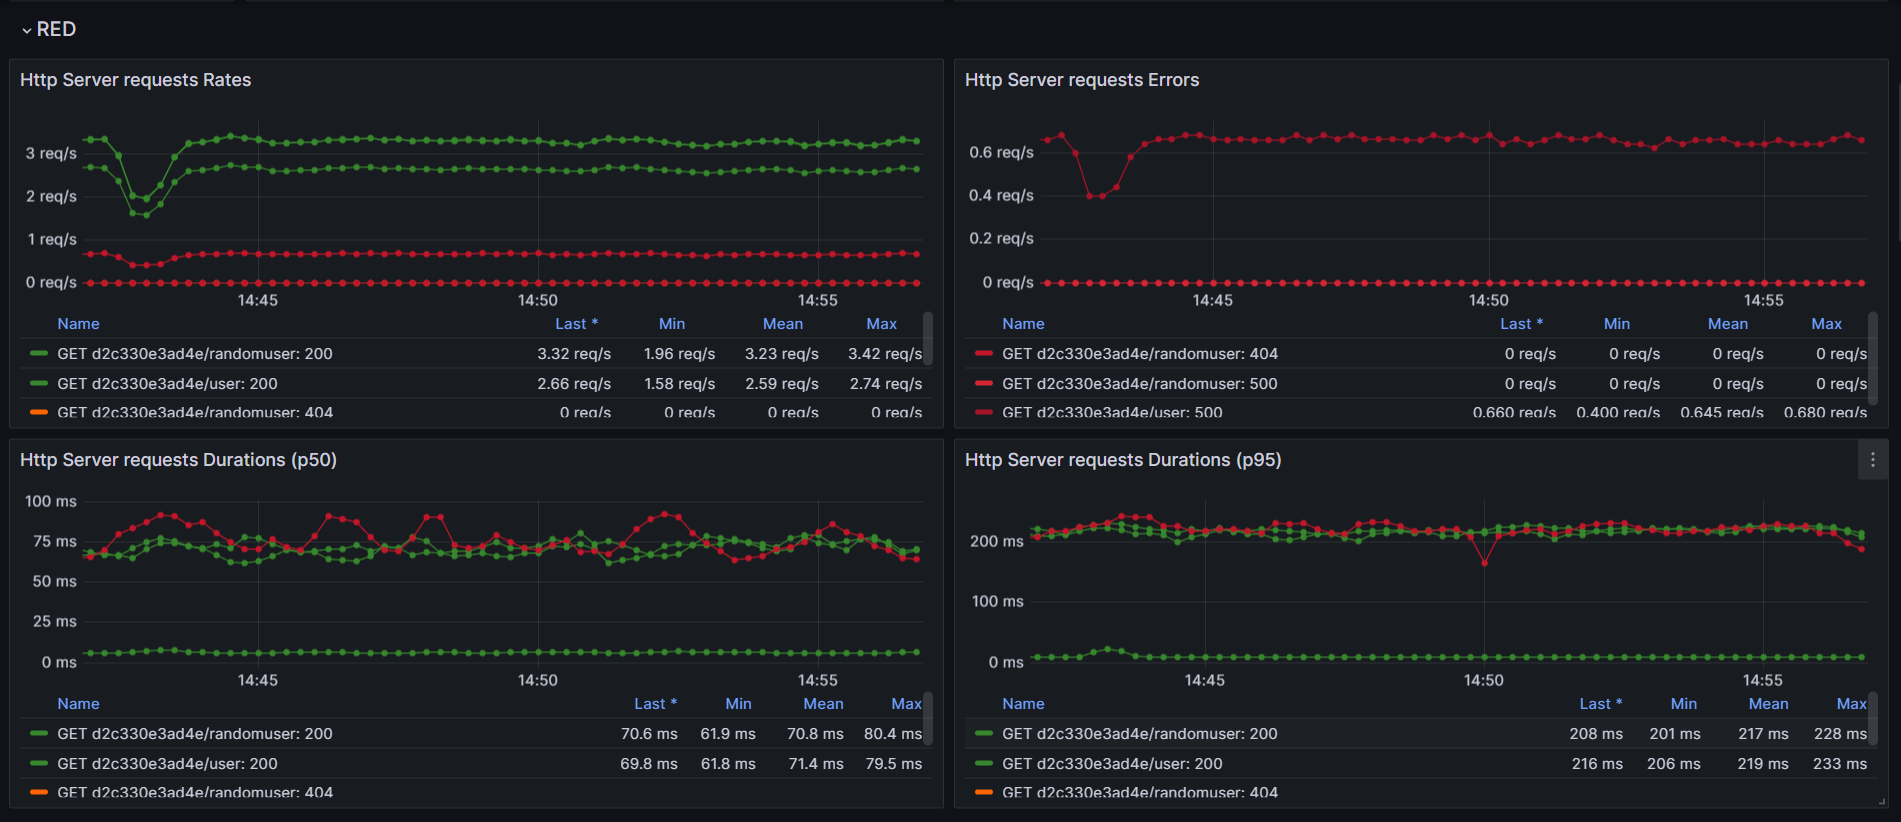
RED
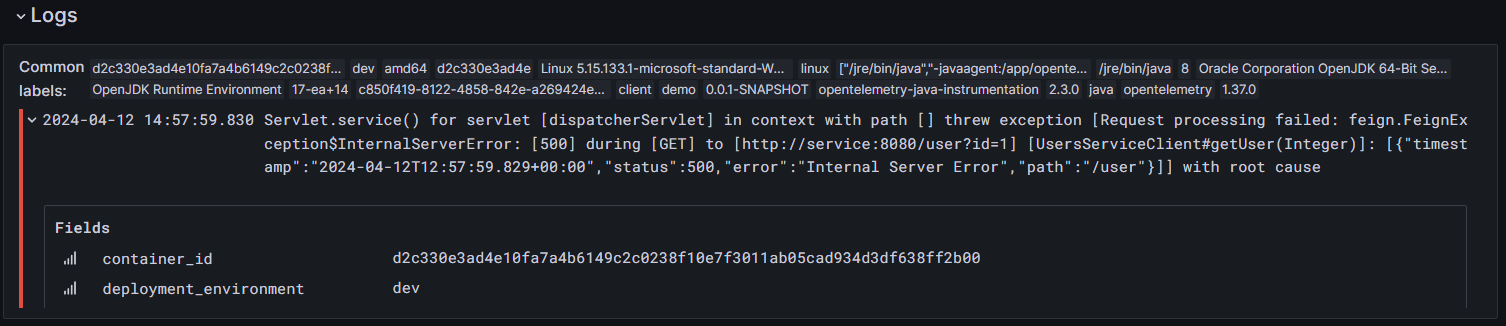
Logs

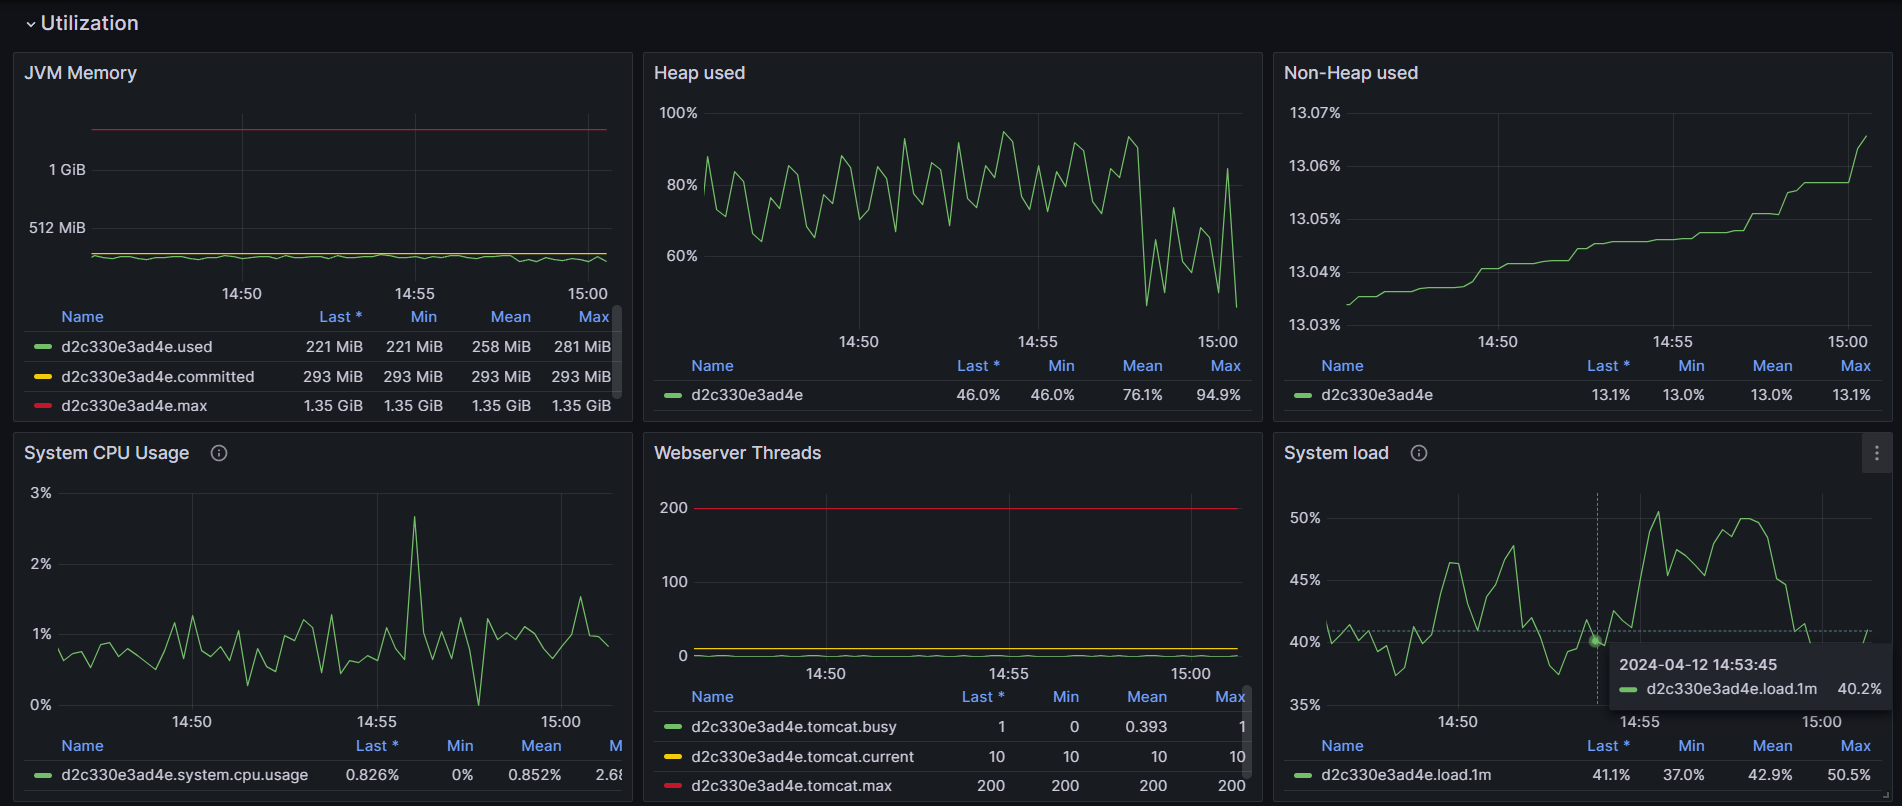
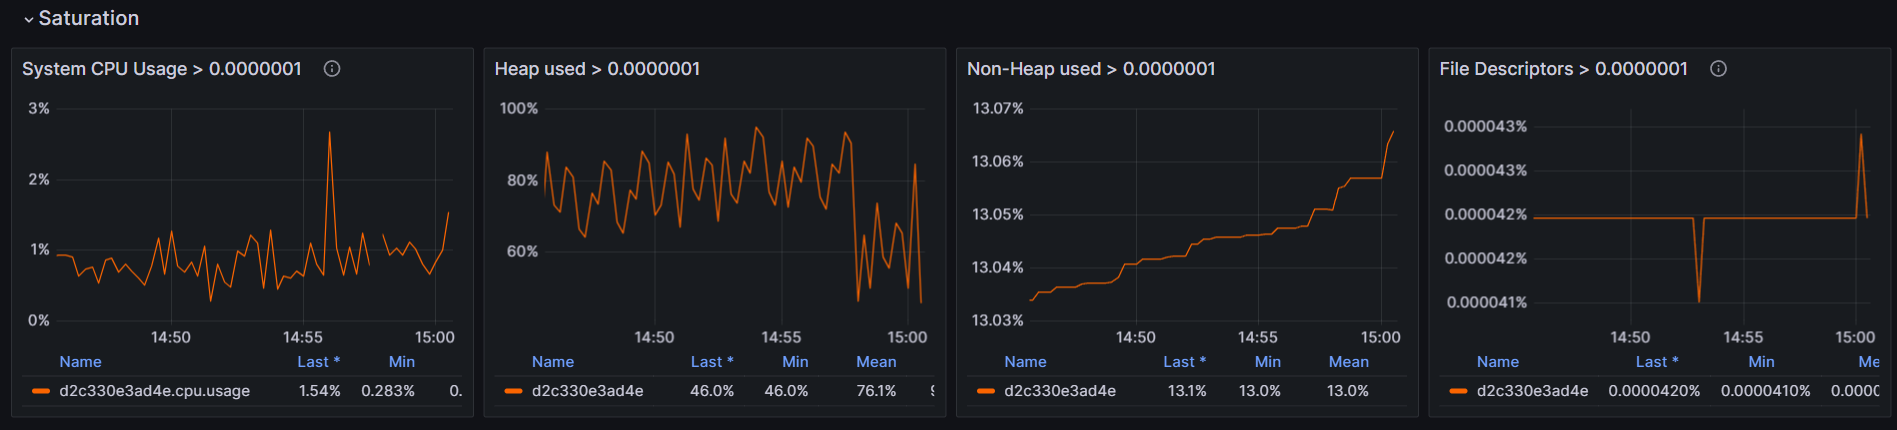
Saturation
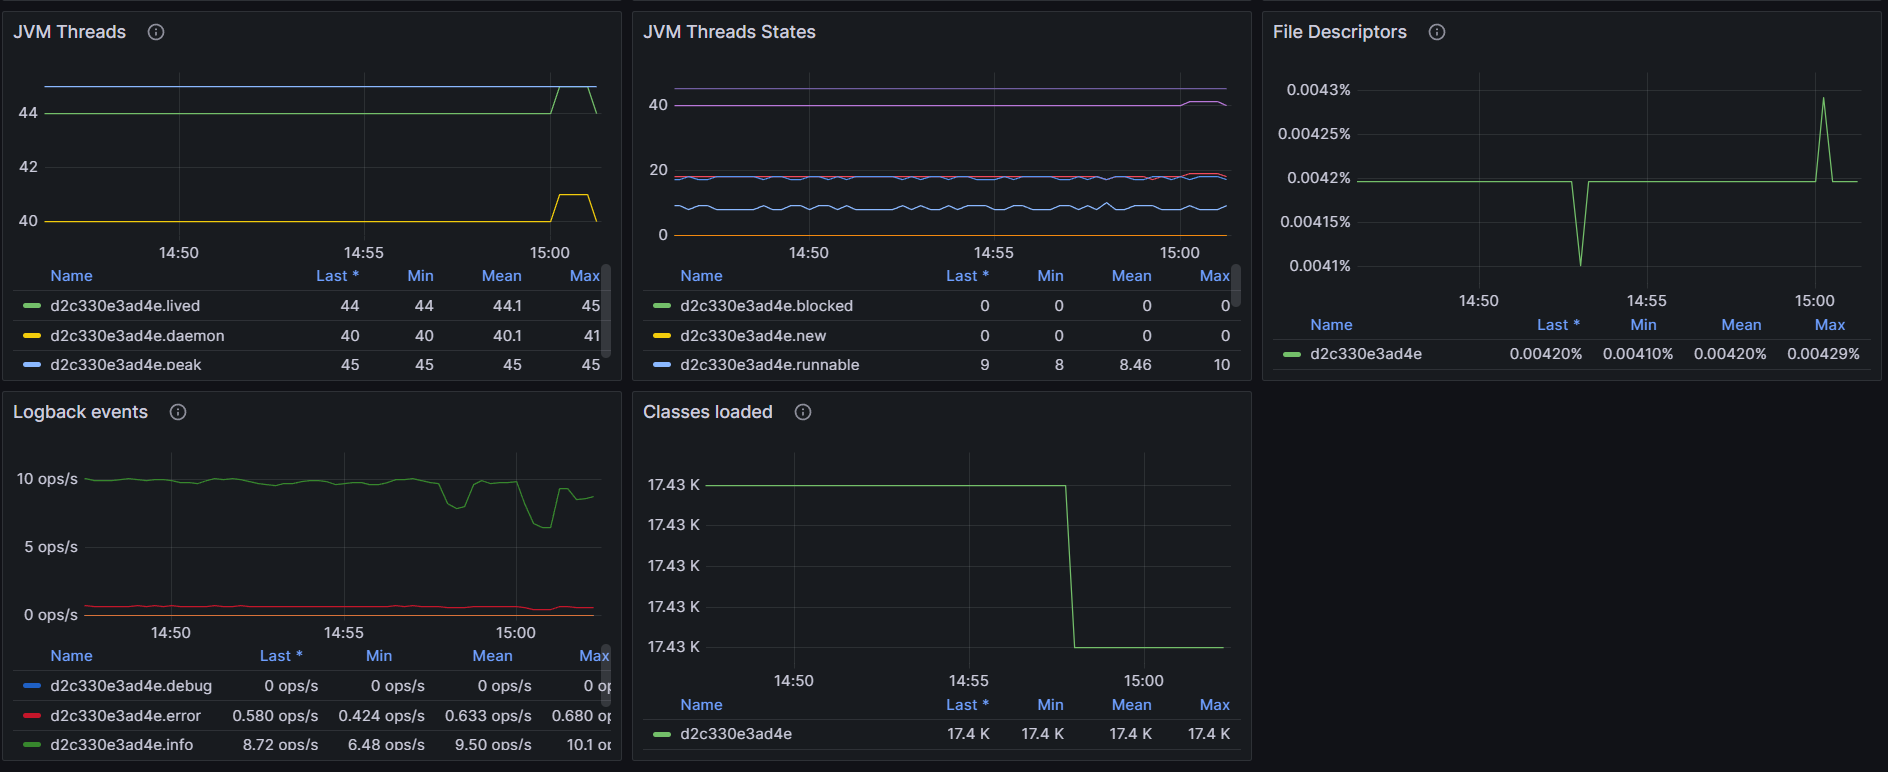
Utilization (JVM)

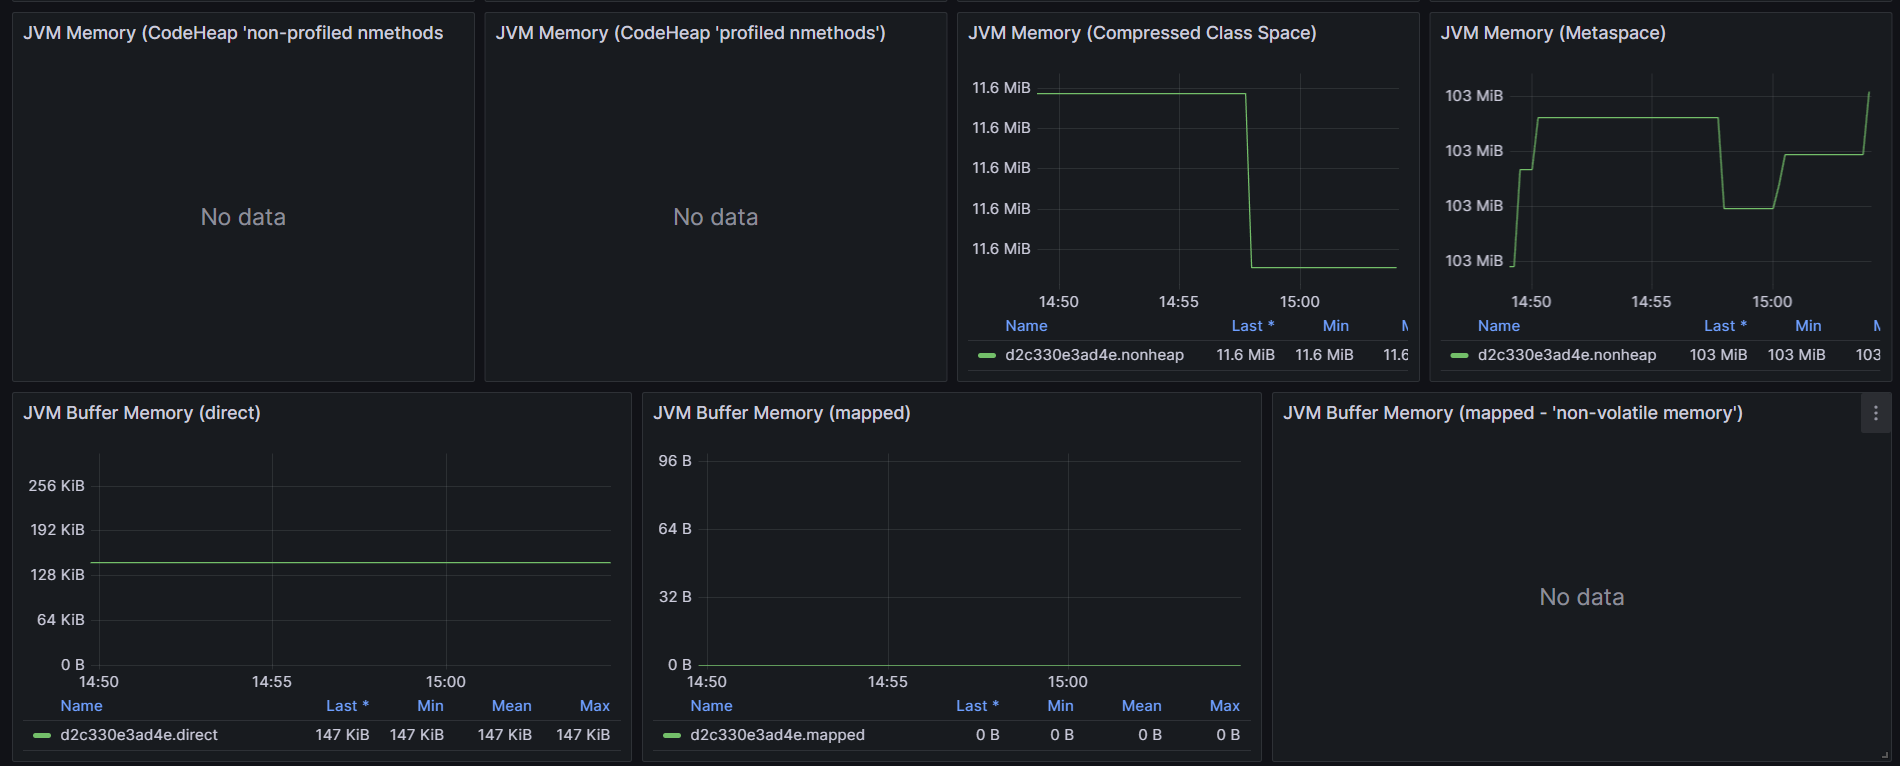
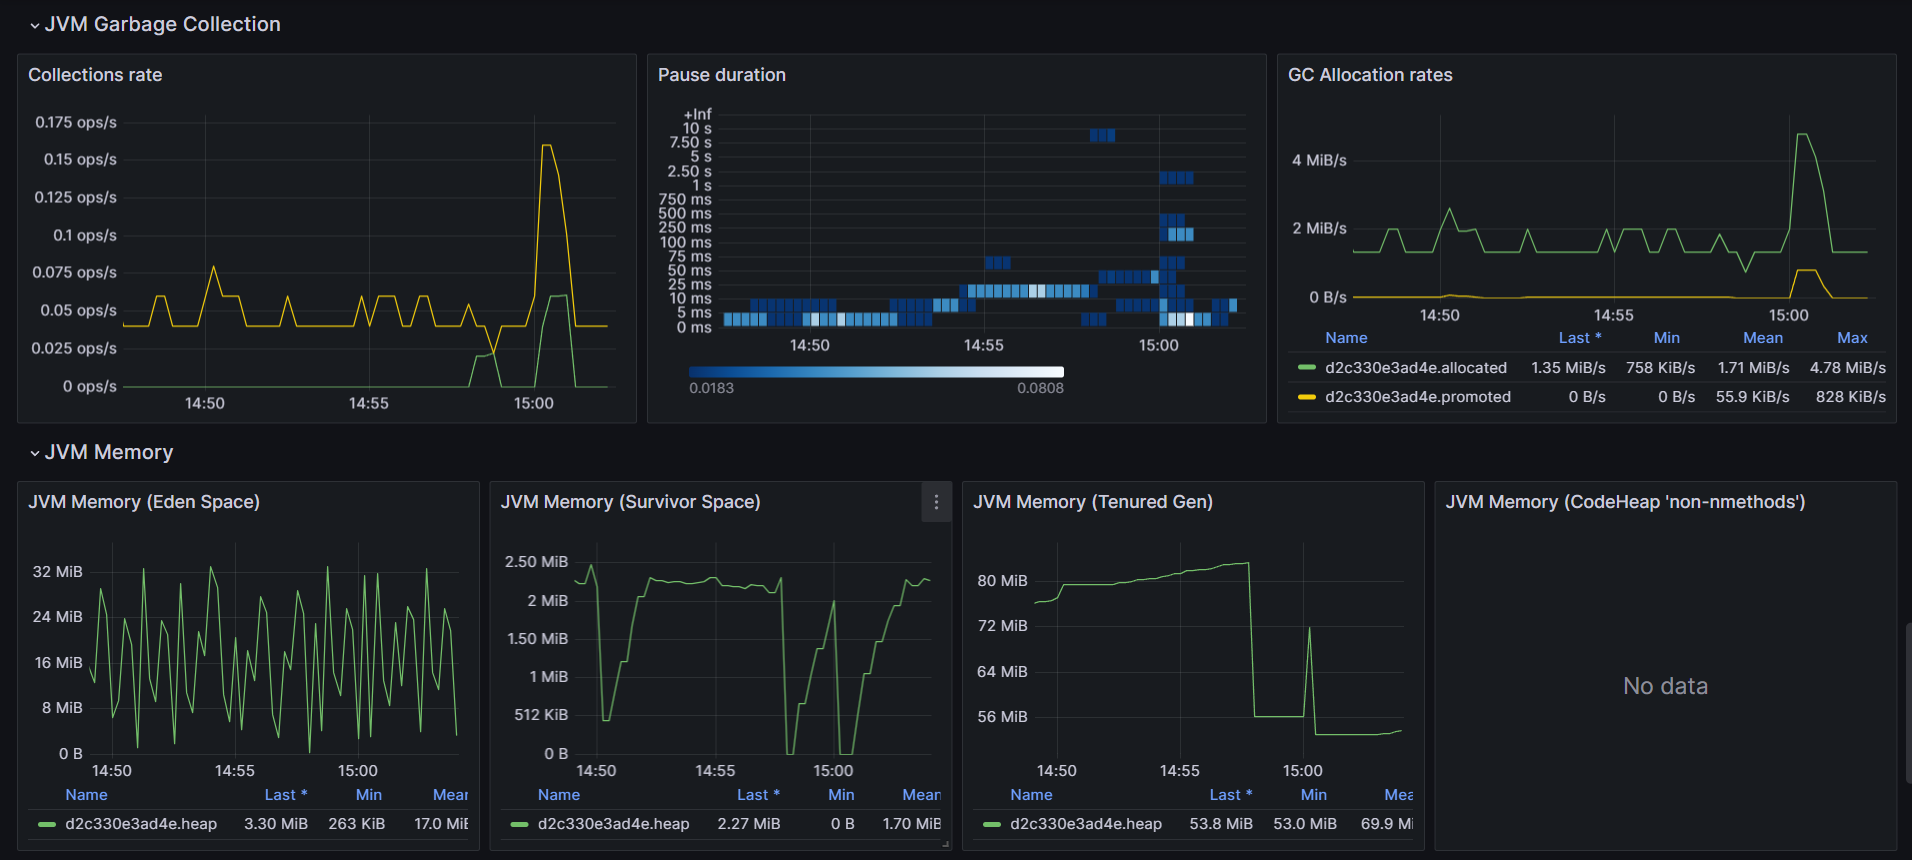
JVM Garbage Collection and Memory

Data source config
Collector type:
Collector plugins:
Collector config:
Revisions
Upload an updated version of an exported dashboard.json file from Grafana
| Revision | Description | Created | |
|---|---|---|---|
| Download |
Java Virtual Machine (JVM)
Easily monitor a Java virtual machine, which allows computers to run Java programs, with Grafana Cloud's out-of-the-box monitoring solution.
Learn more