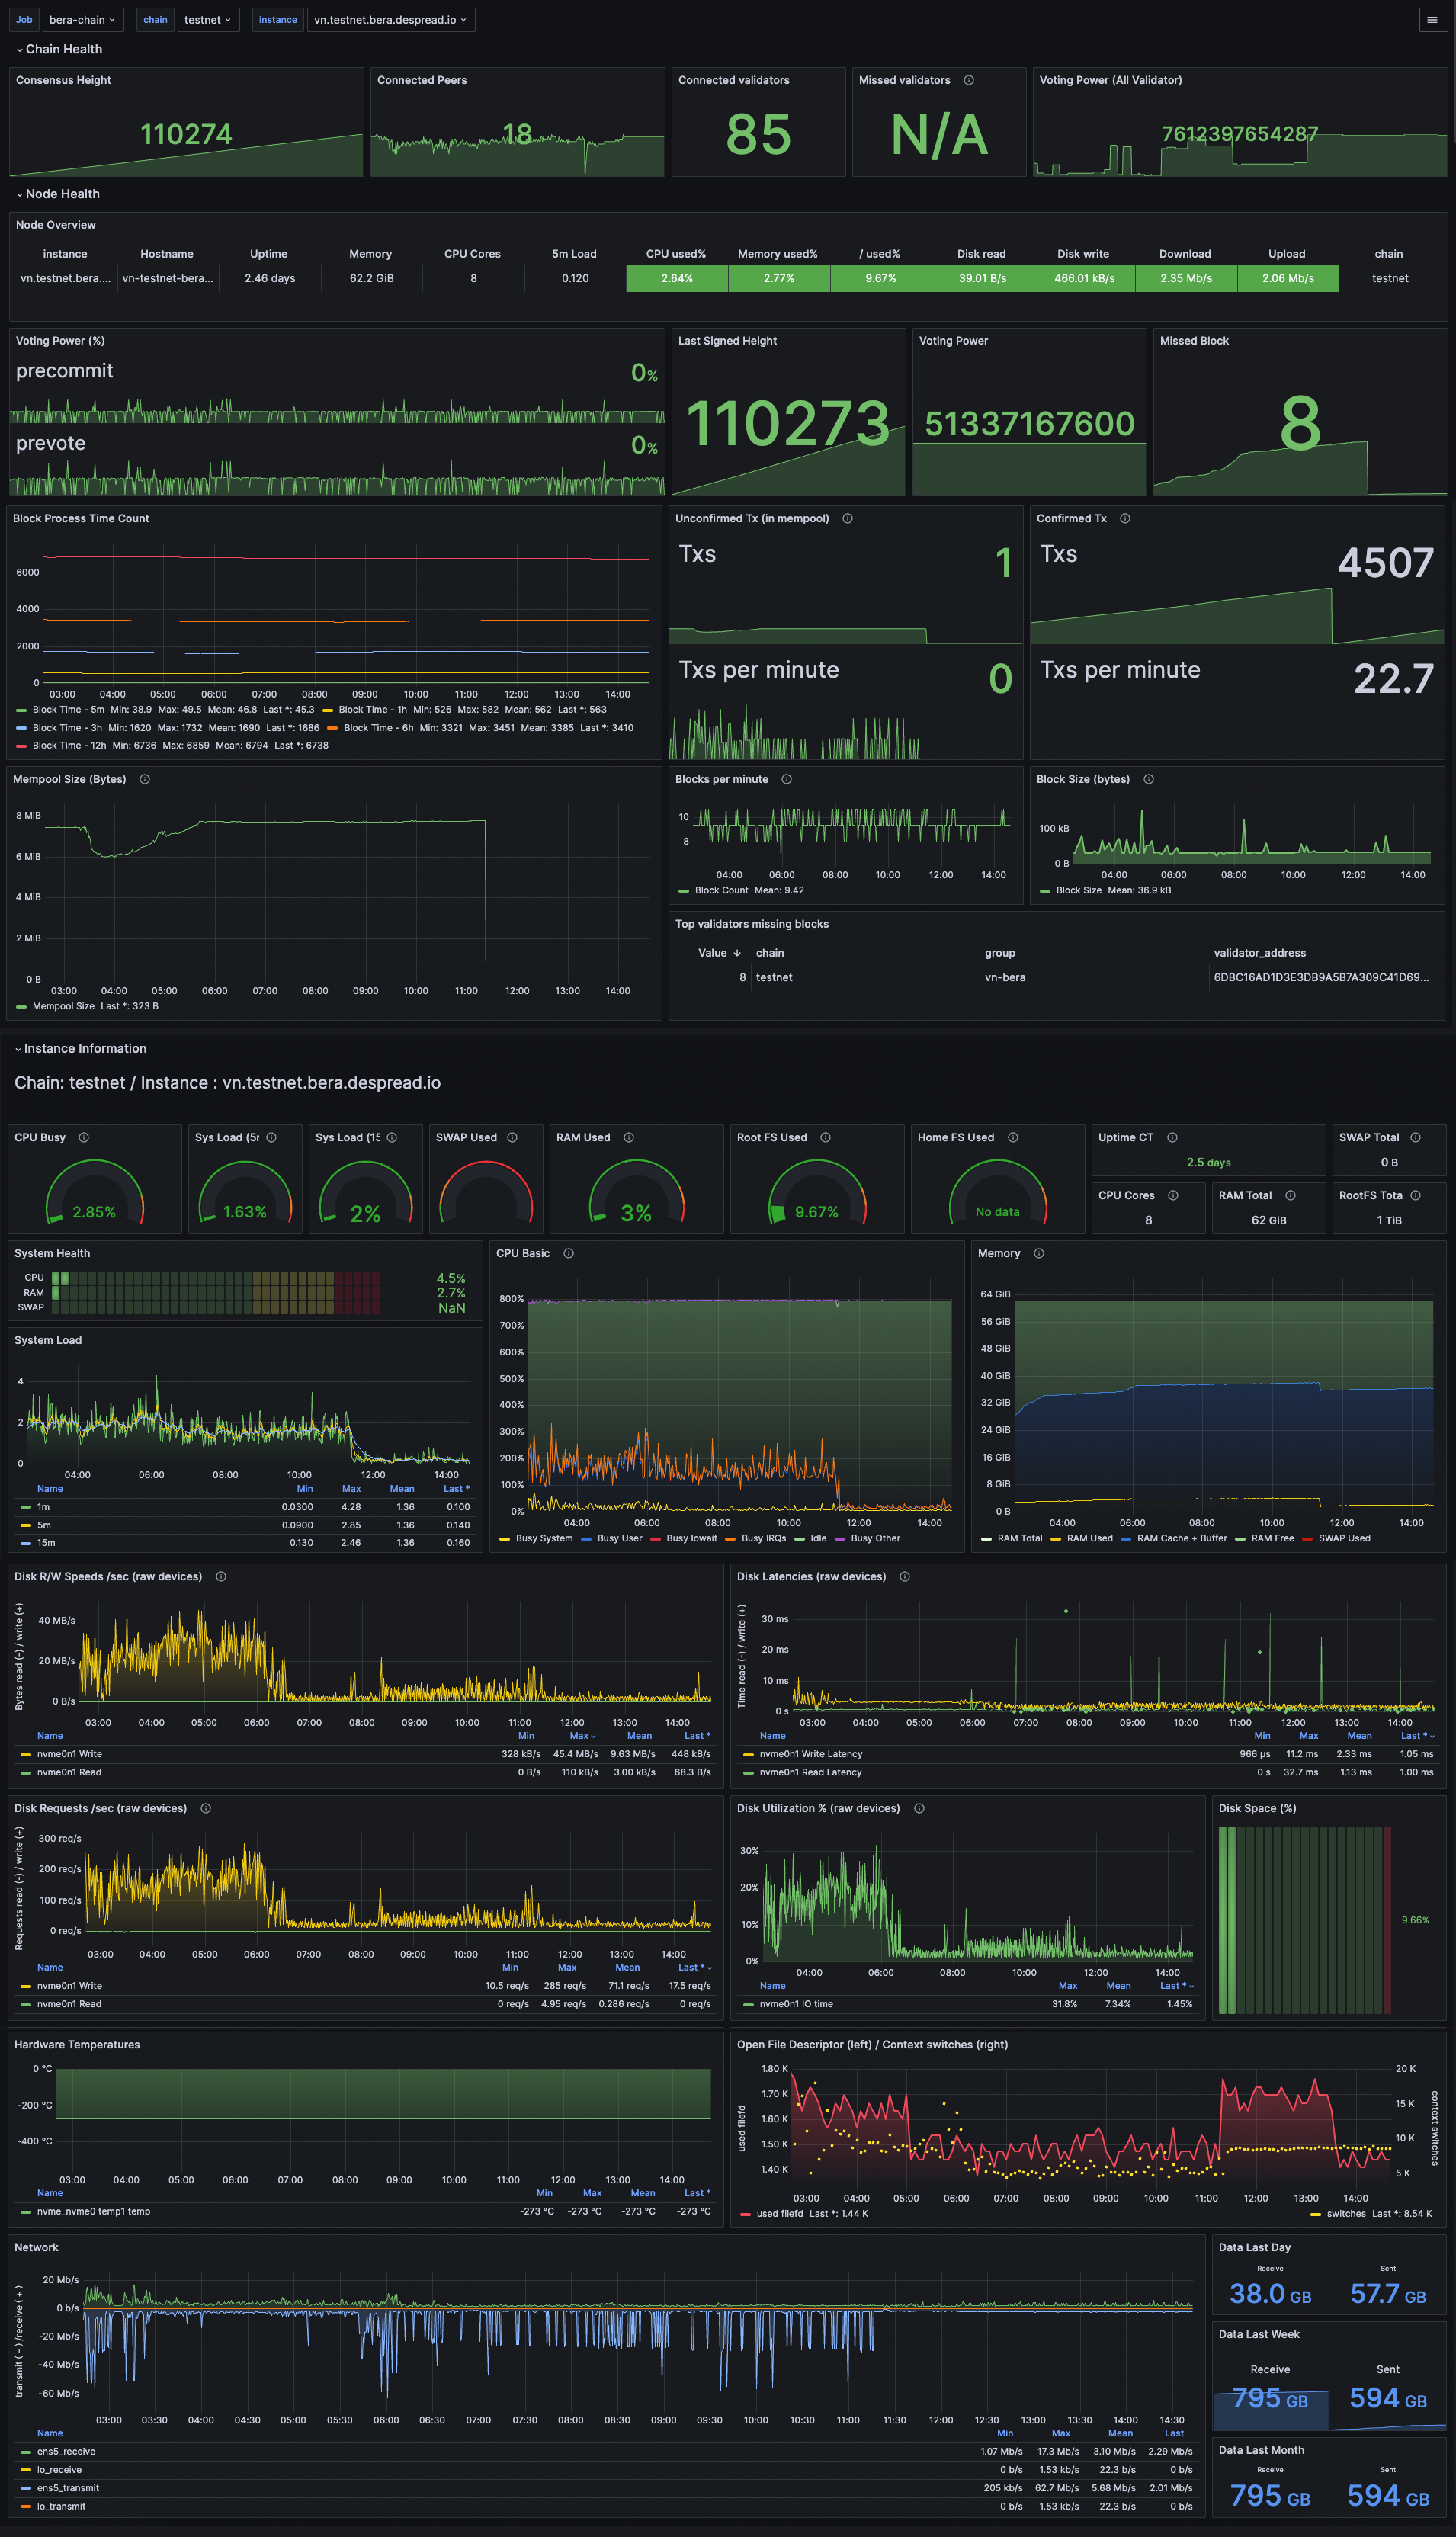
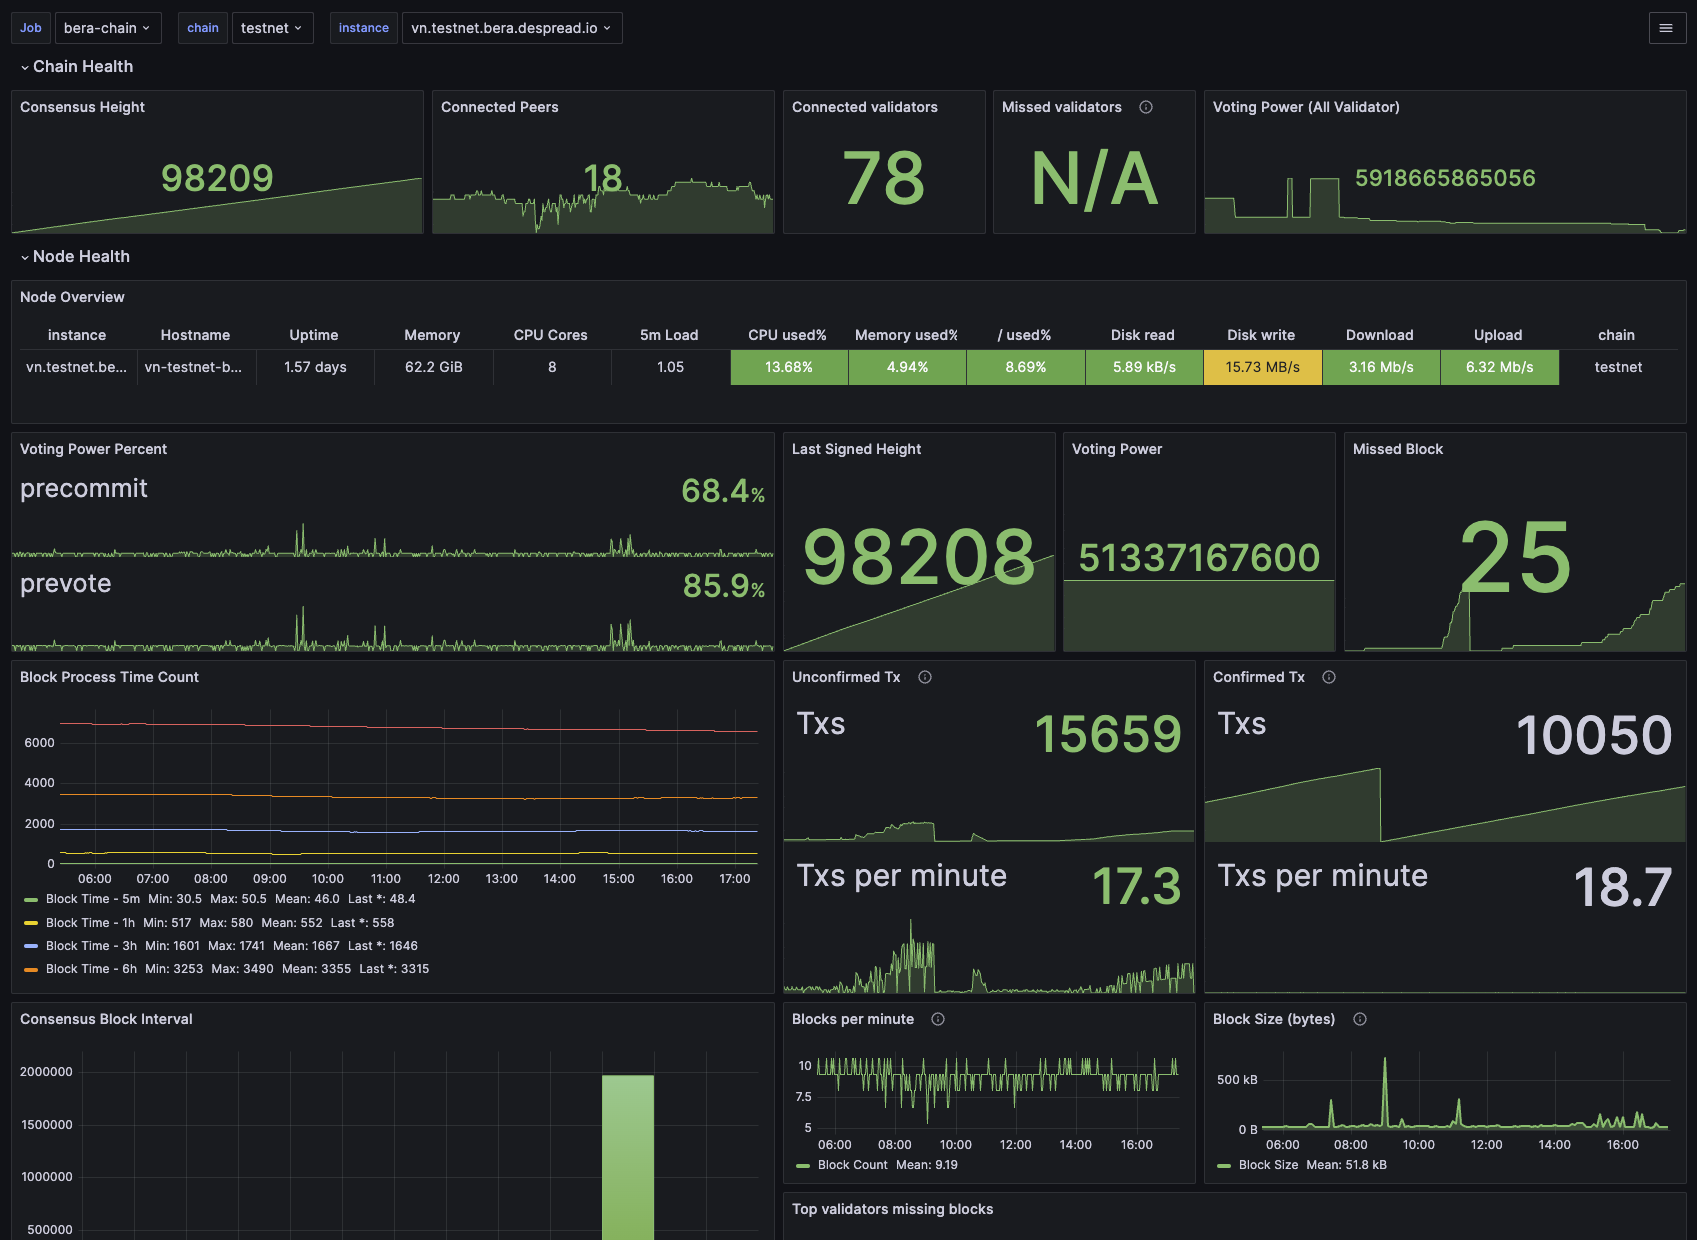
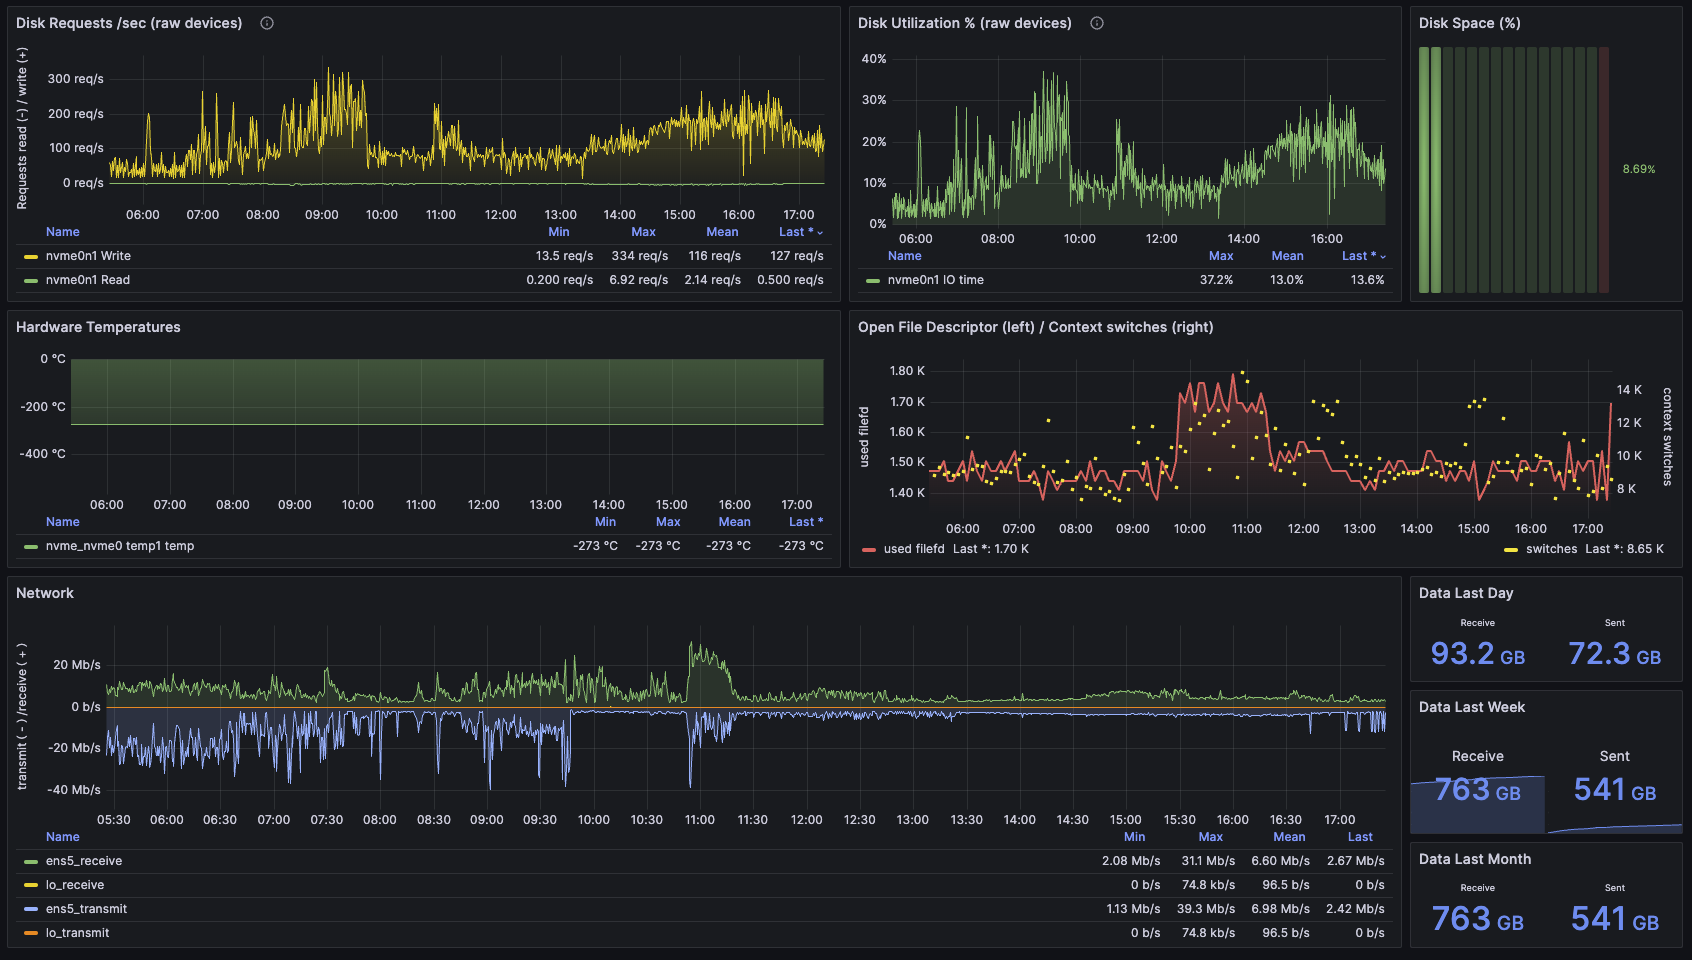
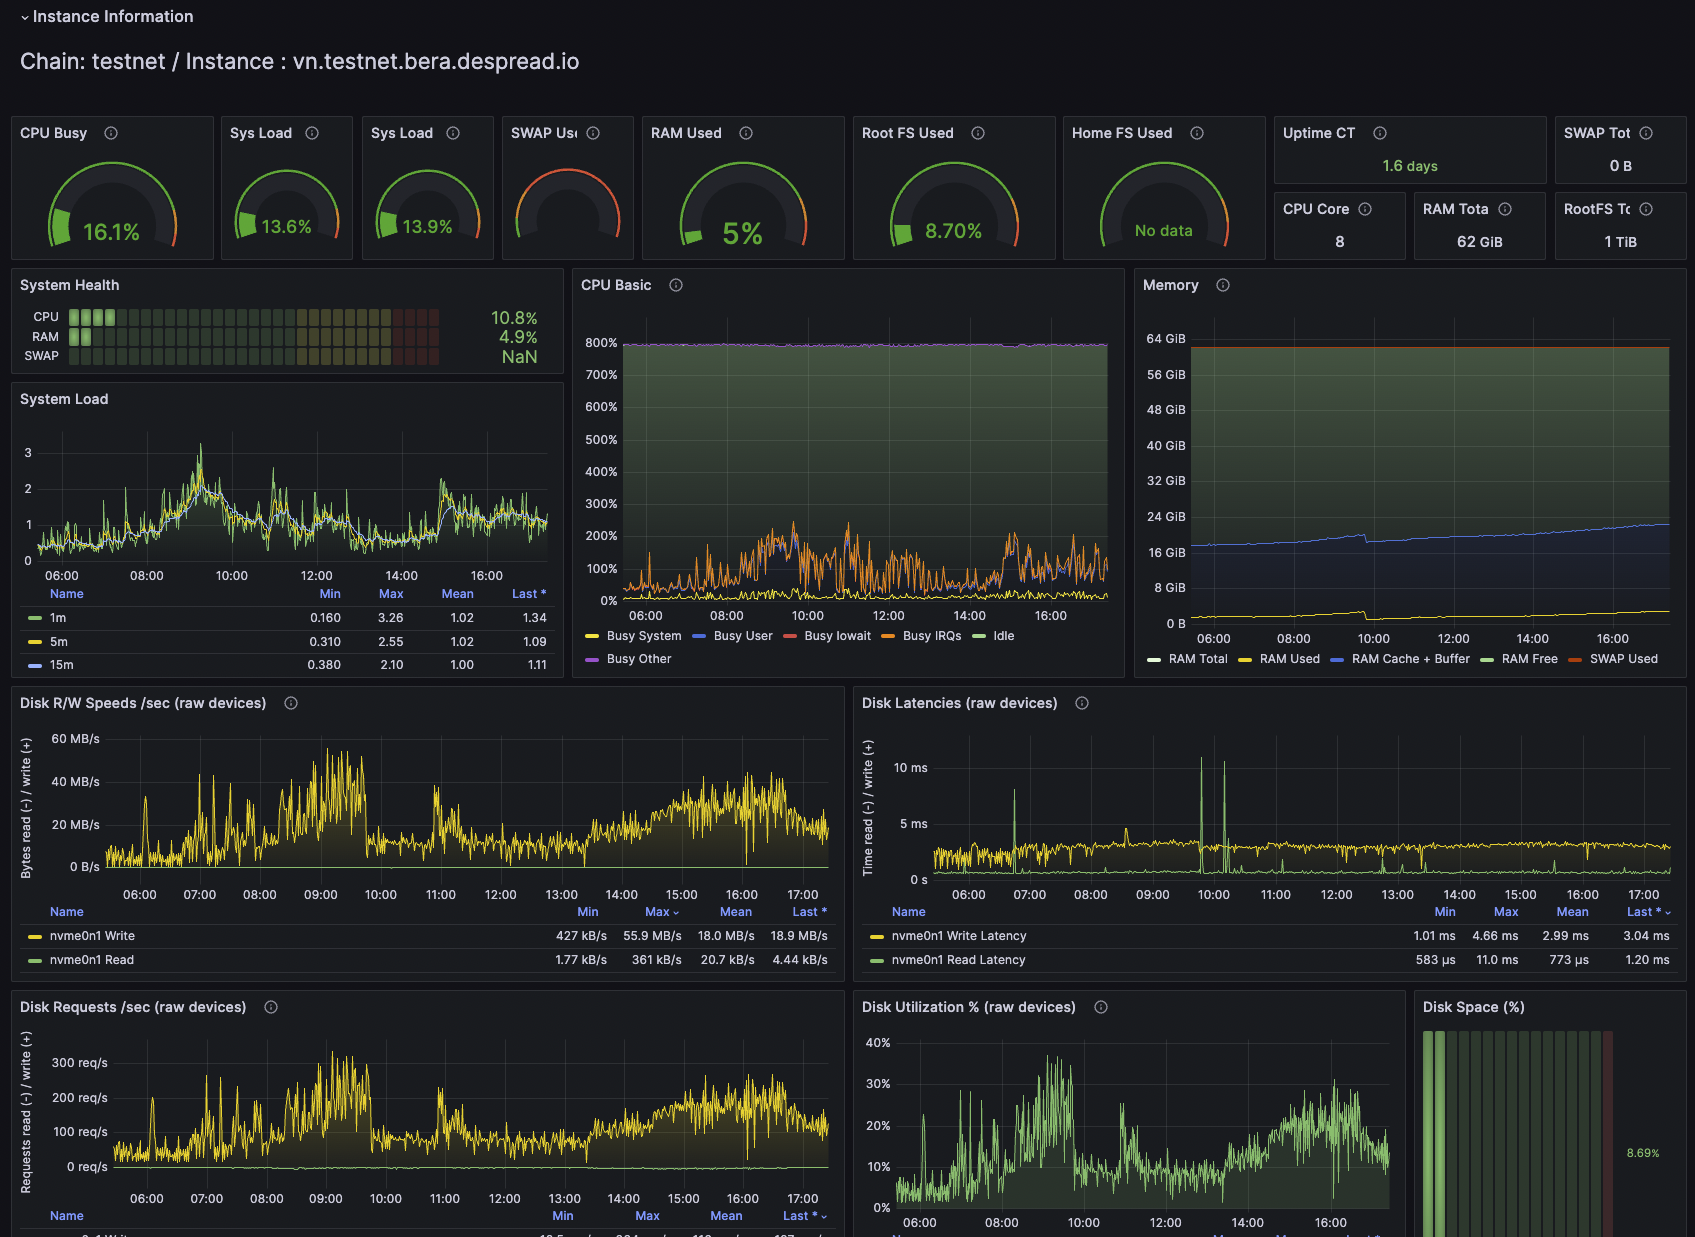
Berachain Validator Monitoring
All in one monitoring for Berachain. This dashboard is designed to monitor the validator node of the Berachain.

Berachain Validator Monitoring
All in one monitoring for Berachain.
This dashboard is designed to monitor the validator node of the Berachain.
Note: This dashboard is also available on the GitHub Repository

Getting started
- Dedicated monitoring instance :
Prometheus+Grafana+Node Exporter - Nodes :
Berachain validator node+node exporter - Communication : For a secure and light connection, I recommend scraping only allowed connections. You can also use a reverse proxy if you prefer.
Prerequisite
- Prometheus
- Berachain validator node
- Berachain metric exporter
- Node exporter
Install Node exporter
apt install prometheus-node-exporter
Ensure that node-exporter is installed on your validator to pull node metrics
Prometheus Configuration
This dashboard assumes that you have a chain tag for capturing Prometheus metrics. This tag is used to switch between testnet and mainnet monitoring. Without this chain label, the dashboard will not display any data.
Please set up your prometheus.yml file as follows:
## Prometheus.yaml example for node monitoring
# Ensure these are available from the prometheus server.
# 9100 port is prometheus-node-exporter
# 26660 port is the default Bera metrics port
  - job_name: "bera-chain"
    static_configs:
      - targets: ["vn.testnet.bera.xxxx.com:9100", "vn.testnet.bera.xxxx.com:26660"]
        labels:
          group: "validator"
          chain: "testnet"
  - job_name: "bera-chain"
    static_configs:
      - targets: ["vn.mainnet.bera.xxxx.com:9100", "vn.mainnet.bera.xxxx.com:26660"]
        labels:
          group: "validator"
          chain: "mainnet"
Note: These exact Prometheus chain names (testnet or mainnet) are used in variables in the dashboard to retrieve metrics from the API.
If you choose NOT to use these chain names in your prometheus.yml file, you will need to change these names in the Variables section within the dashboard itself.
Contributing
I'd love my work to be useful for everyone, please feel free to let me know any comments or feedback!
Also if you'd like to contribute, please fork the repository and use a feature branch. Pull requests are warmly welcome.
Related project
BerachainProject : https://www.berachain.comBerachainGitHub : https://github.com/berachain
Who am I
- Author : https://hyeongjun-dev.webflow.io
- Twitter : @devgang_eth
- Linkedin : https://www.linkedin.com/in/hyeongjun-yu-dev
- GitHub : https://github.com/hyeongjun-dev
- Blog(Medium) : https://hyeongjun-dev.medium.com
- Email : hyeongjun.dev@gmail.com
Licensing
The code in this project is licensed under MIT license.
Data source config
Collector config:
Upload an updated version of an exported dashboard.json file from Grafana
| Revision | Description | Created | |
|---|---|---|---|
| Download |


