
Azure / Infrastructure / Compute Monitoring
This dashboard displays traffic-light indicators to show the health of your Azure infrastructure resources based on key performance indicators and thresholds defined for each infrastructure resource type. The KPIs and thresholds come from Azure Monitor Baseline Alerts (https://azure.github.io/azure-monitor-baseline-alerts/). Prerequisites: The queries used in the dashboard require that you have resource metrics being sent to a Log Analytics Workspace. The InsightsMetrics table is required. Enable VM Insights by following the instructions provided here: https://learn.microsoft.com/en-us/azure/azure-monitor/vm/vminsights-enable-overview This is one of a collection of dashboards linked together via dashboard links and the "azure-infra-monitor" tag. Other dashboards in the collection include: Azure / Infrastructure / Network Monitoring Azure / Infrastructure / Storage and Key Vaults Monitoring Azure / Infrastructure / Apps Monitoring Azure / Infrastructure / Data Monitoring The other dashboards in this collection can be found in the Azure Monitor Team Grafana library here: https://grafana.com/orgs/azure/dashboards. Once imported, you will be able to access these dashboards using the Azure Infra Monitoring Dashboards tab.
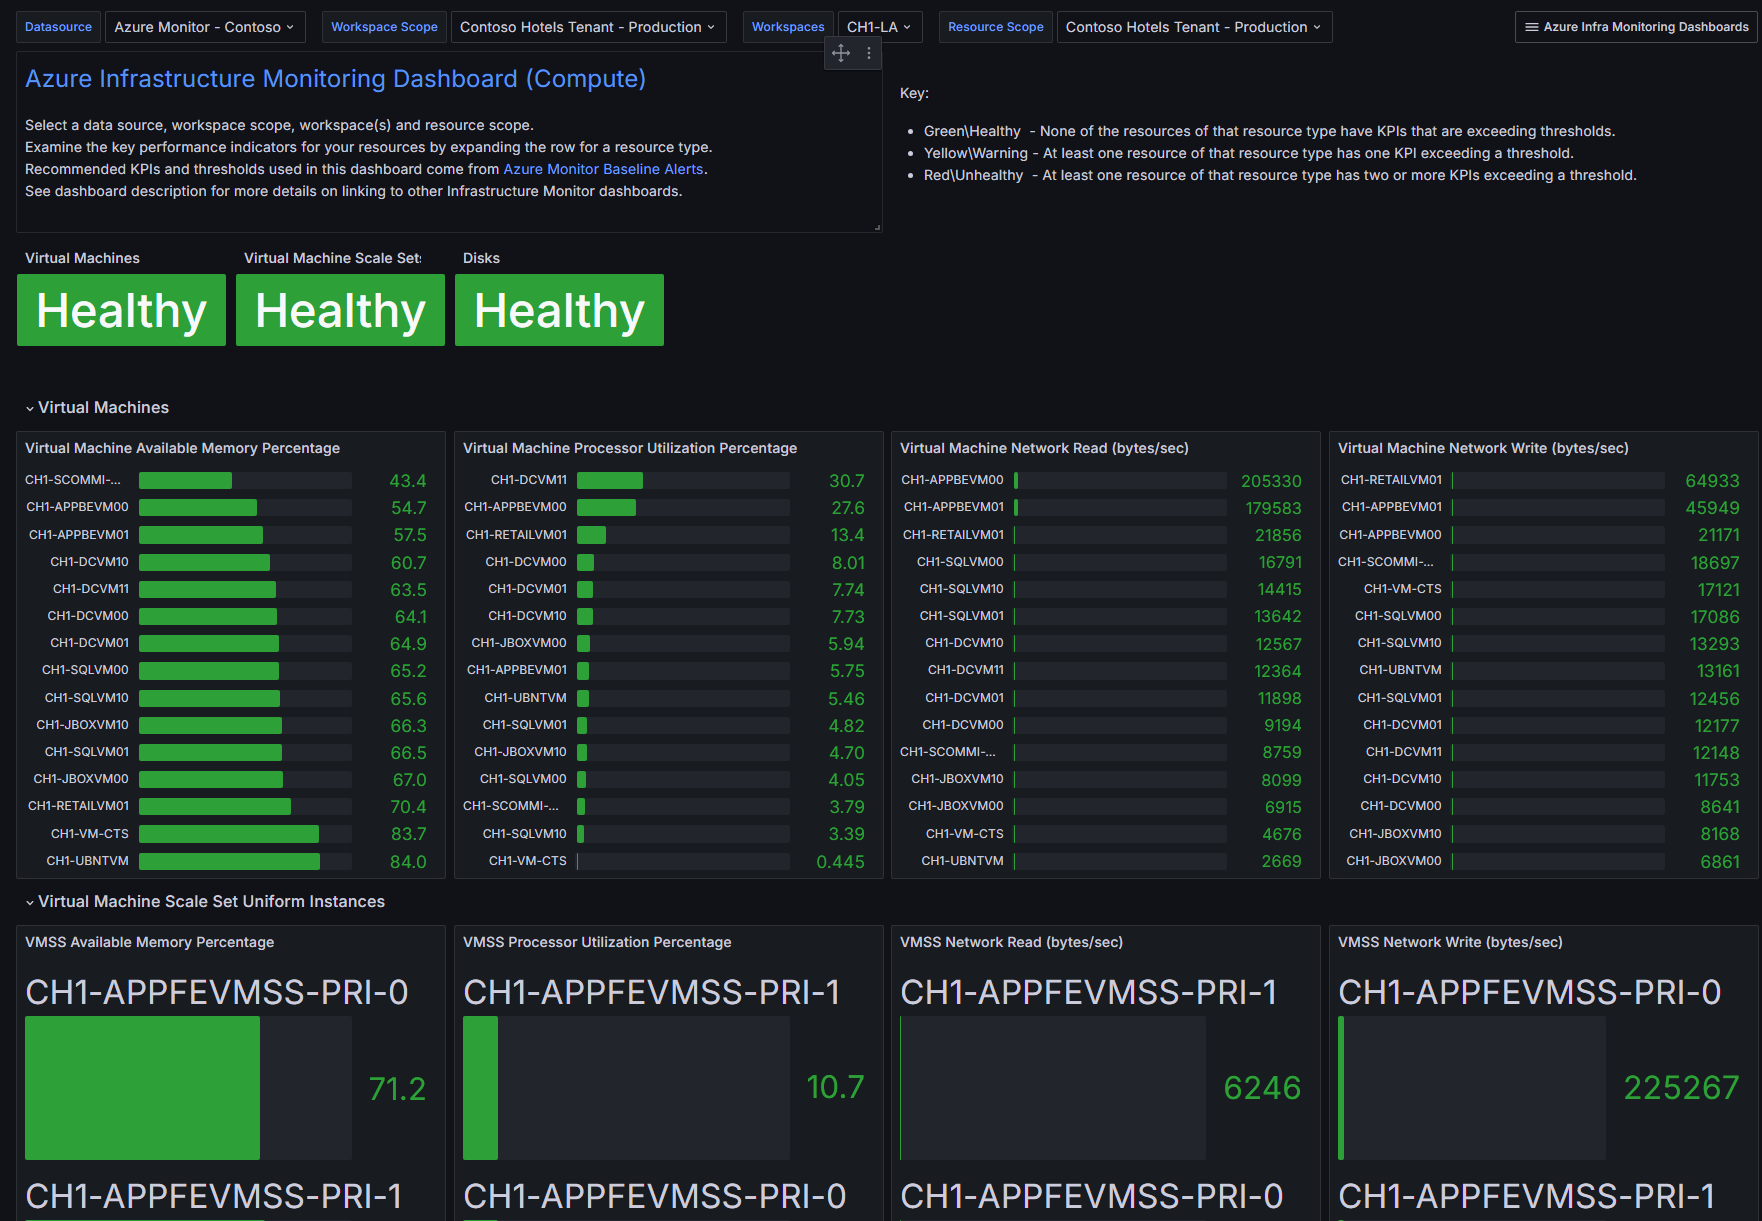
Azure / Infrastructure / Compute Monitoring
This dashboard displays traffic-light indicators to show the health of your Azure infrastructure resources based on key performance indicators and thresholds defined for each infrastructure resource type. The KPIs and thresholds come from Azure Monitor Baseline Alerts.
Prerequisites
The queries used in the dashboard require that you have resource metrics being sent to a Log Analytics Workspace. The InsightsMetrics table is required. For detailed instructions, refer to Azure Monitor Enable VM Insights
Infrastructure Dashboard Collection
This is one of a collection of dashboards linked together via dashboard links and the "azure-infra-monitor" tag. Other dashboards in the collection include:
- Azure / Infrastructure / Network Monitoring
- Azure / Infrastructure / Storage and Key Vaults Monitoring
- Azure / Infrastructure / Apps Monitoring
- Azure / Infrastructure / Data Monitoring
The other dashboards in this collection can be found in the Azure Monitor Grafana Library. Once imported, you will be able to access these dashboards using the Azure Infra Monitoring Dashboards tab.
Data source config
Collector config:
Upload an updated version of an exported dashboard.json file from Grafana
| Revision | Description | Created | |
|---|---|---|---|
| Download |
Azure Cosmos DB
With the Grafana plugin for Azure Cosmos DB, you can quickly visualize and query your Azure Cosmos DB data from within Grafana.
Learn more