
Vertica Depot (Prometheus)
Monitors database depot usage.
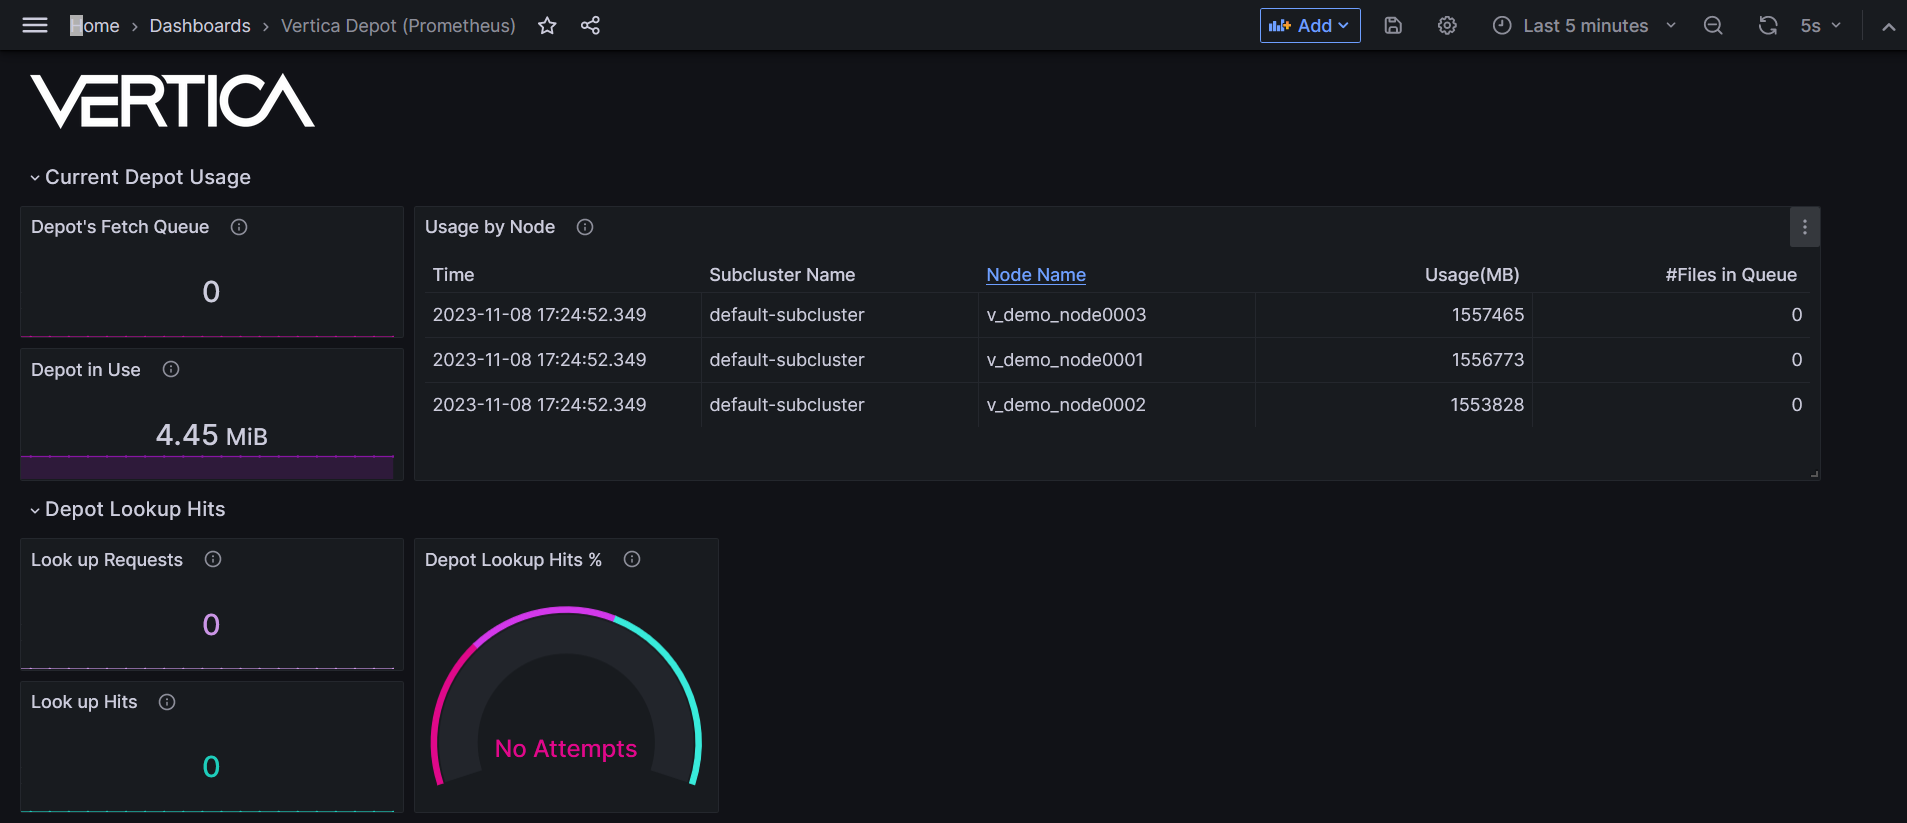
View details about depot usage. This dashboard visualizes the following data:
- Current usage
- Lookup hits
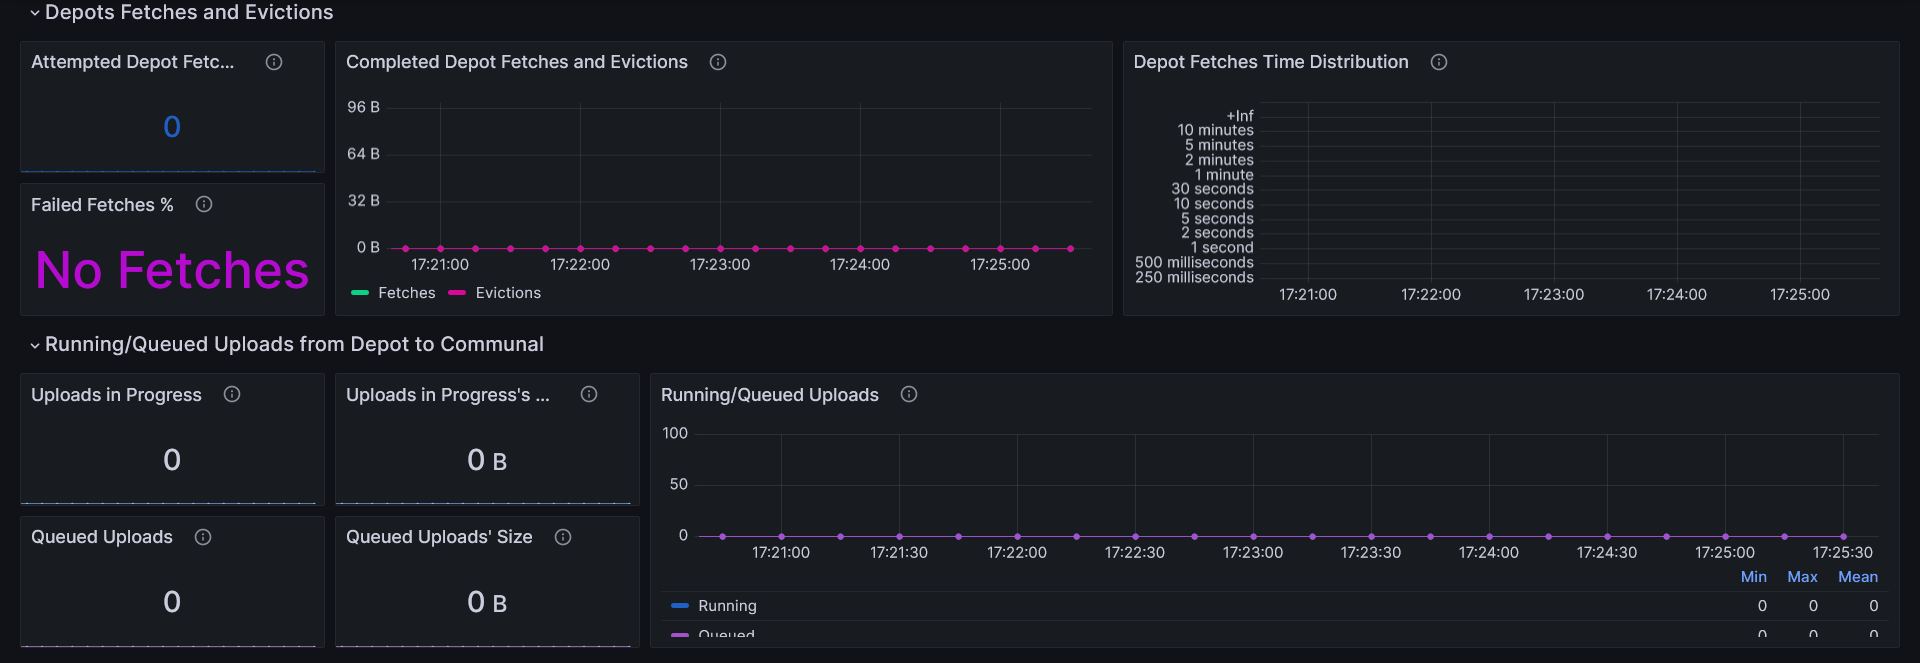
- Fetches and evictions
- Uploads from depot to communal storage
IMPORTANT: To access Prometheus metrics, Vertica requires that you configure the HTTPS service for certificate authentication.
Vertica dashboards
Vertica recommends running Vertica Depot (Prometheus) with other Vertica dashboards that use Prometheus as a data source:
Additional resources
These resources provide details about Vertica and Prometheus:
- Prometheus metrics: comprehensive list of Prometheus metrics that Vertica supports.
- vertica/vertica-kubernetes: Vertica on Kubernetes GitHub repository.
- Prometheus integration: configure Vertica on Kubernetes with Prometheus.
Available on GitHub.
Data source config
Collector type:
Collector plugins:
Collector config:
Revisions
Upload an updated version of an exported dashboard.json file from Grafana
| Revision | Description | Created | |
|---|---|---|---|
| Download |