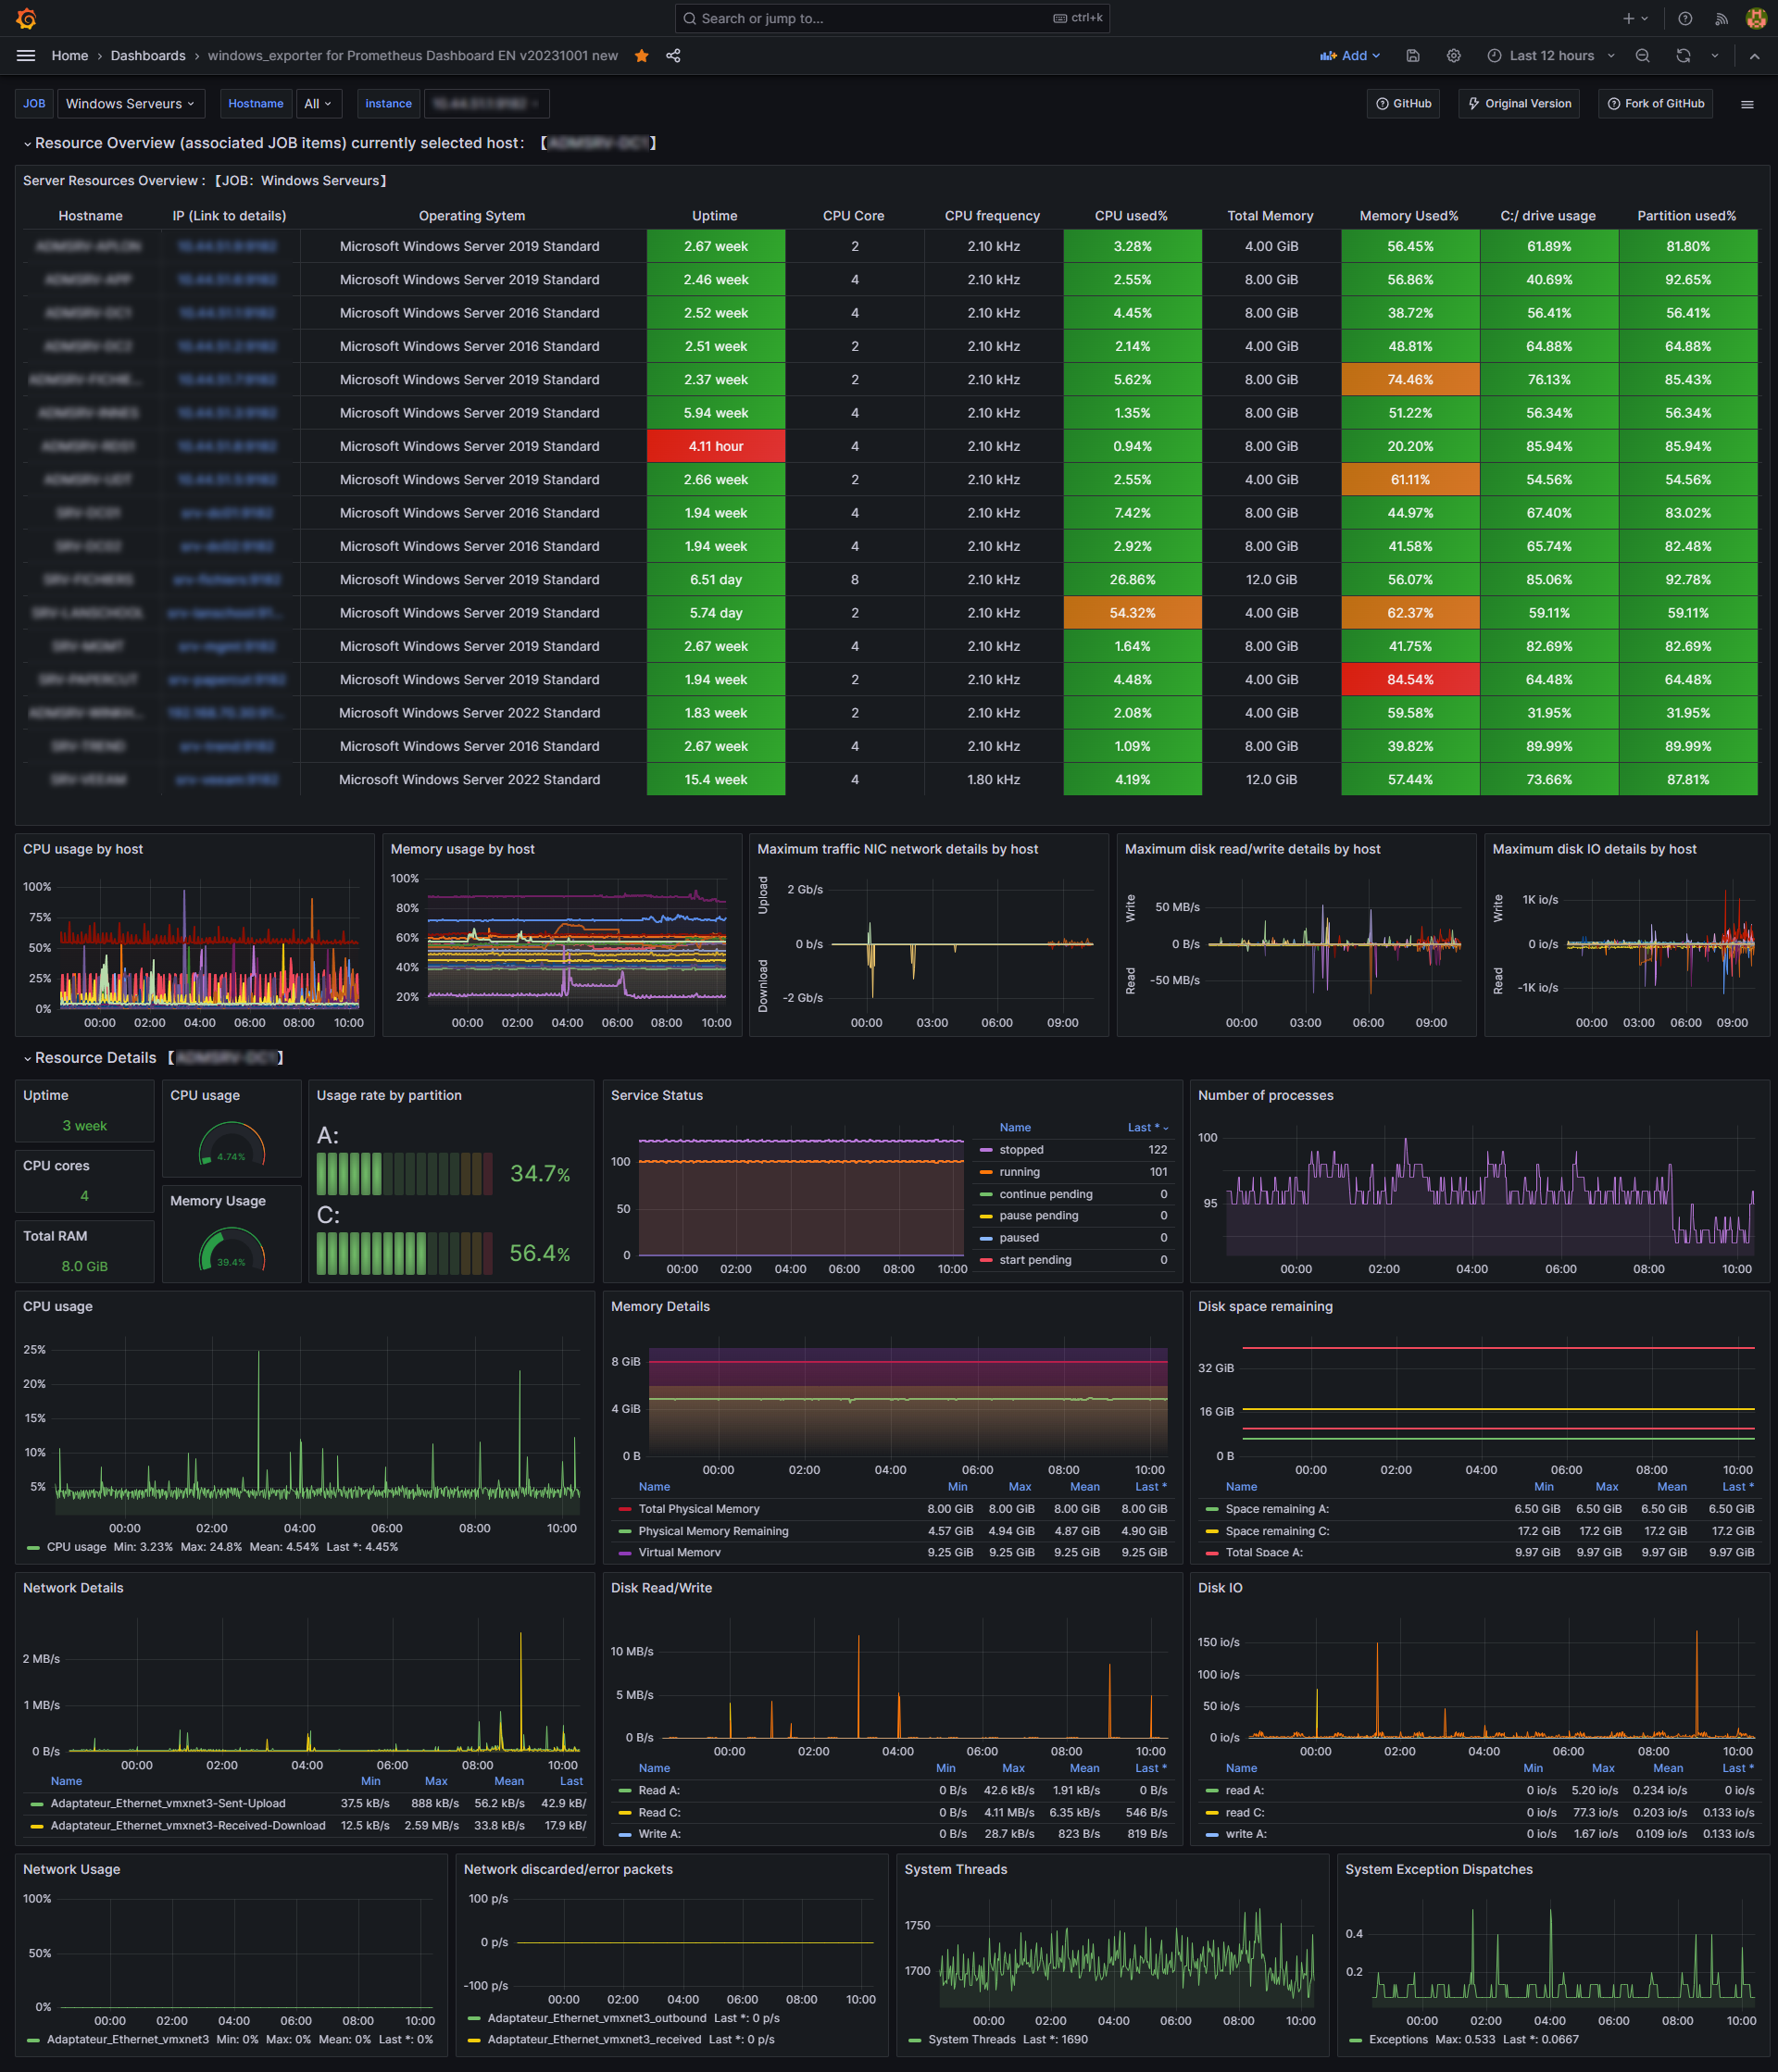
windows_exporter for Prometheus Dashboard EN v20231002-SeiyaGame
【English version】Update 2023.10.02, Includes: CPU, memory, disk IO, network, temperature and other monitoring metrics https://github.com/SeiyaGame/Prometheus
Windows Dashboard
This is a translation and update of this original dashboard version :
- https://grafana.com/grafana/dashboards/10467
- https://github.com/starsliao/Prometheus/tree/master/windows_exporter
Due to the depreciation of the angular plugin, I migrated the dashboard to React.
The only thing that's a bit disturbing about the react version is that the table is a bit large ...
No option yet exists to reduce it
The old version of the dashboard is available here
Update on my github !
Data source config
Collector config:
Upload an updated version of an exported dashboard.json file from Grafana
| Revision | Description | Created | |
|---|---|---|---|
| Download |
Metrics Endpoint (Prometheus)
Easily monitor any Prometheus-compatible and publicly accessible metrics URL with Grafana Cloud's out-of-the-box monitoring solution.
Learn more
