
Prometheus RDS exporter
Prometheus RDS exporter internal metrics
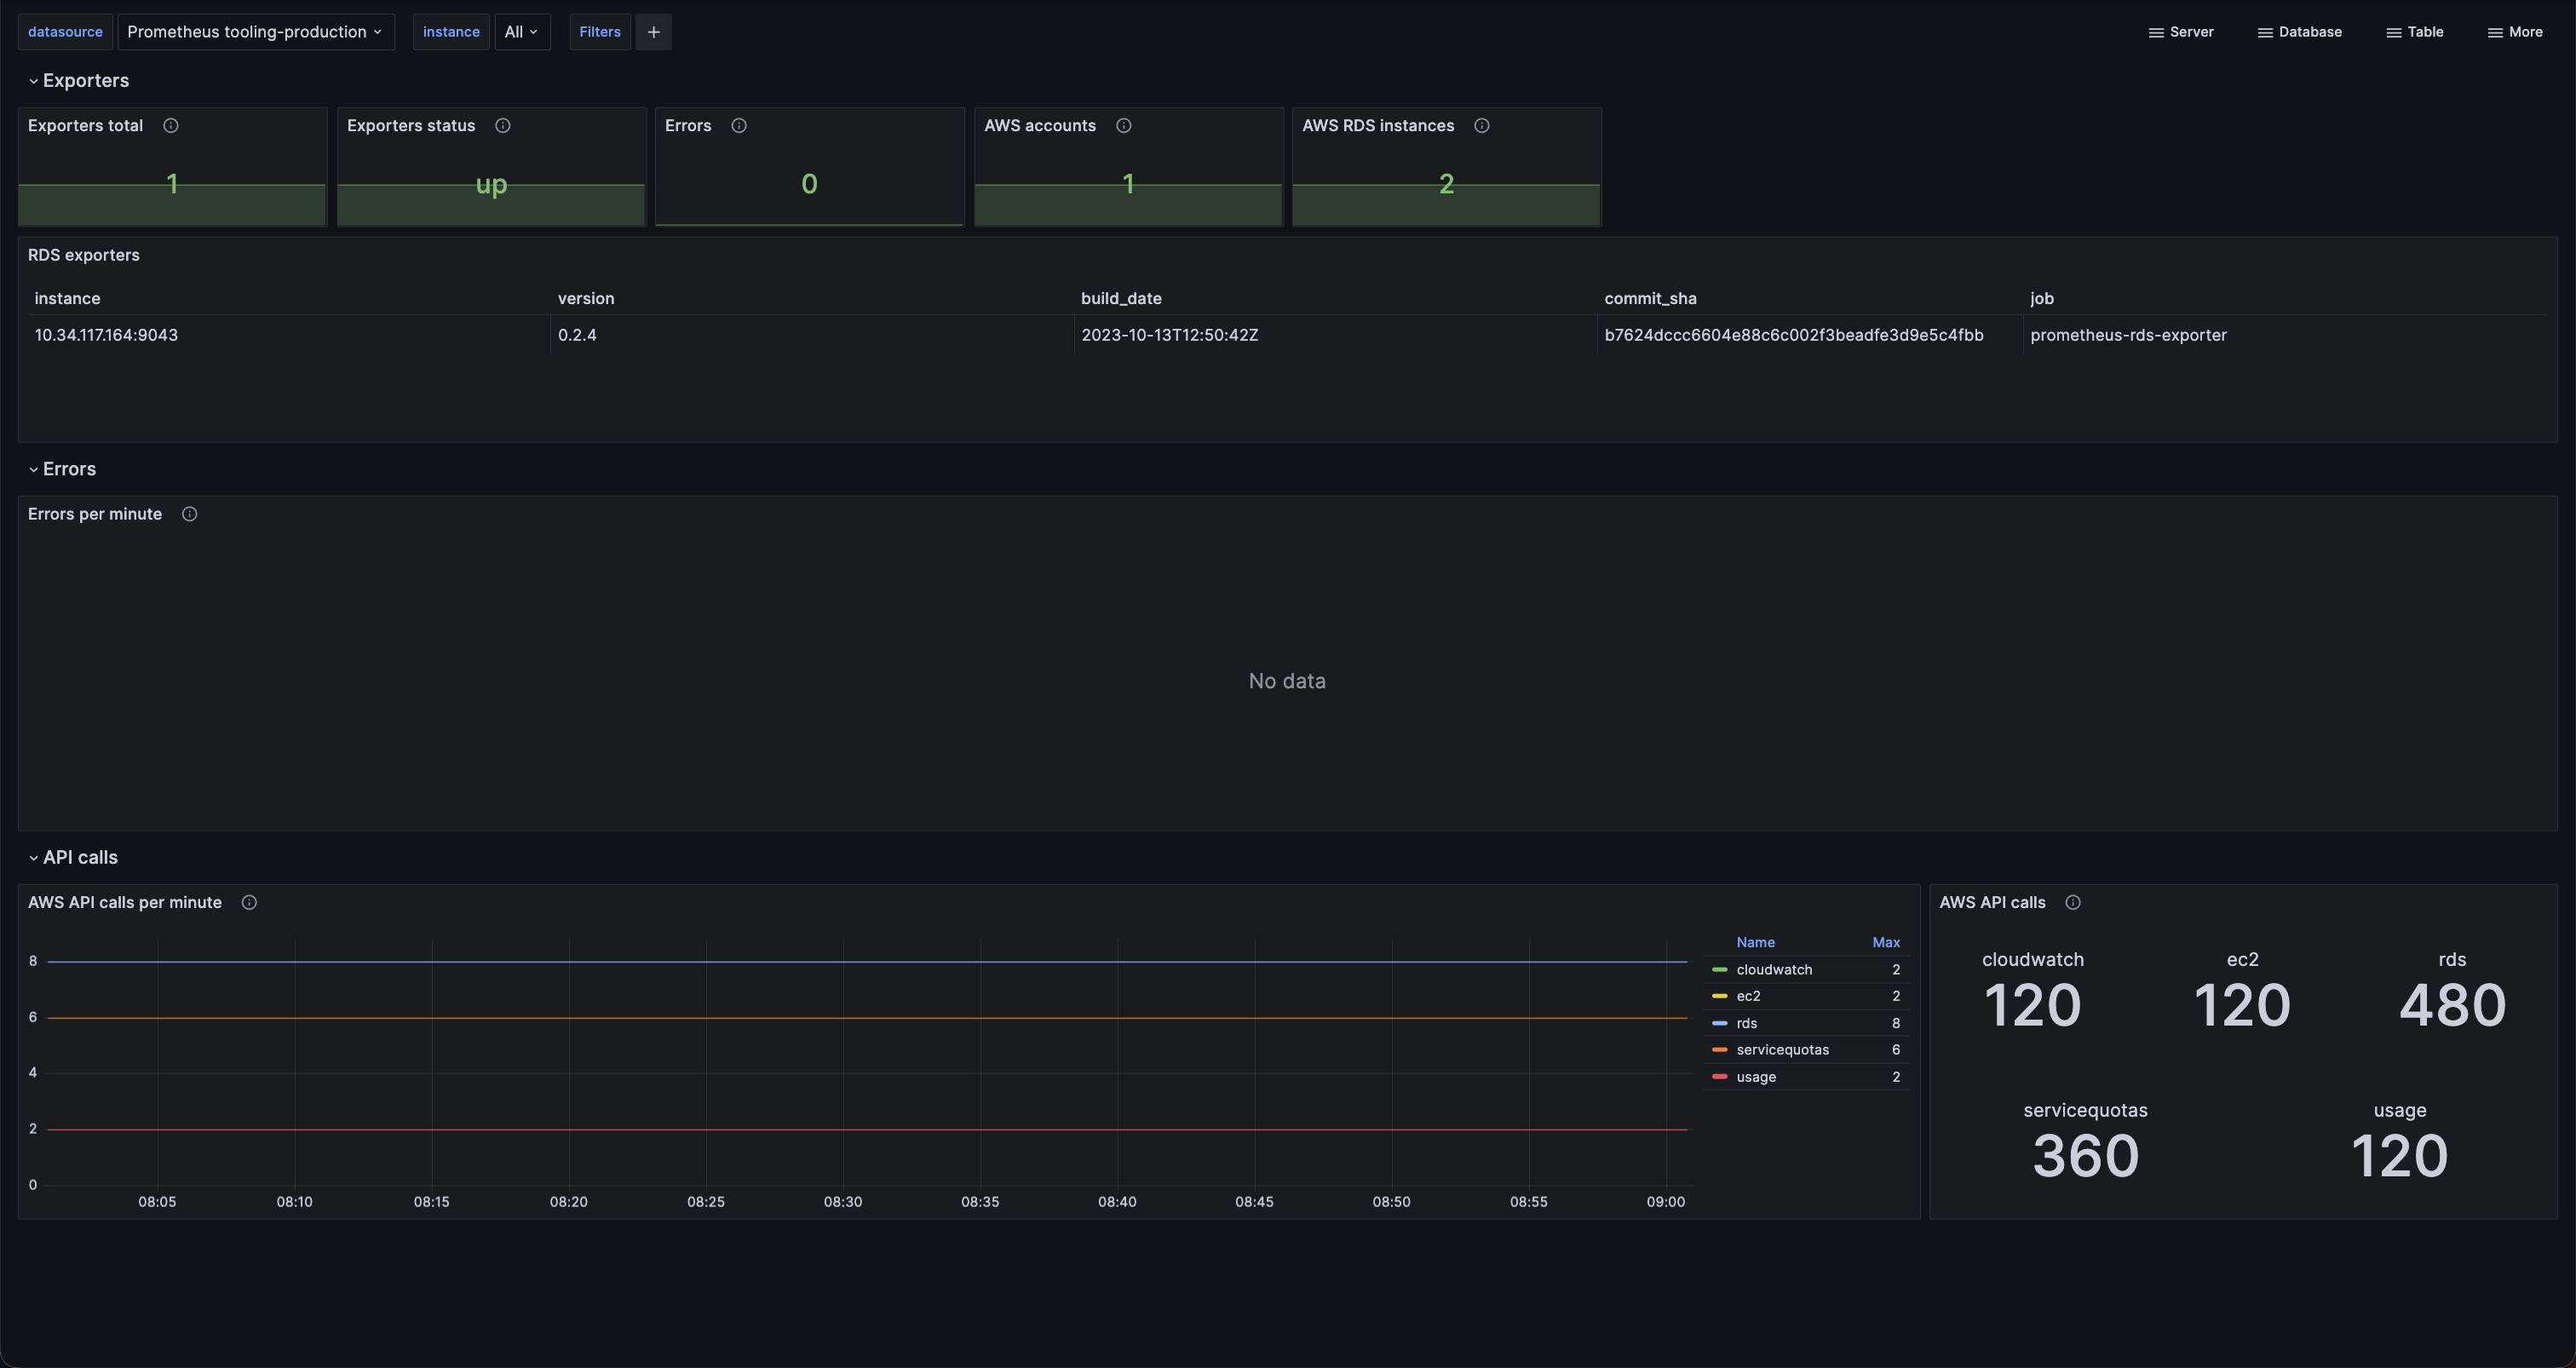
Dashboard for Prometheus RDS exporter, including:
- RDS exporter inventory
- Error rate
- AWS API calls
See more information at https://github.com/qonto/prometheus-rds-exporter
Installation
- Install https://github.com/qonto/prometheus-rds-exporter
- Import the dashboard
Data source config
Collector type:
Collector plugins:
Collector config:
Revisions
Upload an updated version of an exported dashboard.json file from Grafana
| Revision | Description | Created | |
|---|---|---|---|
| Download |
Metrics Endpoint (Prometheus)
Easily monitor any Prometheus-compatible and publicly accessible metrics URL with Grafana Cloud's out-of-the-box monitoring solution.
Learn more