Wireguard + WireRest (JVM)
Dashboard for monitoring Wireguard and WireRest API
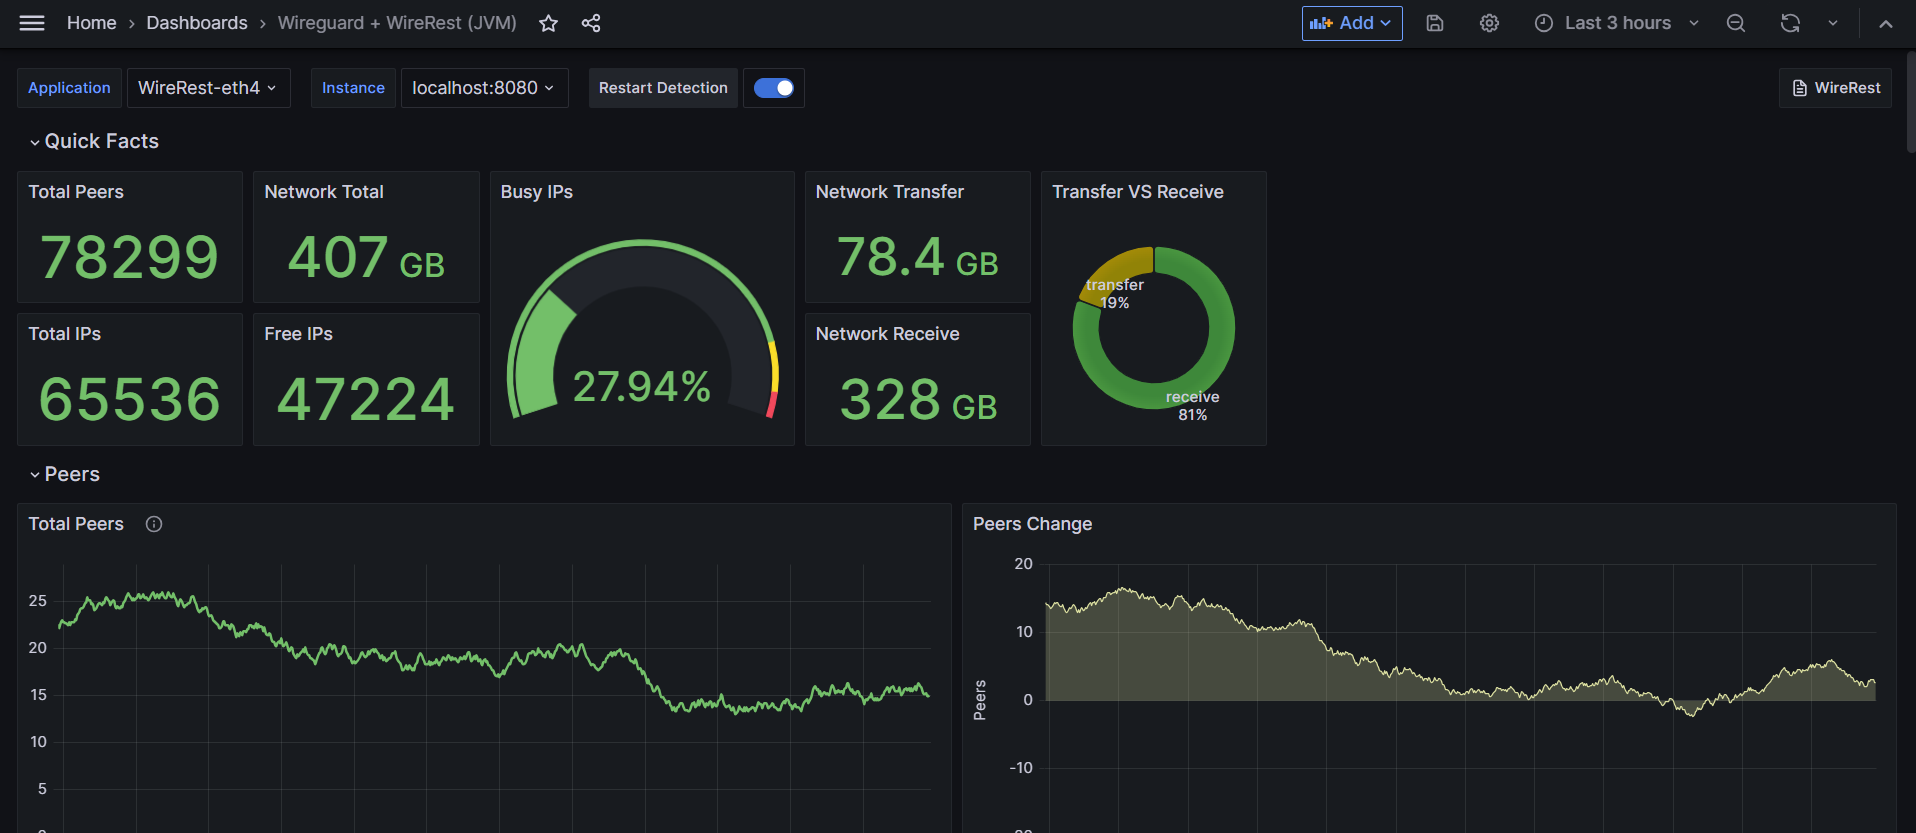
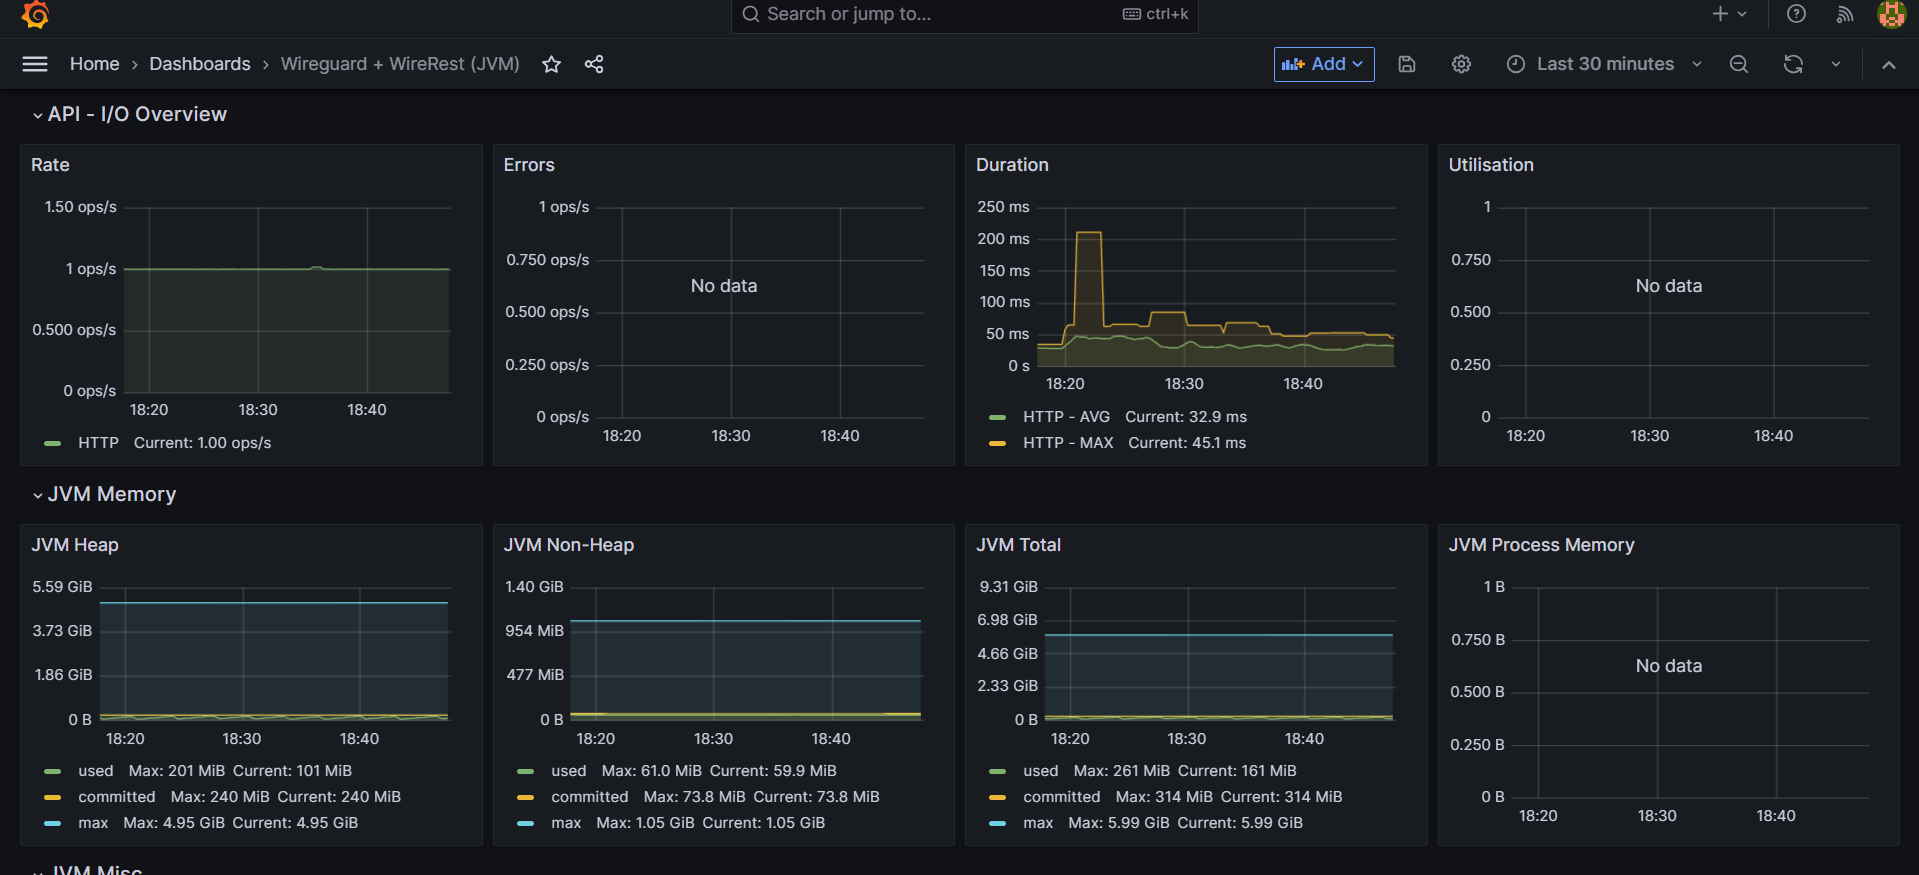
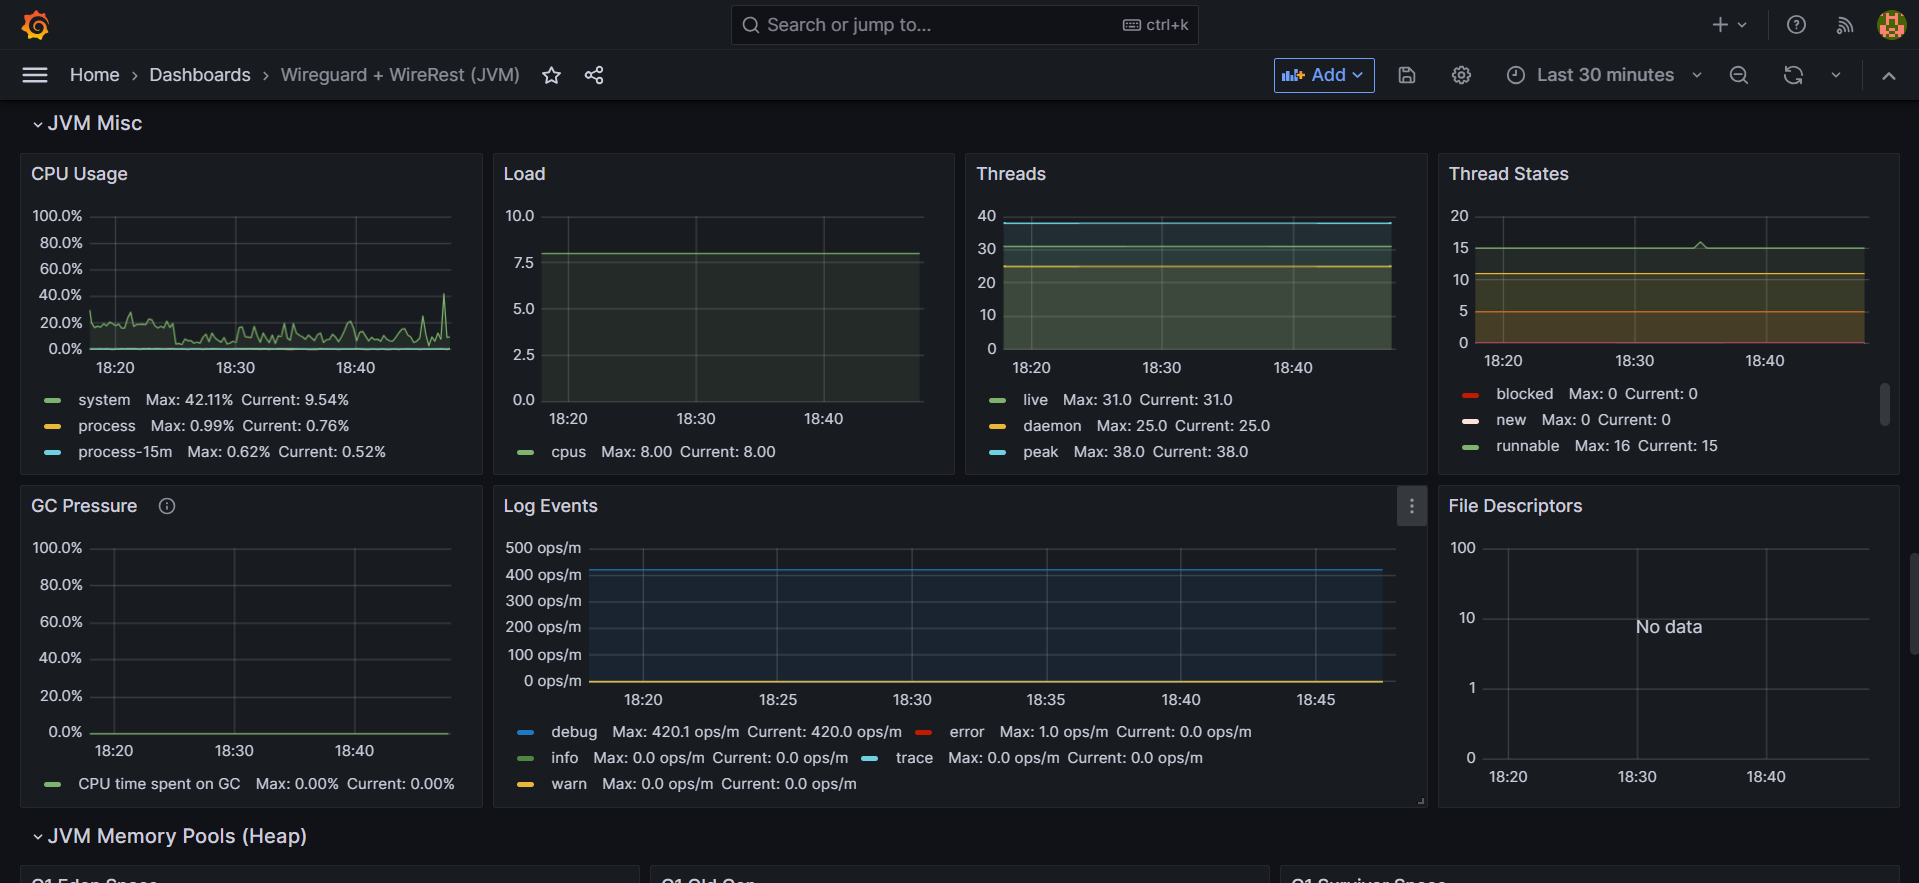
This is a dashboard that will allow you to view:
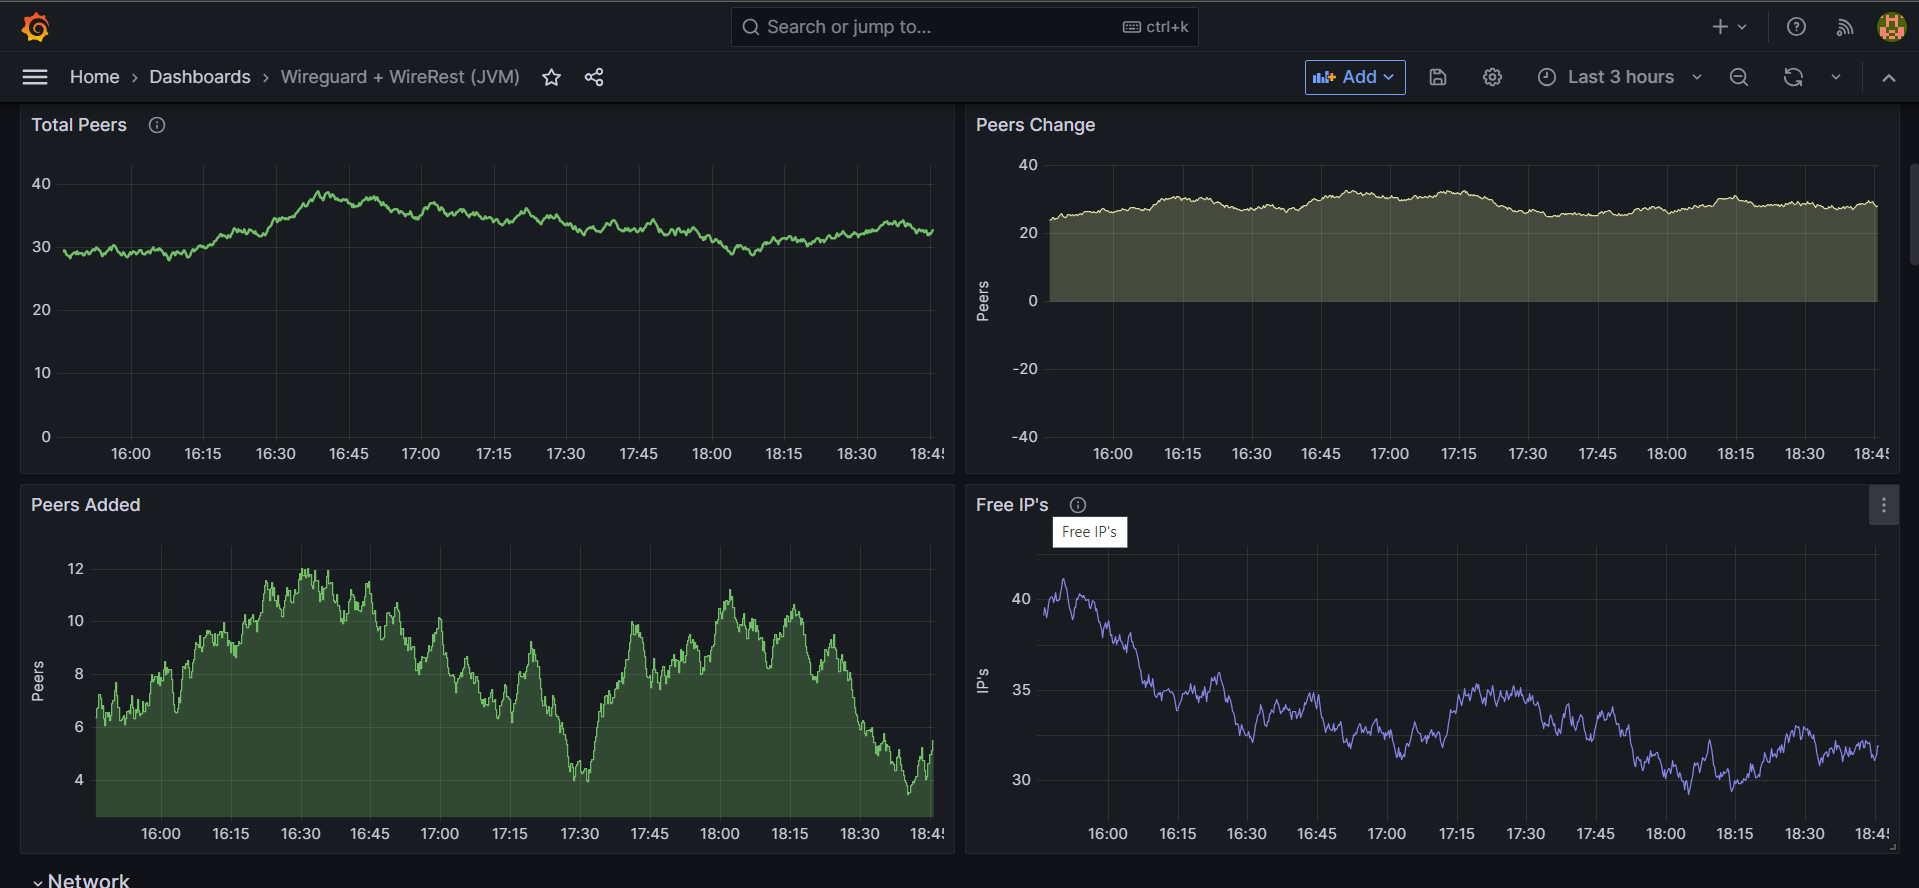
- Number of peers
- How many peers are created in a period of time
- How many peers are removed per time interval
- How many free / total IP addresses (v4) in the interface that wireguard uses
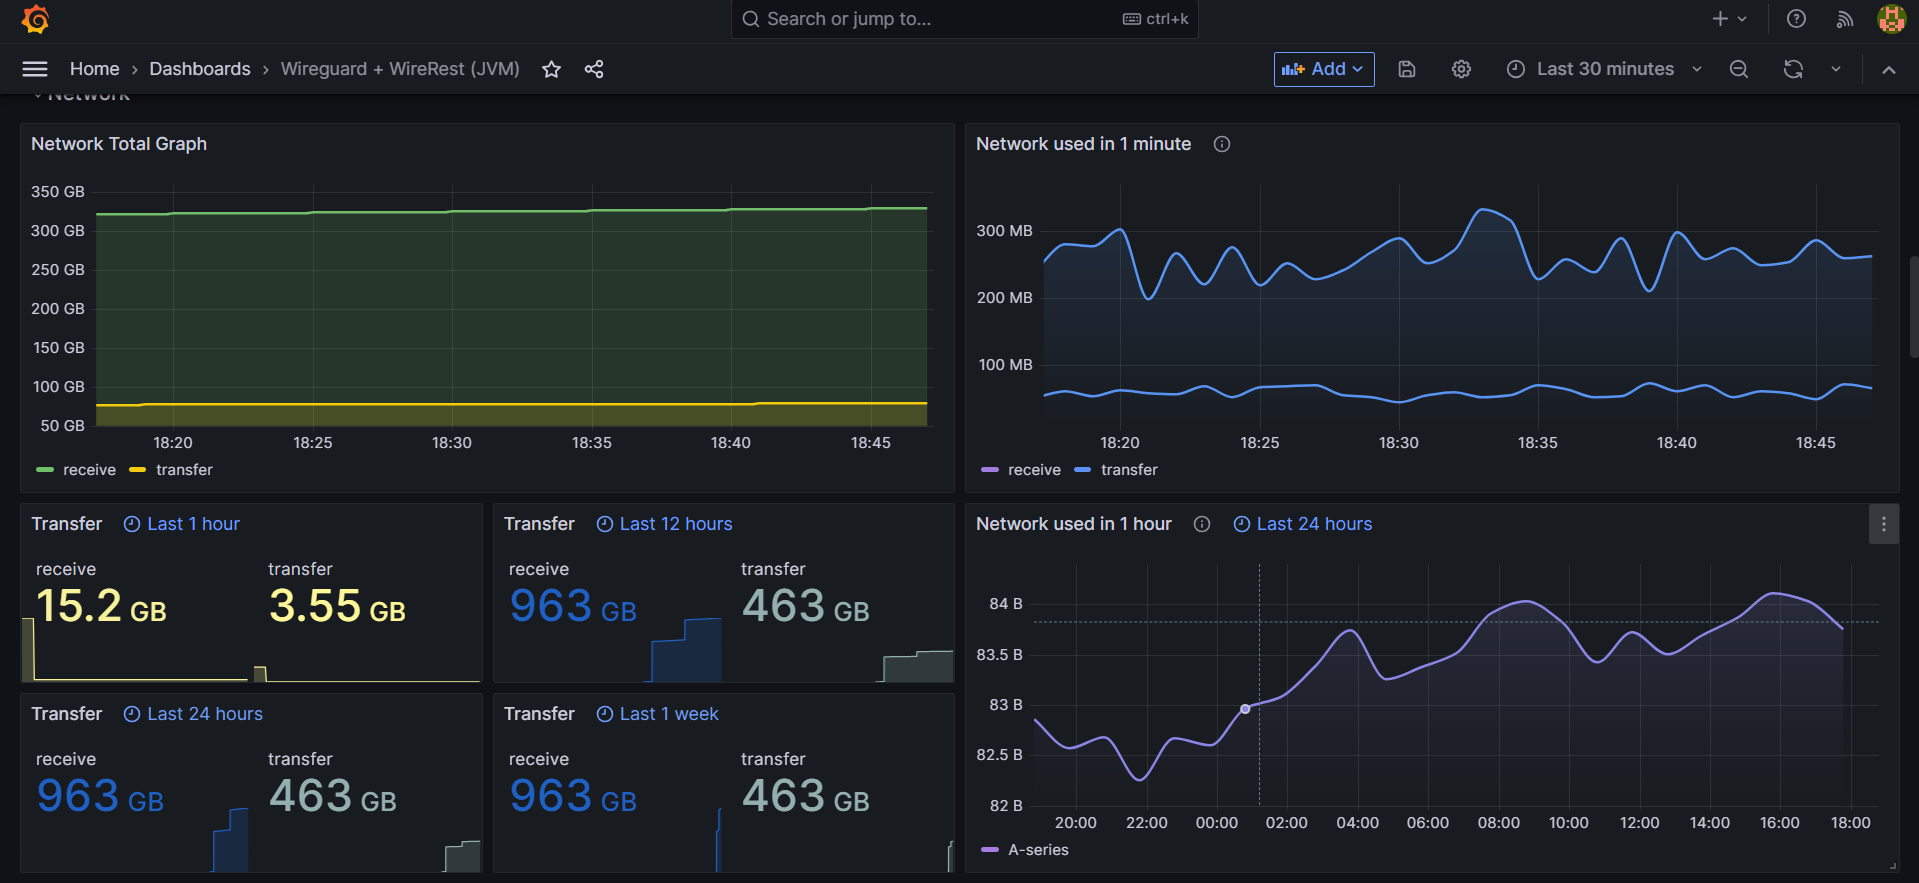
- How much traffic wireguard clients spend
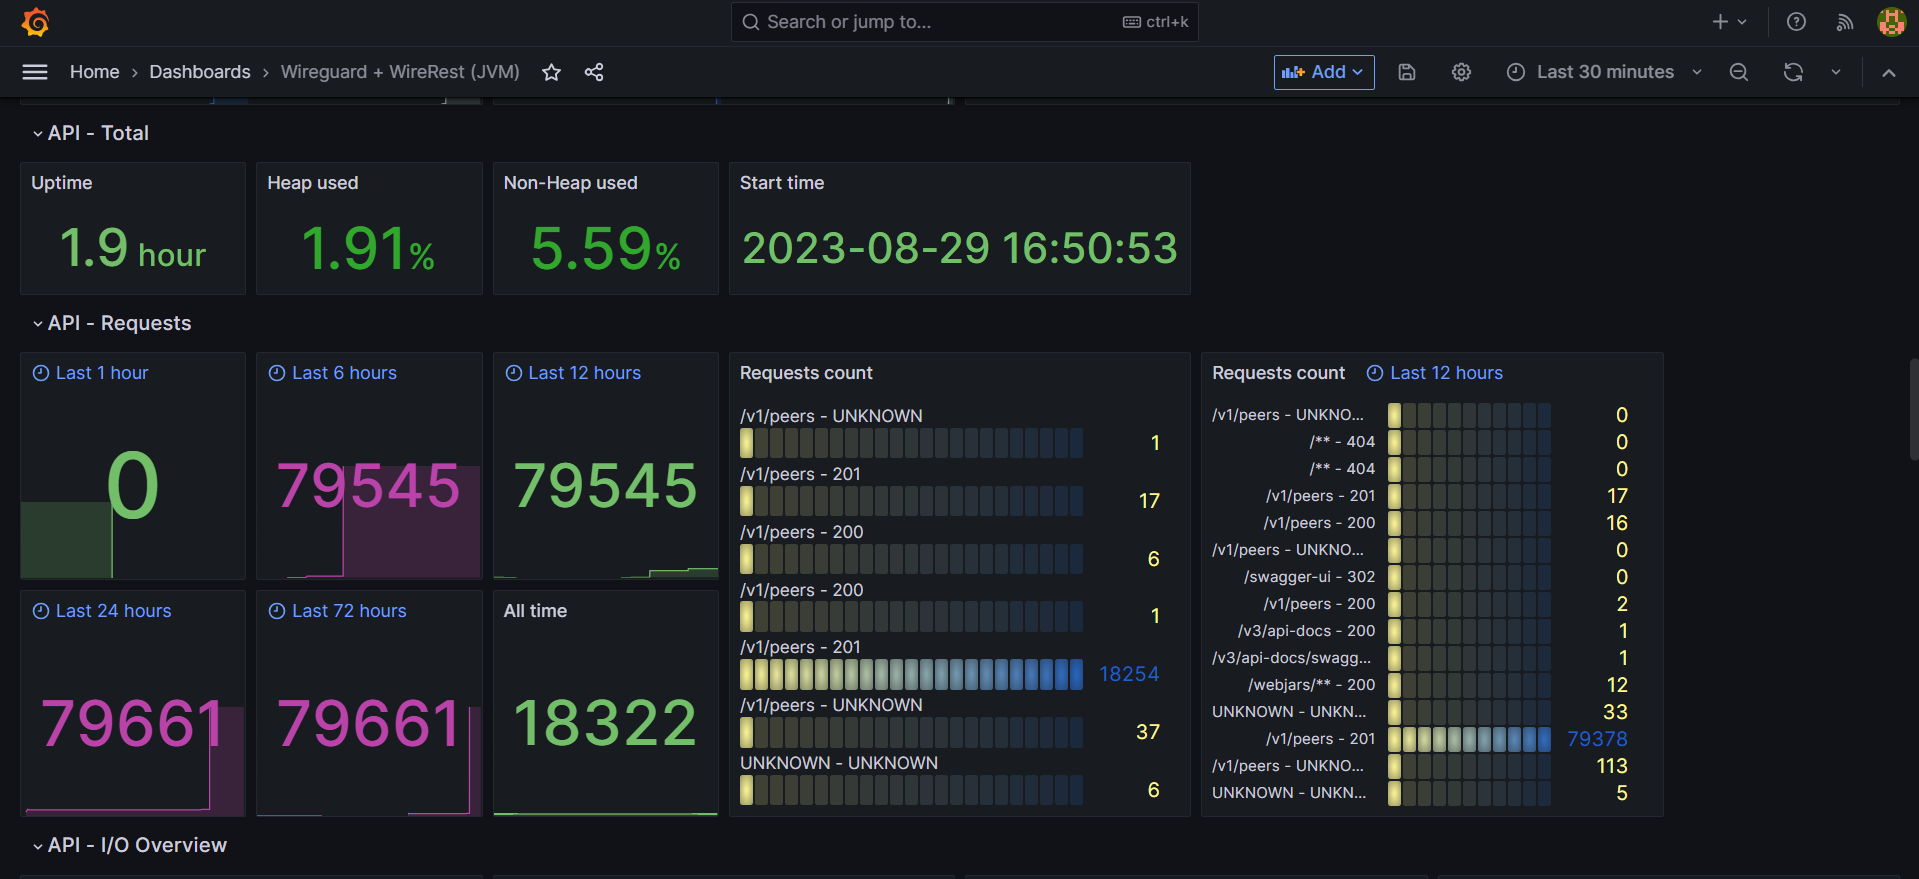
- WireRest API statistics
How to install:
Install WireRest on your server (the same one running Wireguard) GUIDE
Connect Prometheus to your WireRest
Example
  - job_name: 'wirerest-demo'
    scrape_interval: 5s
    metrics_path: '/actuator/prometheus'
    authorization:
        credentials_file: '/PATH/TO/FILE/WITH/ACCESS_TOKEN'
    static_configs:
      - targets: ['WIREREST_URL:8081']
Do not forget create file with access token or disable it. The file must be accessible by the user prometheus. Default token is "admin" About token
You can check the availability of WireRest as follows:
curl http://127.0.0.1:8081/actuator/prometheus?token=<YOUR_TOKEN>
- Install dashboard
Done!
if you find bugs or have a suggestion for improvement, please write about it in Github issue
Data source config
Collector type:
Collector plugins:
Collector config:
Revisions
Upload an updated version of an exported dashboard.json file from Grafana
| Revision | Description | Created | |
|---|---|---|---|
| Download |