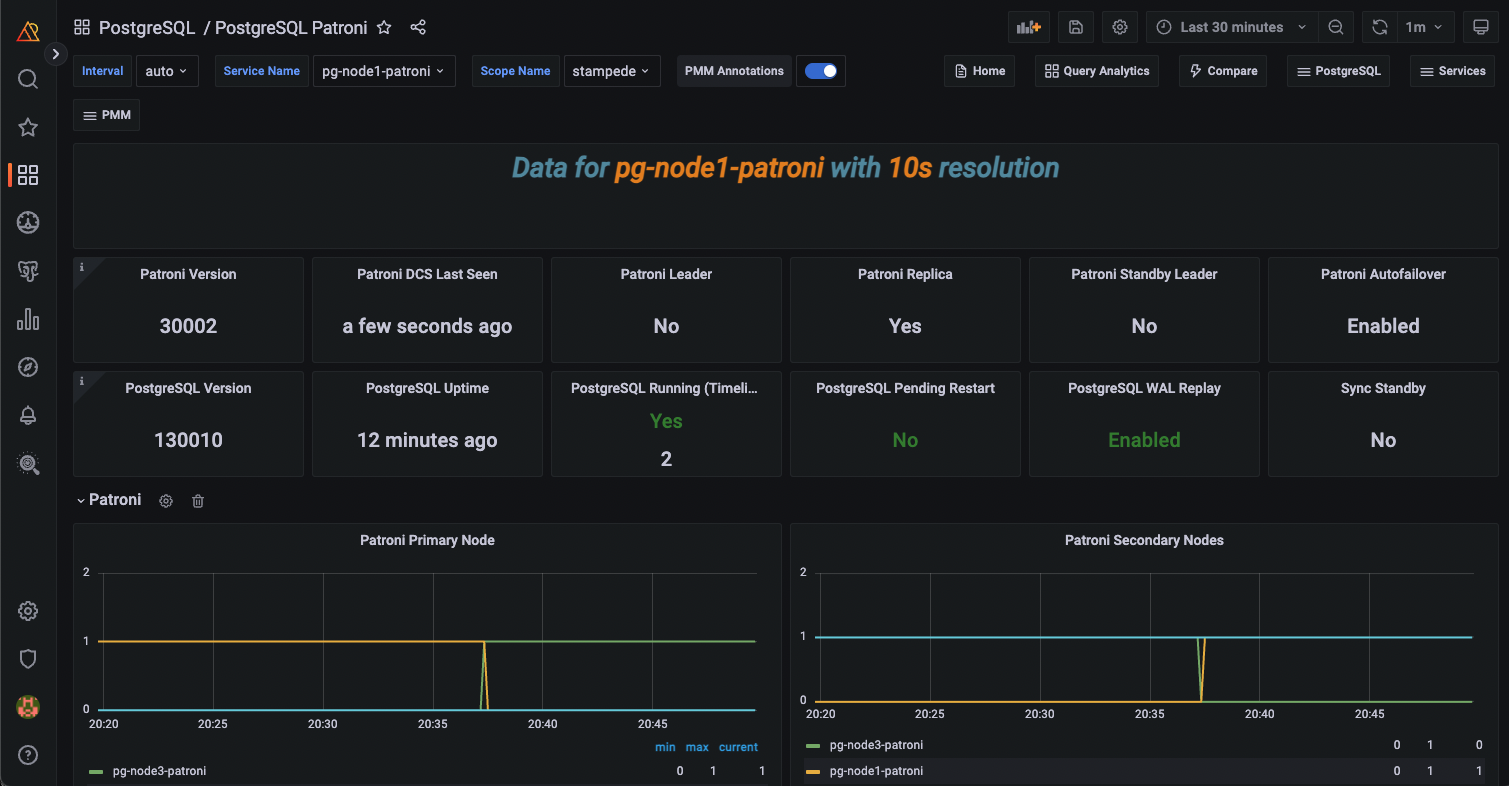
PostgreSQL Patroni
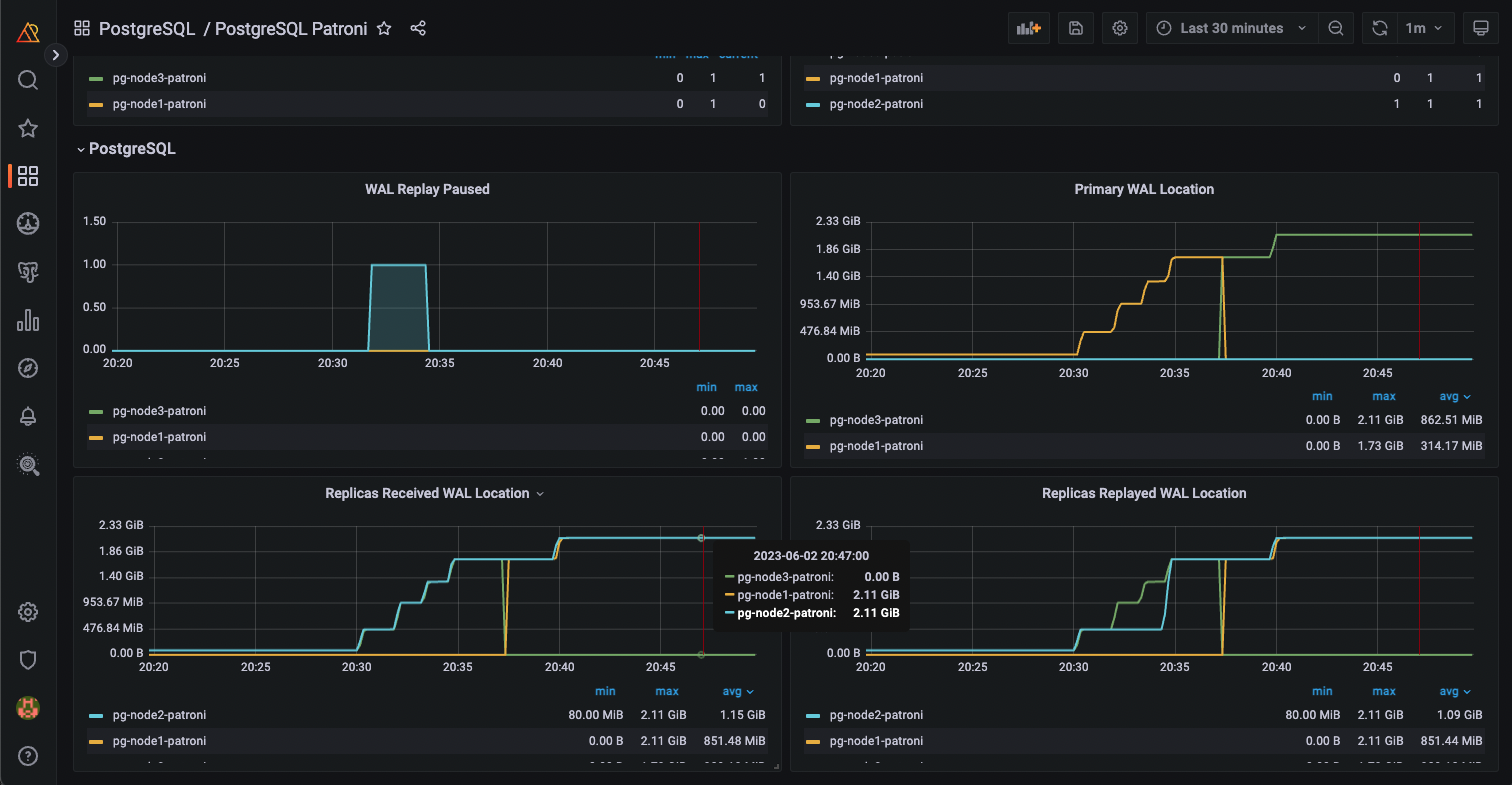
Patroni dashboard for use with Percona Monitoring and Management version 2.
This is a dashboard to view metrics exported by the Patroni /metrics endpoint available since v2.1.0: https://patroni.readthedocs.io/en/latest/releases.html#version-2-1-0
To add the metrics to PMM, simply go to the PMM client and execute a command like the following: pmm-admin add external --listen-port=8008 --service-name=pg-node1-patroni
Both Patroni and PMM client need to be running in the same node.
Data source config
Collector config:
Upload an updated version of an exported dashboard.json file from Grafana
| Revision | Description | Created | |
|---|---|---|---|
| Download |
PostgreSQL
Easily monitor your deployment of PostgreSQL, the open source relational database, with Grafana Cloud's out-of-the-box monitoring solution.
Learn more

