Synology SNMP
Dashboard for viewing Synology System Information using Prometheus and SNMP_Exporter
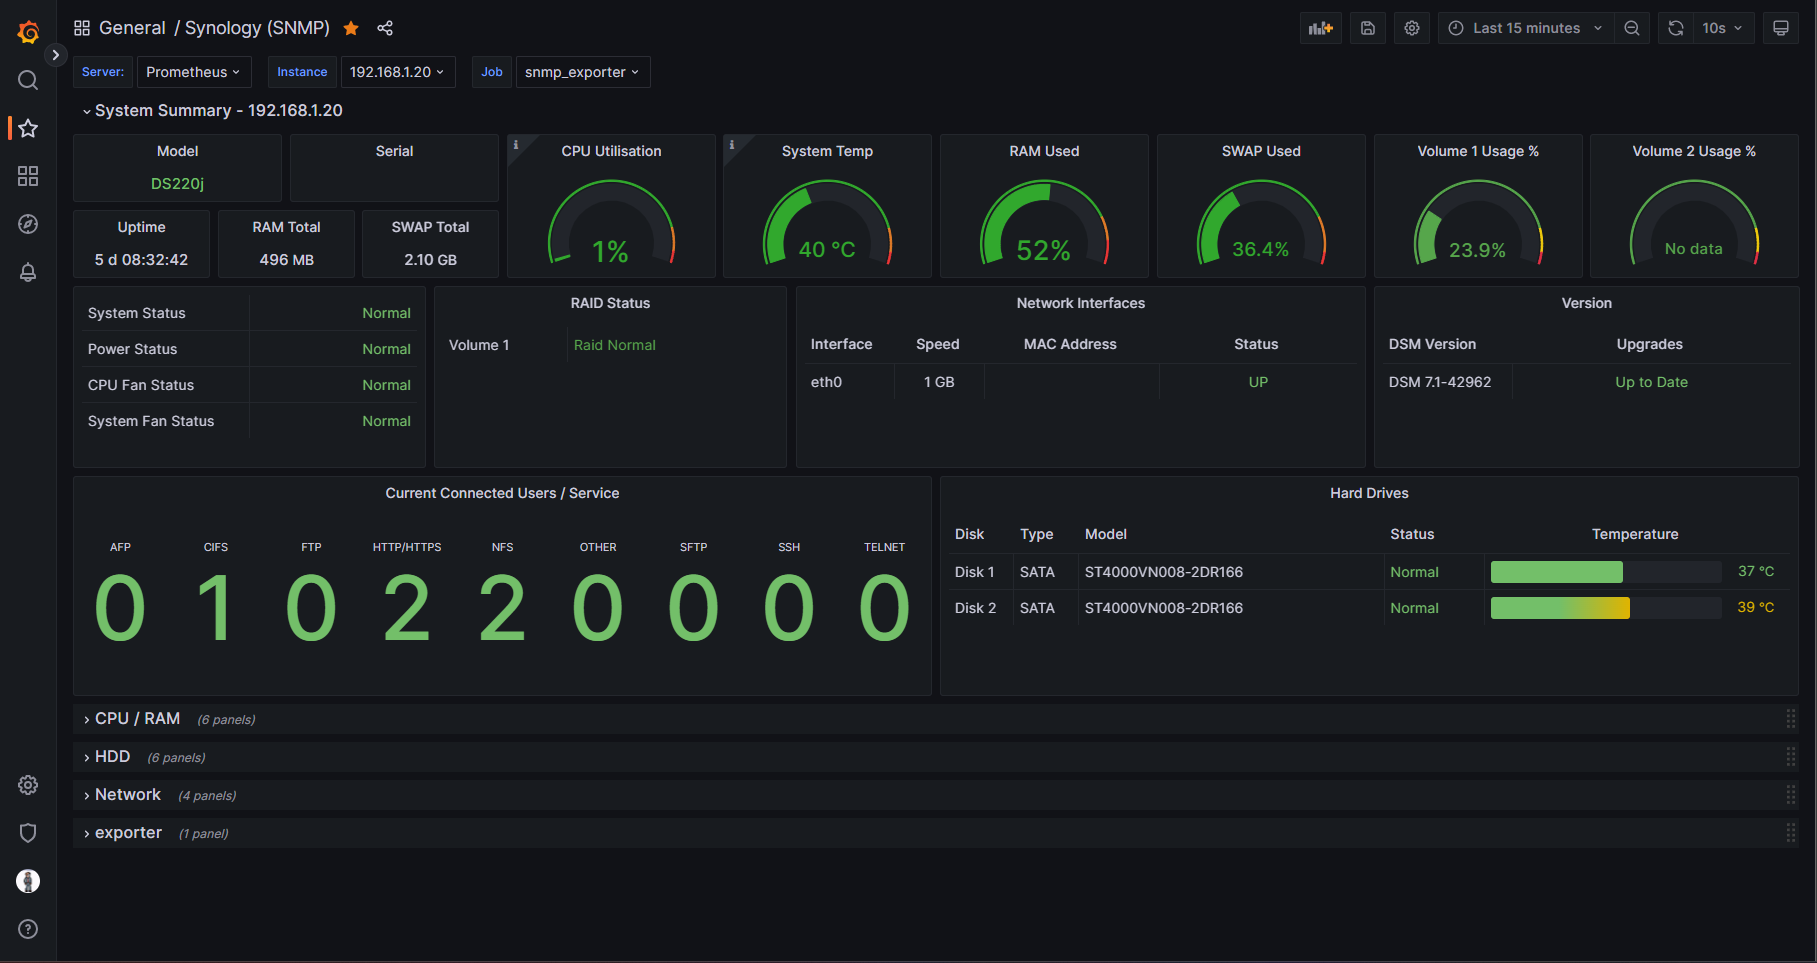
A simple Synology dashboard that uses SNMP data only.
Without the need for using containers such as Cadvisor or Node_Exporter, this dashboard is able to run on J series Synology NAS devices that cannot run Docker. The example screenshots are of this dashboard viewing statistics on a Synology 220j.
Please check out the SNMP_Exporter Github repository below for instructions on how to set up the exporter service in Docker on a server that is on the same network as the NAS. The repository has an snmp.yml file that has been customised for Synology so this dashboard can run.
https://github.com/clralab/boilerplates/tree/main/docker-compose/snmp_exporter
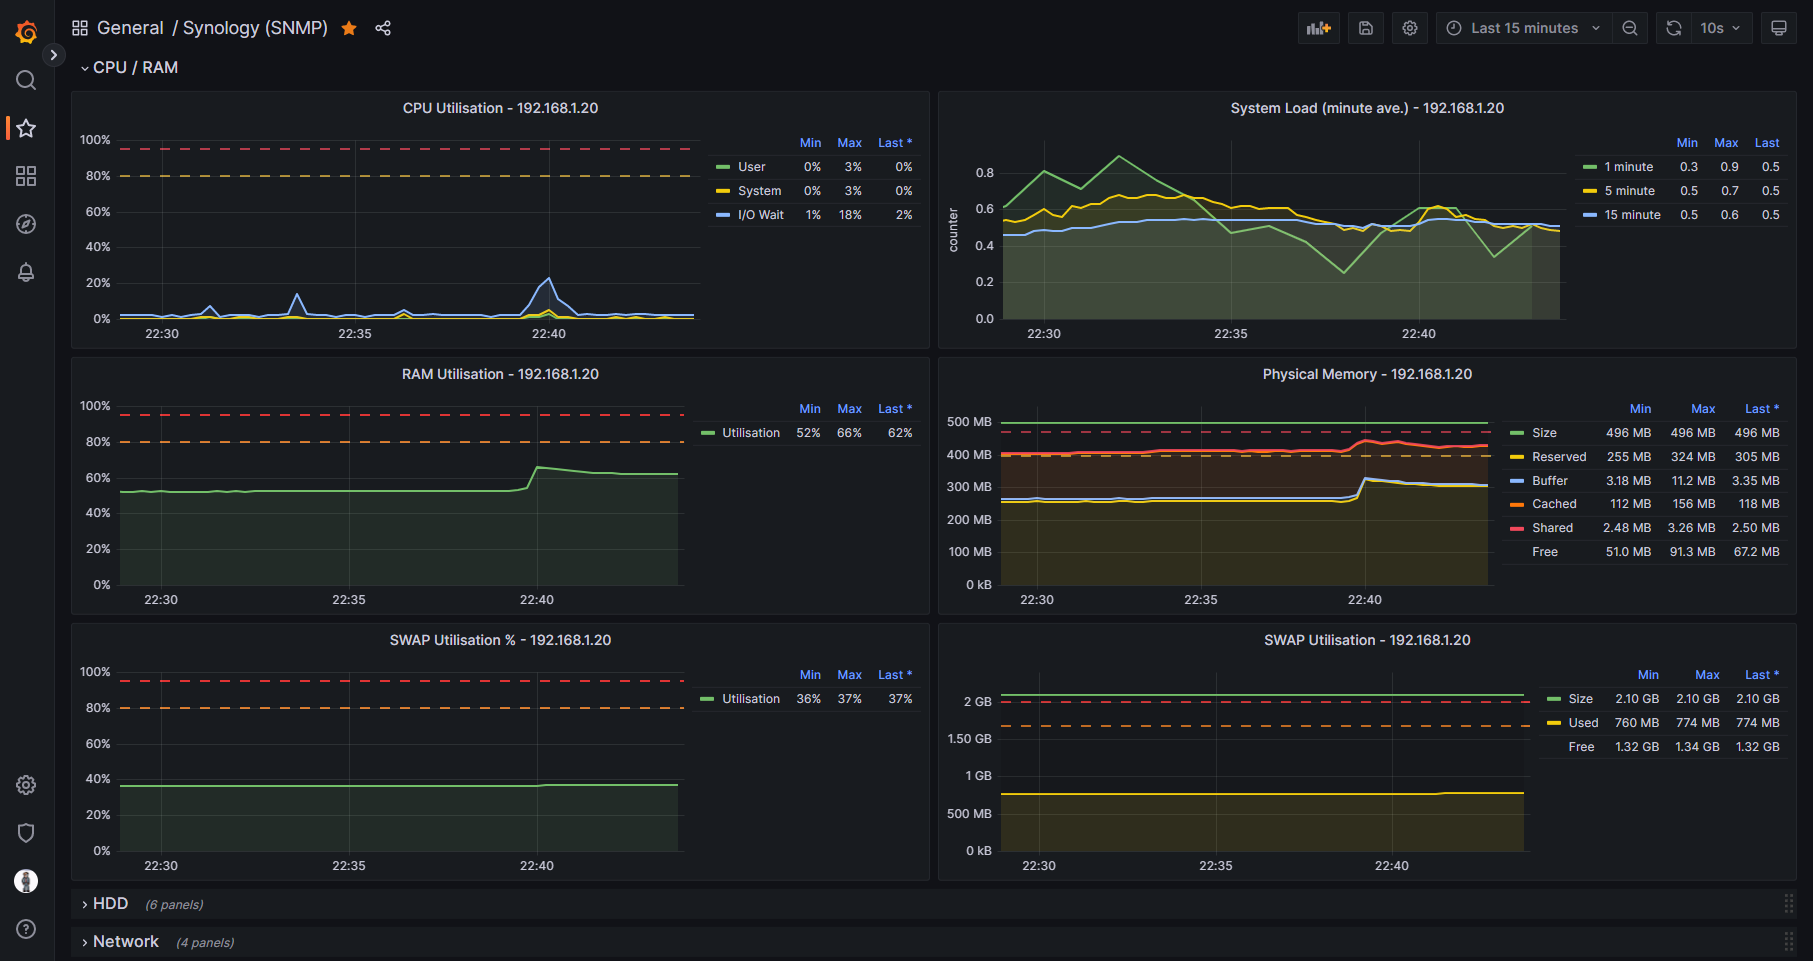
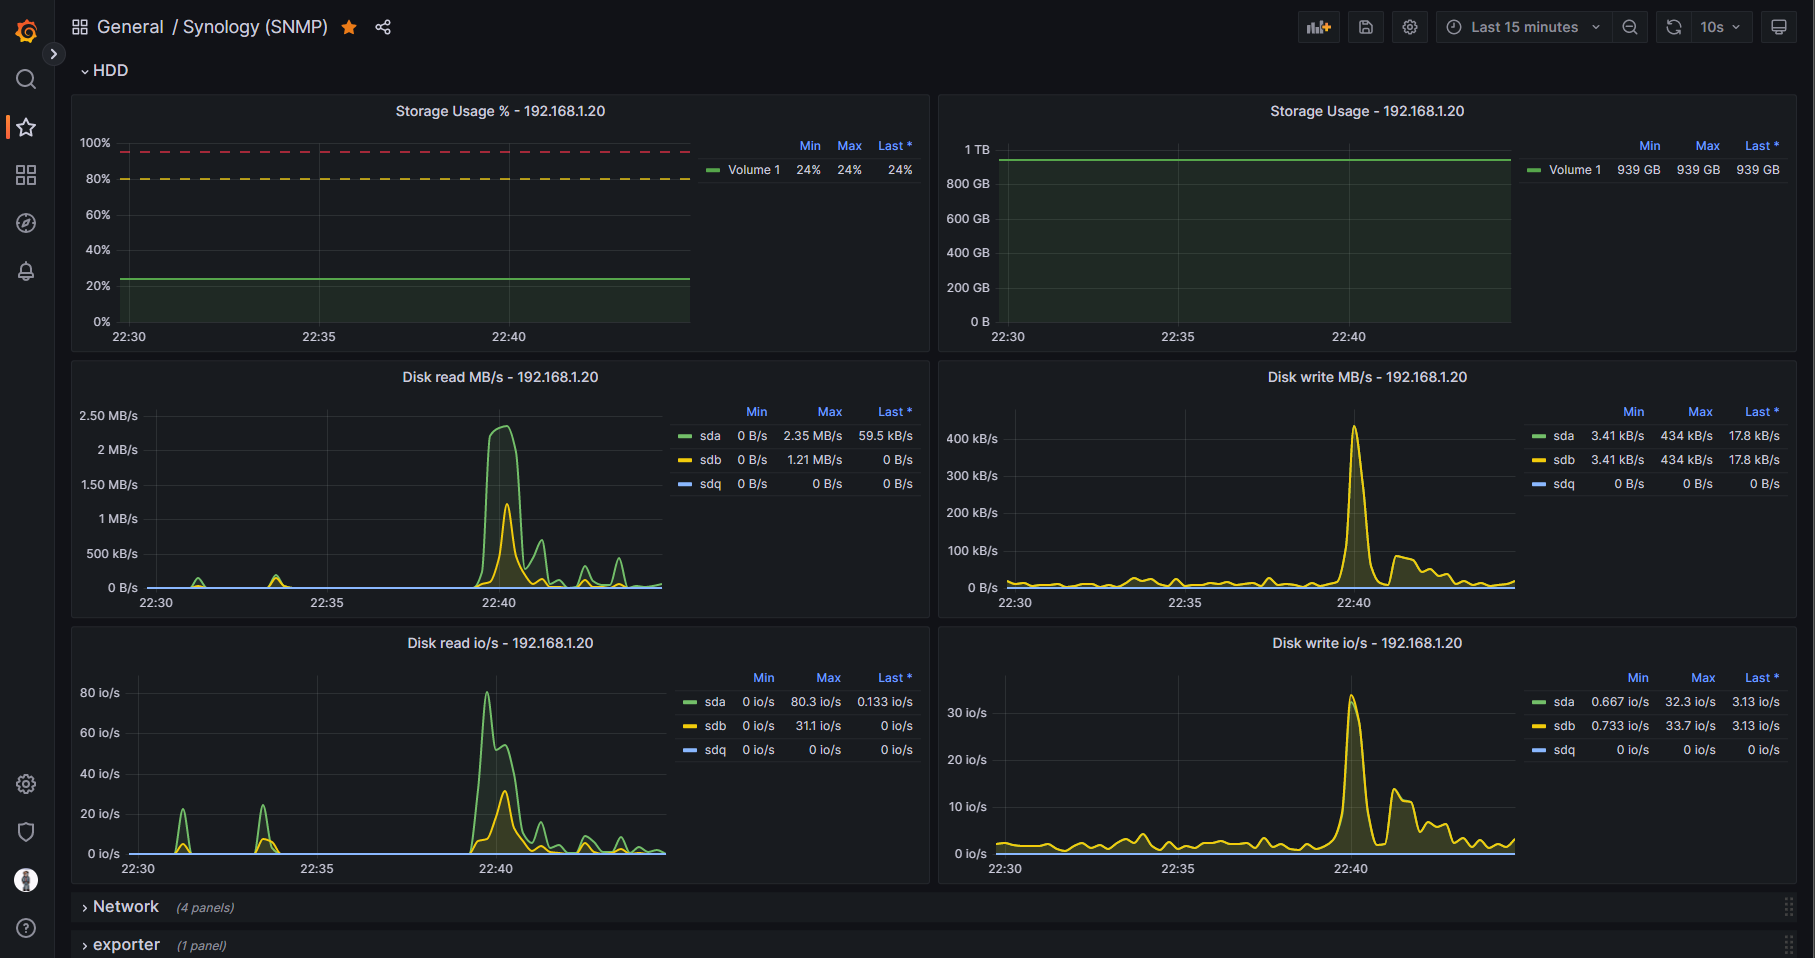
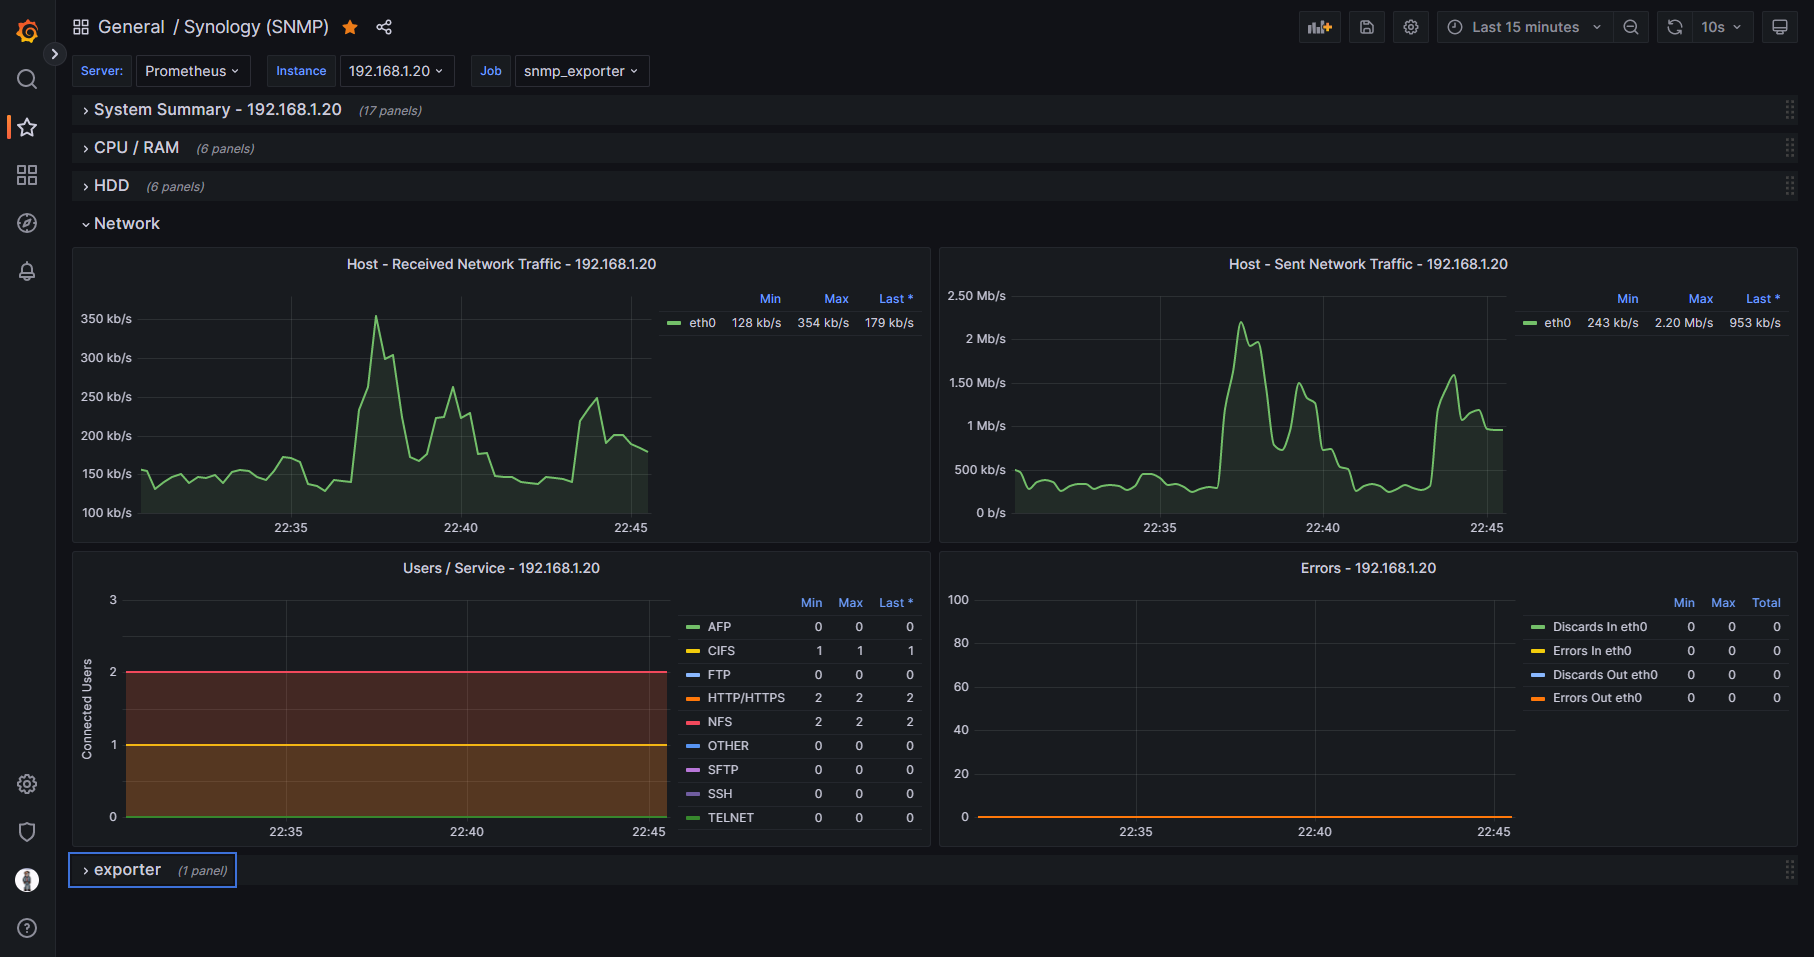
The dashboard includes basic metrics of CPU, RAM, HDD, and Network usage.
Data source config
Collector config:
Upload an updated version of an exported dashboard.json file from Grafana
| Revision | Description | Created | |
|---|---|---|---|
| Download |
SNMP
Easily monitor any generic SNMP (Simple Network Management Protocol) device with Grafana Cloud's out-of-the-box monitoring solution.
Learn more


