
Go-Ethereum-By-Instance
A Prometheus metric dashboard for go-ethereum, supports all blockchains compatible with go-ethereum
When starting go-ethereum(aka: geth), it is necessary to add the --metrics and --metrics.expensive parameters. eg:
geth <other commands> --metrics --metrics.addr 127.0.0.1 --metrics.port 6060 --metrics.expensive
Prometheus collects metrics using the following method:
    - job_name: 'go-ethereum'
      scrape_interval: 10s
      metrics_path: /debug/metrics/prometheus
      static_configs:
        - targets:
            - '127.0.0.1:6060'
          labels:
            chain: ethereum
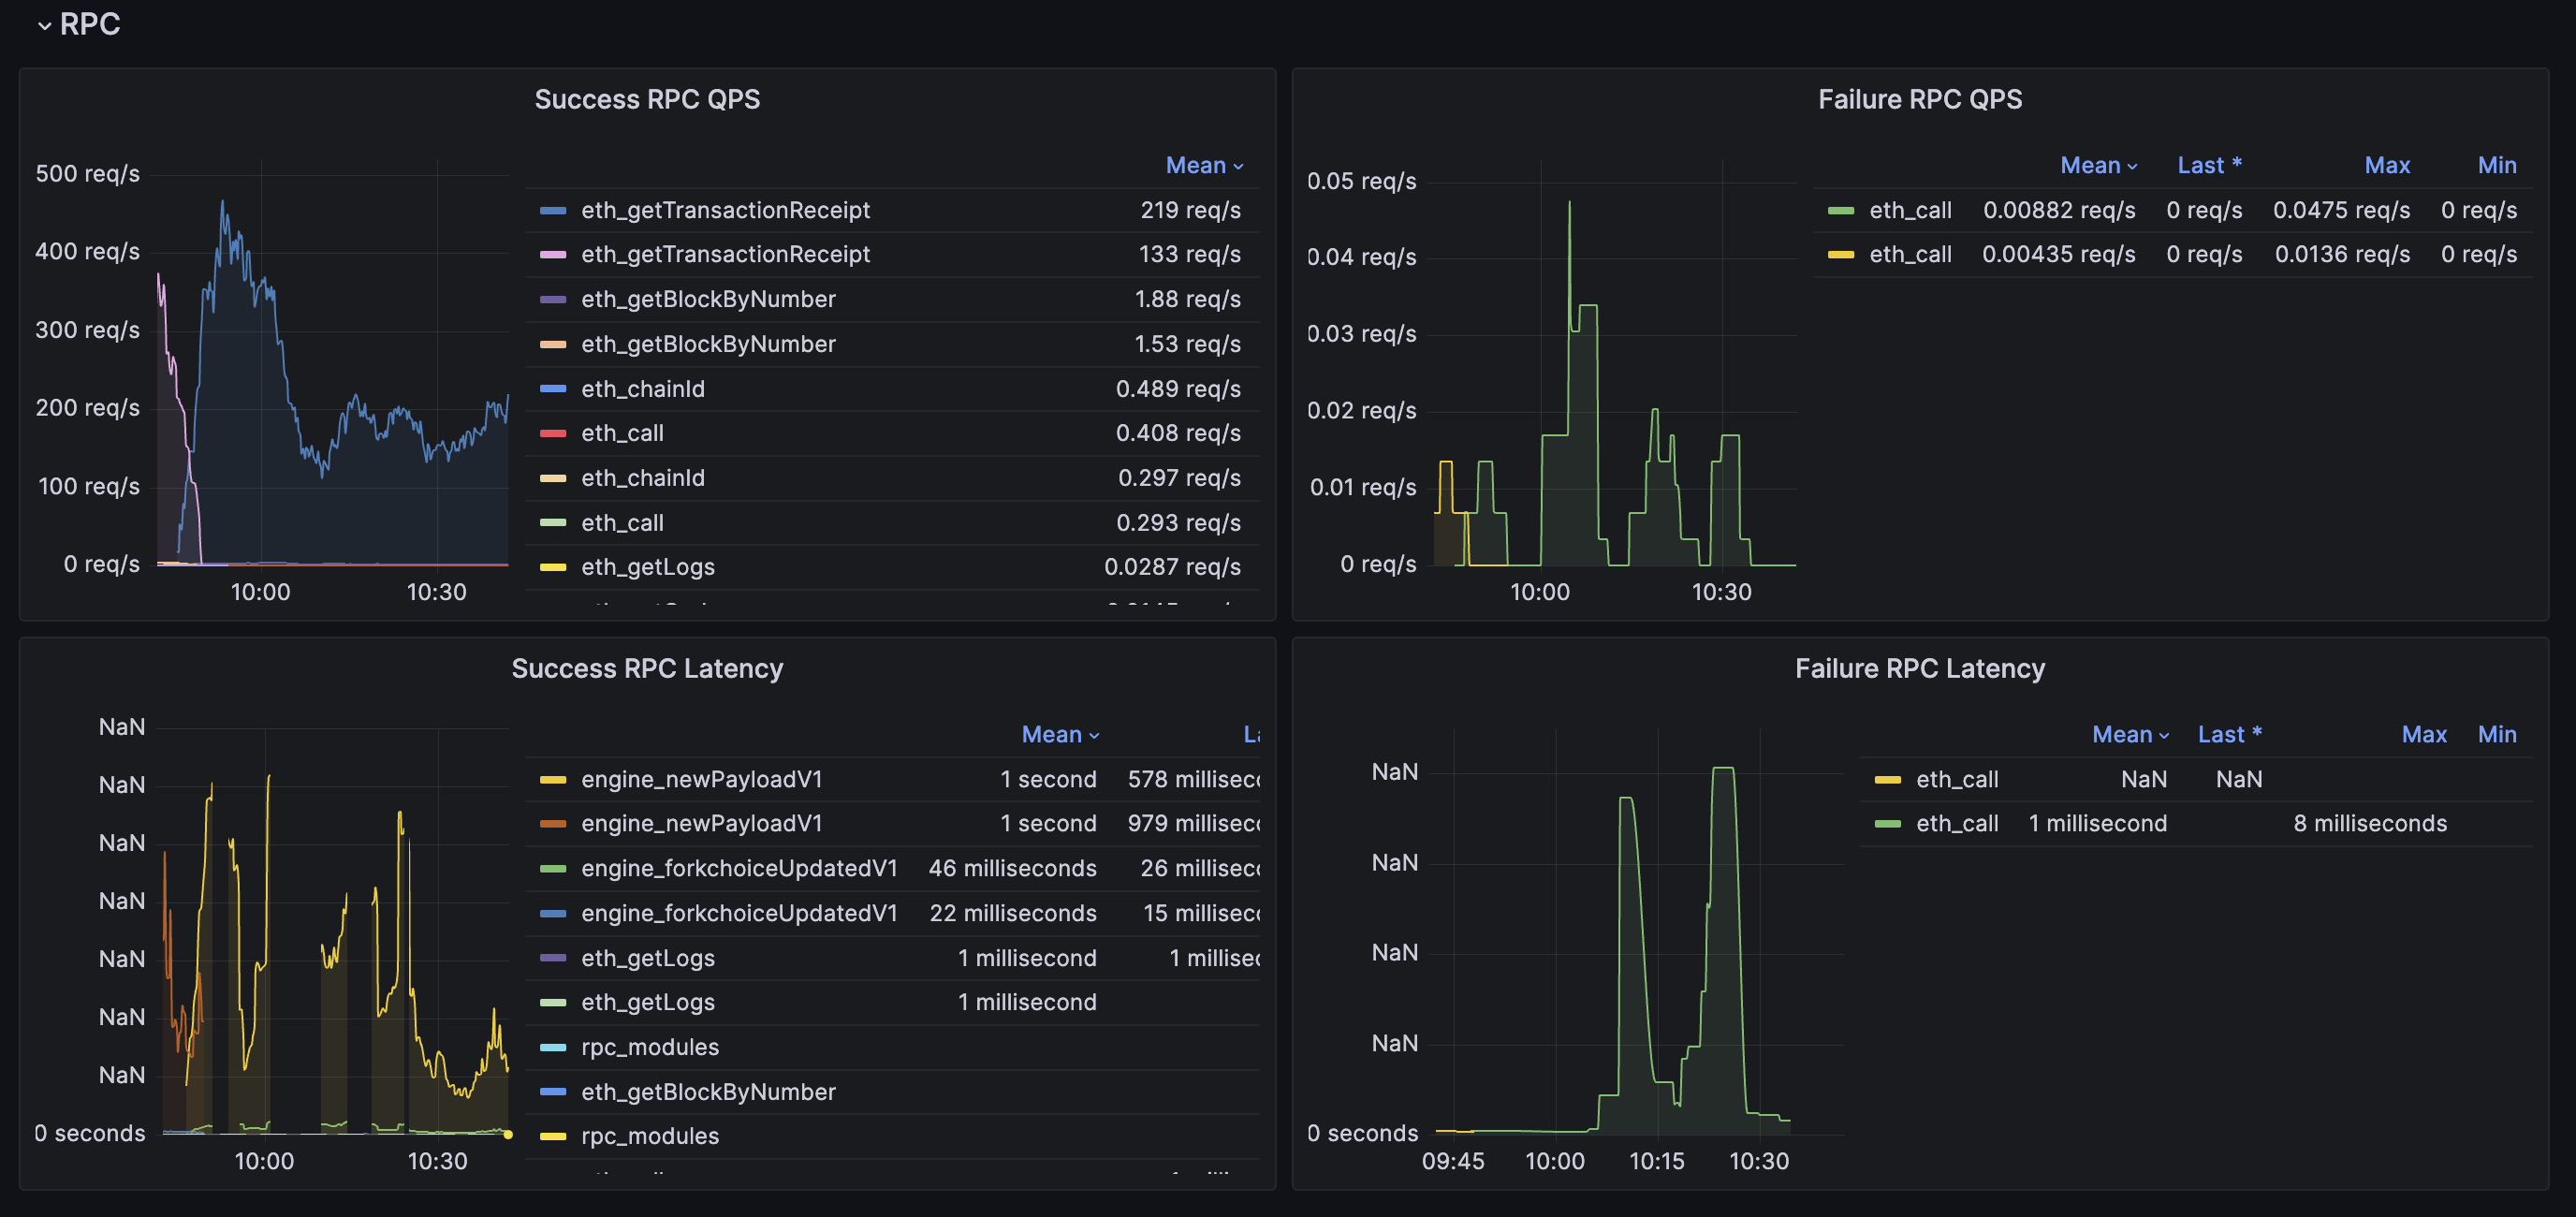
And If you need to collect rpc related metrics, add a Prometheus recording rule as below:
  groups:
    - name: geth_rpc_requests_rules
      rules:
        - expr: label_replace({__name__=~"rpc_duration_.*_success"}, "method", "$1", "__name__", "rpc_duration_(.+)_success")
          record: geth_rpc_requests_success
        - expr: label_replace({__name__=~"rpc_duration_.*_failure"}, "method", "$1", "__name__", "rpc_duration_(.+)_failure")
          record: geth_rpc_requests_failure
    - expr: label_replace({__name__=~"rpc_duration_.*_success_count"}, "method", "$1", "__name__", "rpc_duration_(.+)_success_count")
      record: geth_rpc_requests_success_count
    - expr: label_replace({__name__=~"rpc_duration_.*_failure_count"}, "method", "$1", "__name__", "rpc_duration_(.+)_failure_count")
      record: geth_rpc_requests_failure_count
Data source config
Collector type:
Collector plugins:
Collector config:
Revisions
Upload an updated version of an exported dashboard.json file from Grafana
| Revision | Description | Created | |
|---|---|---|---|
| Download |