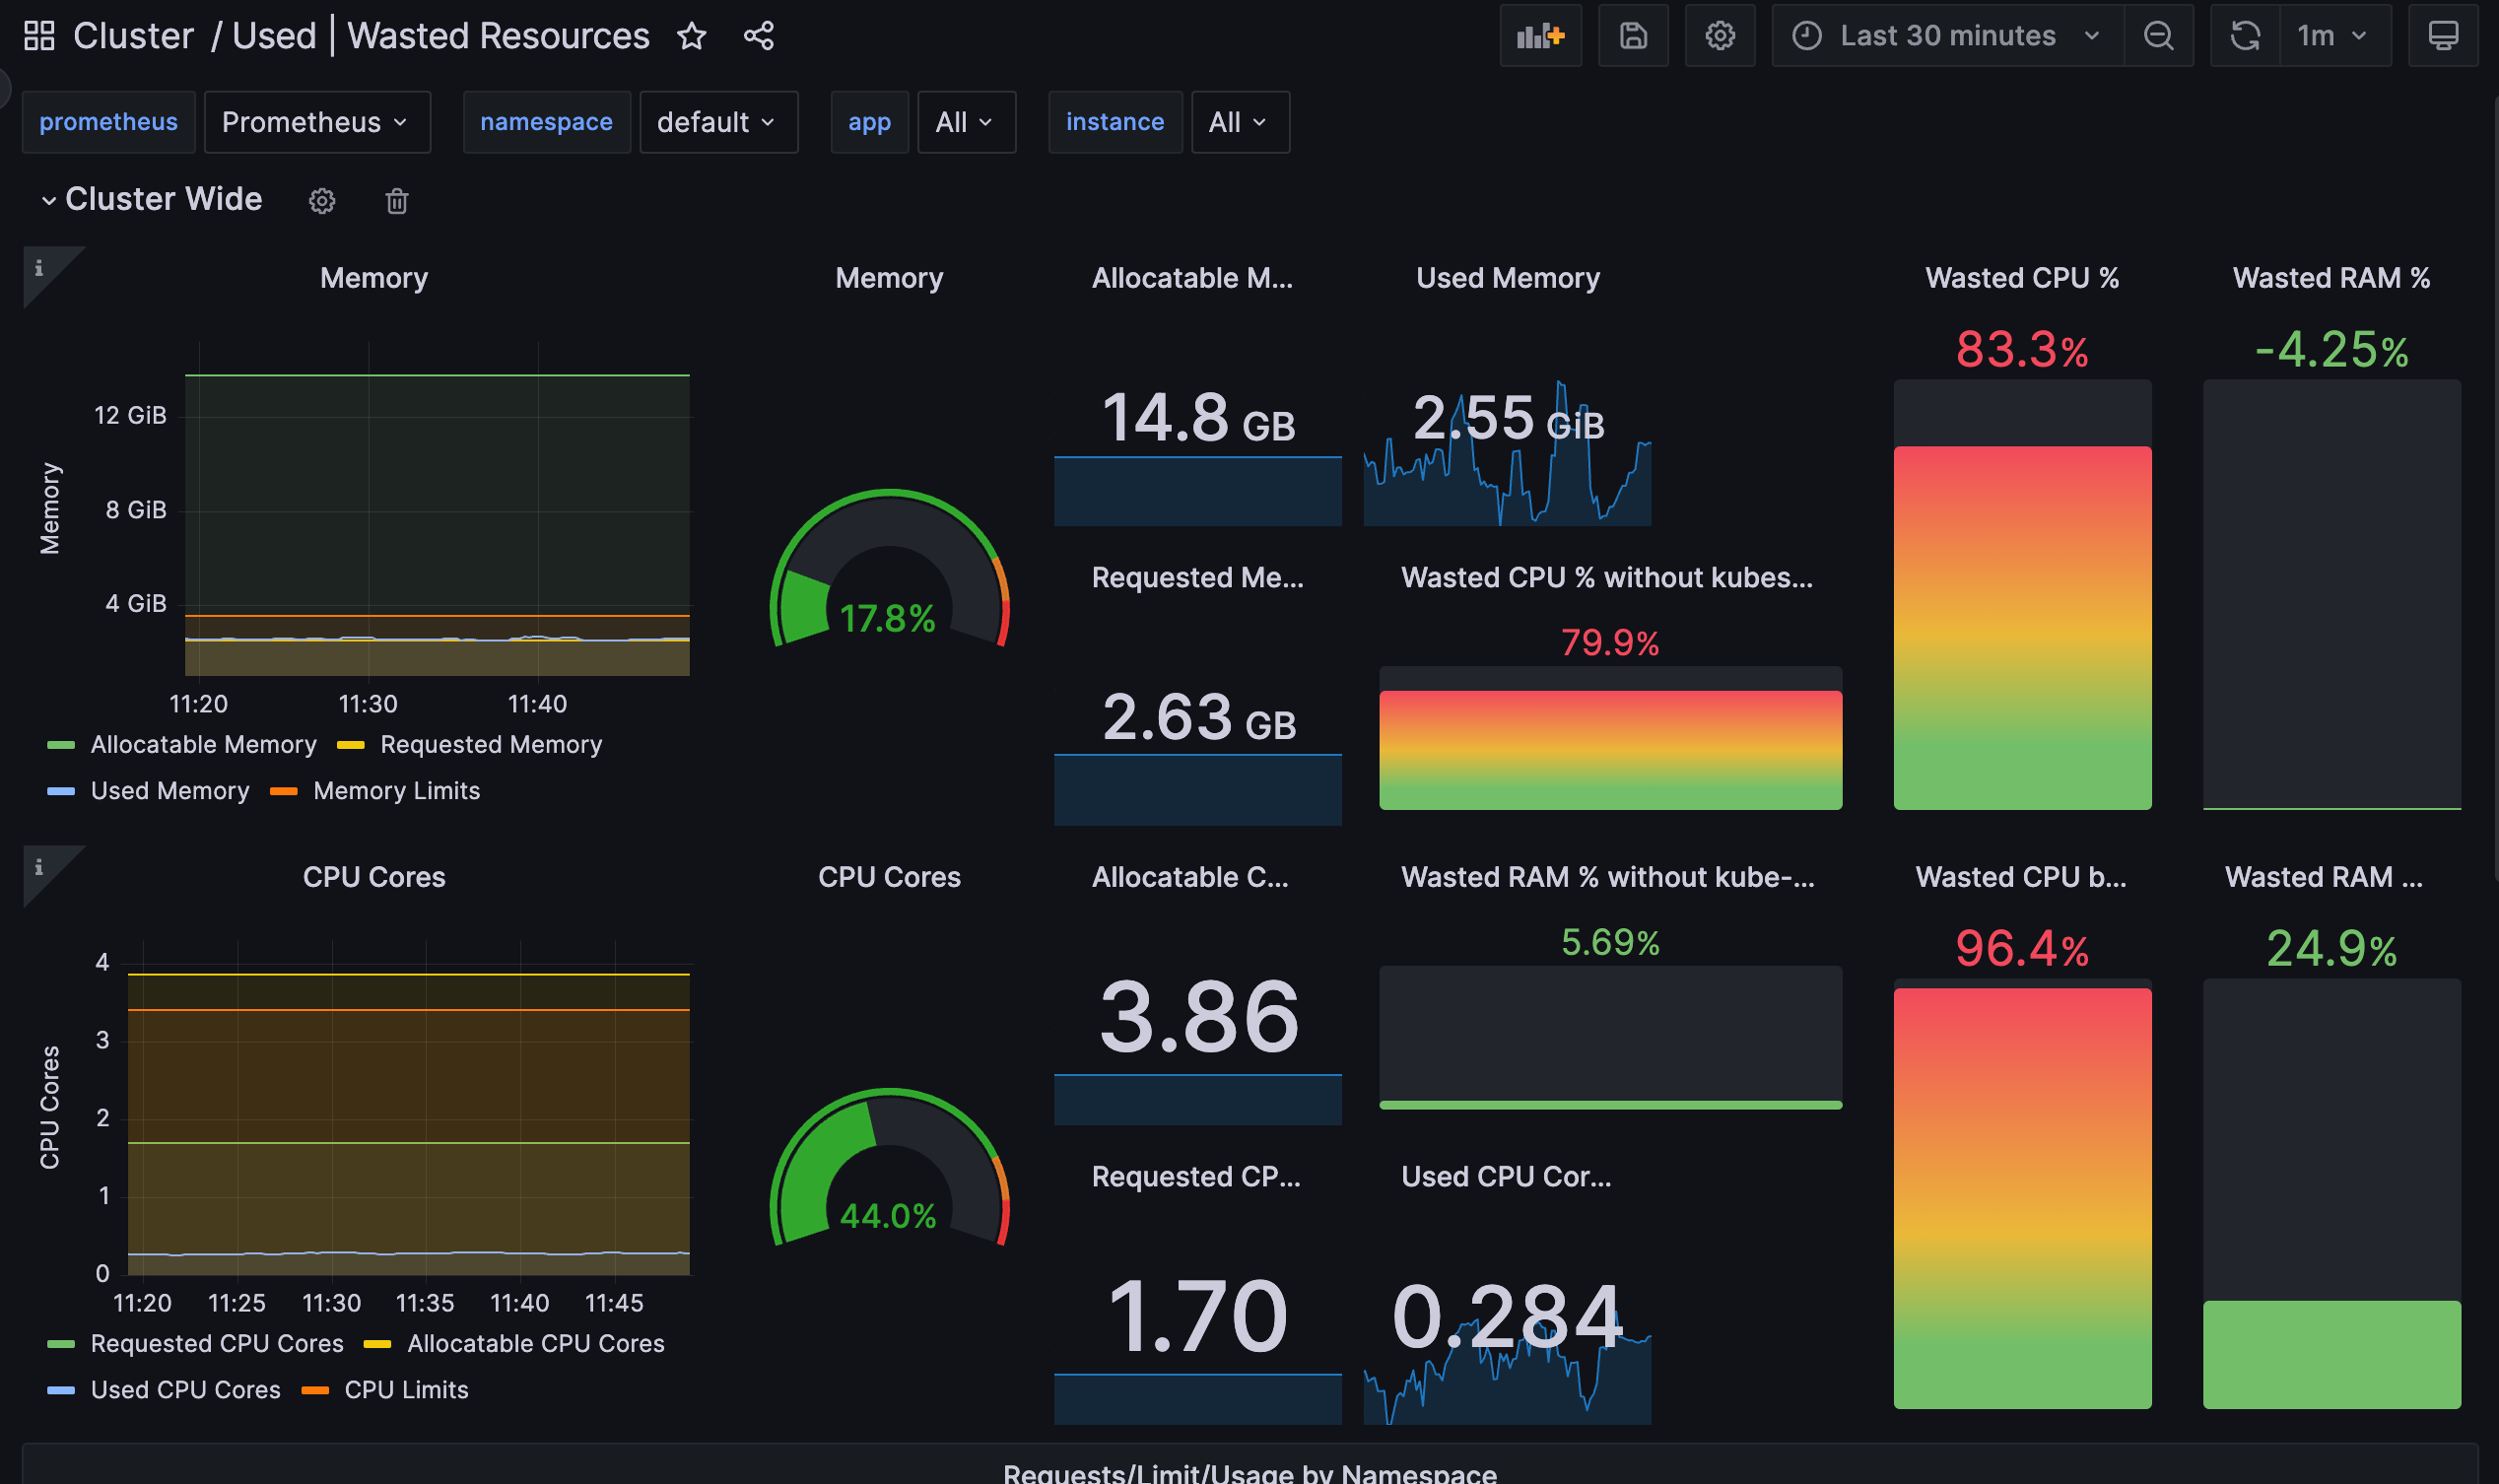
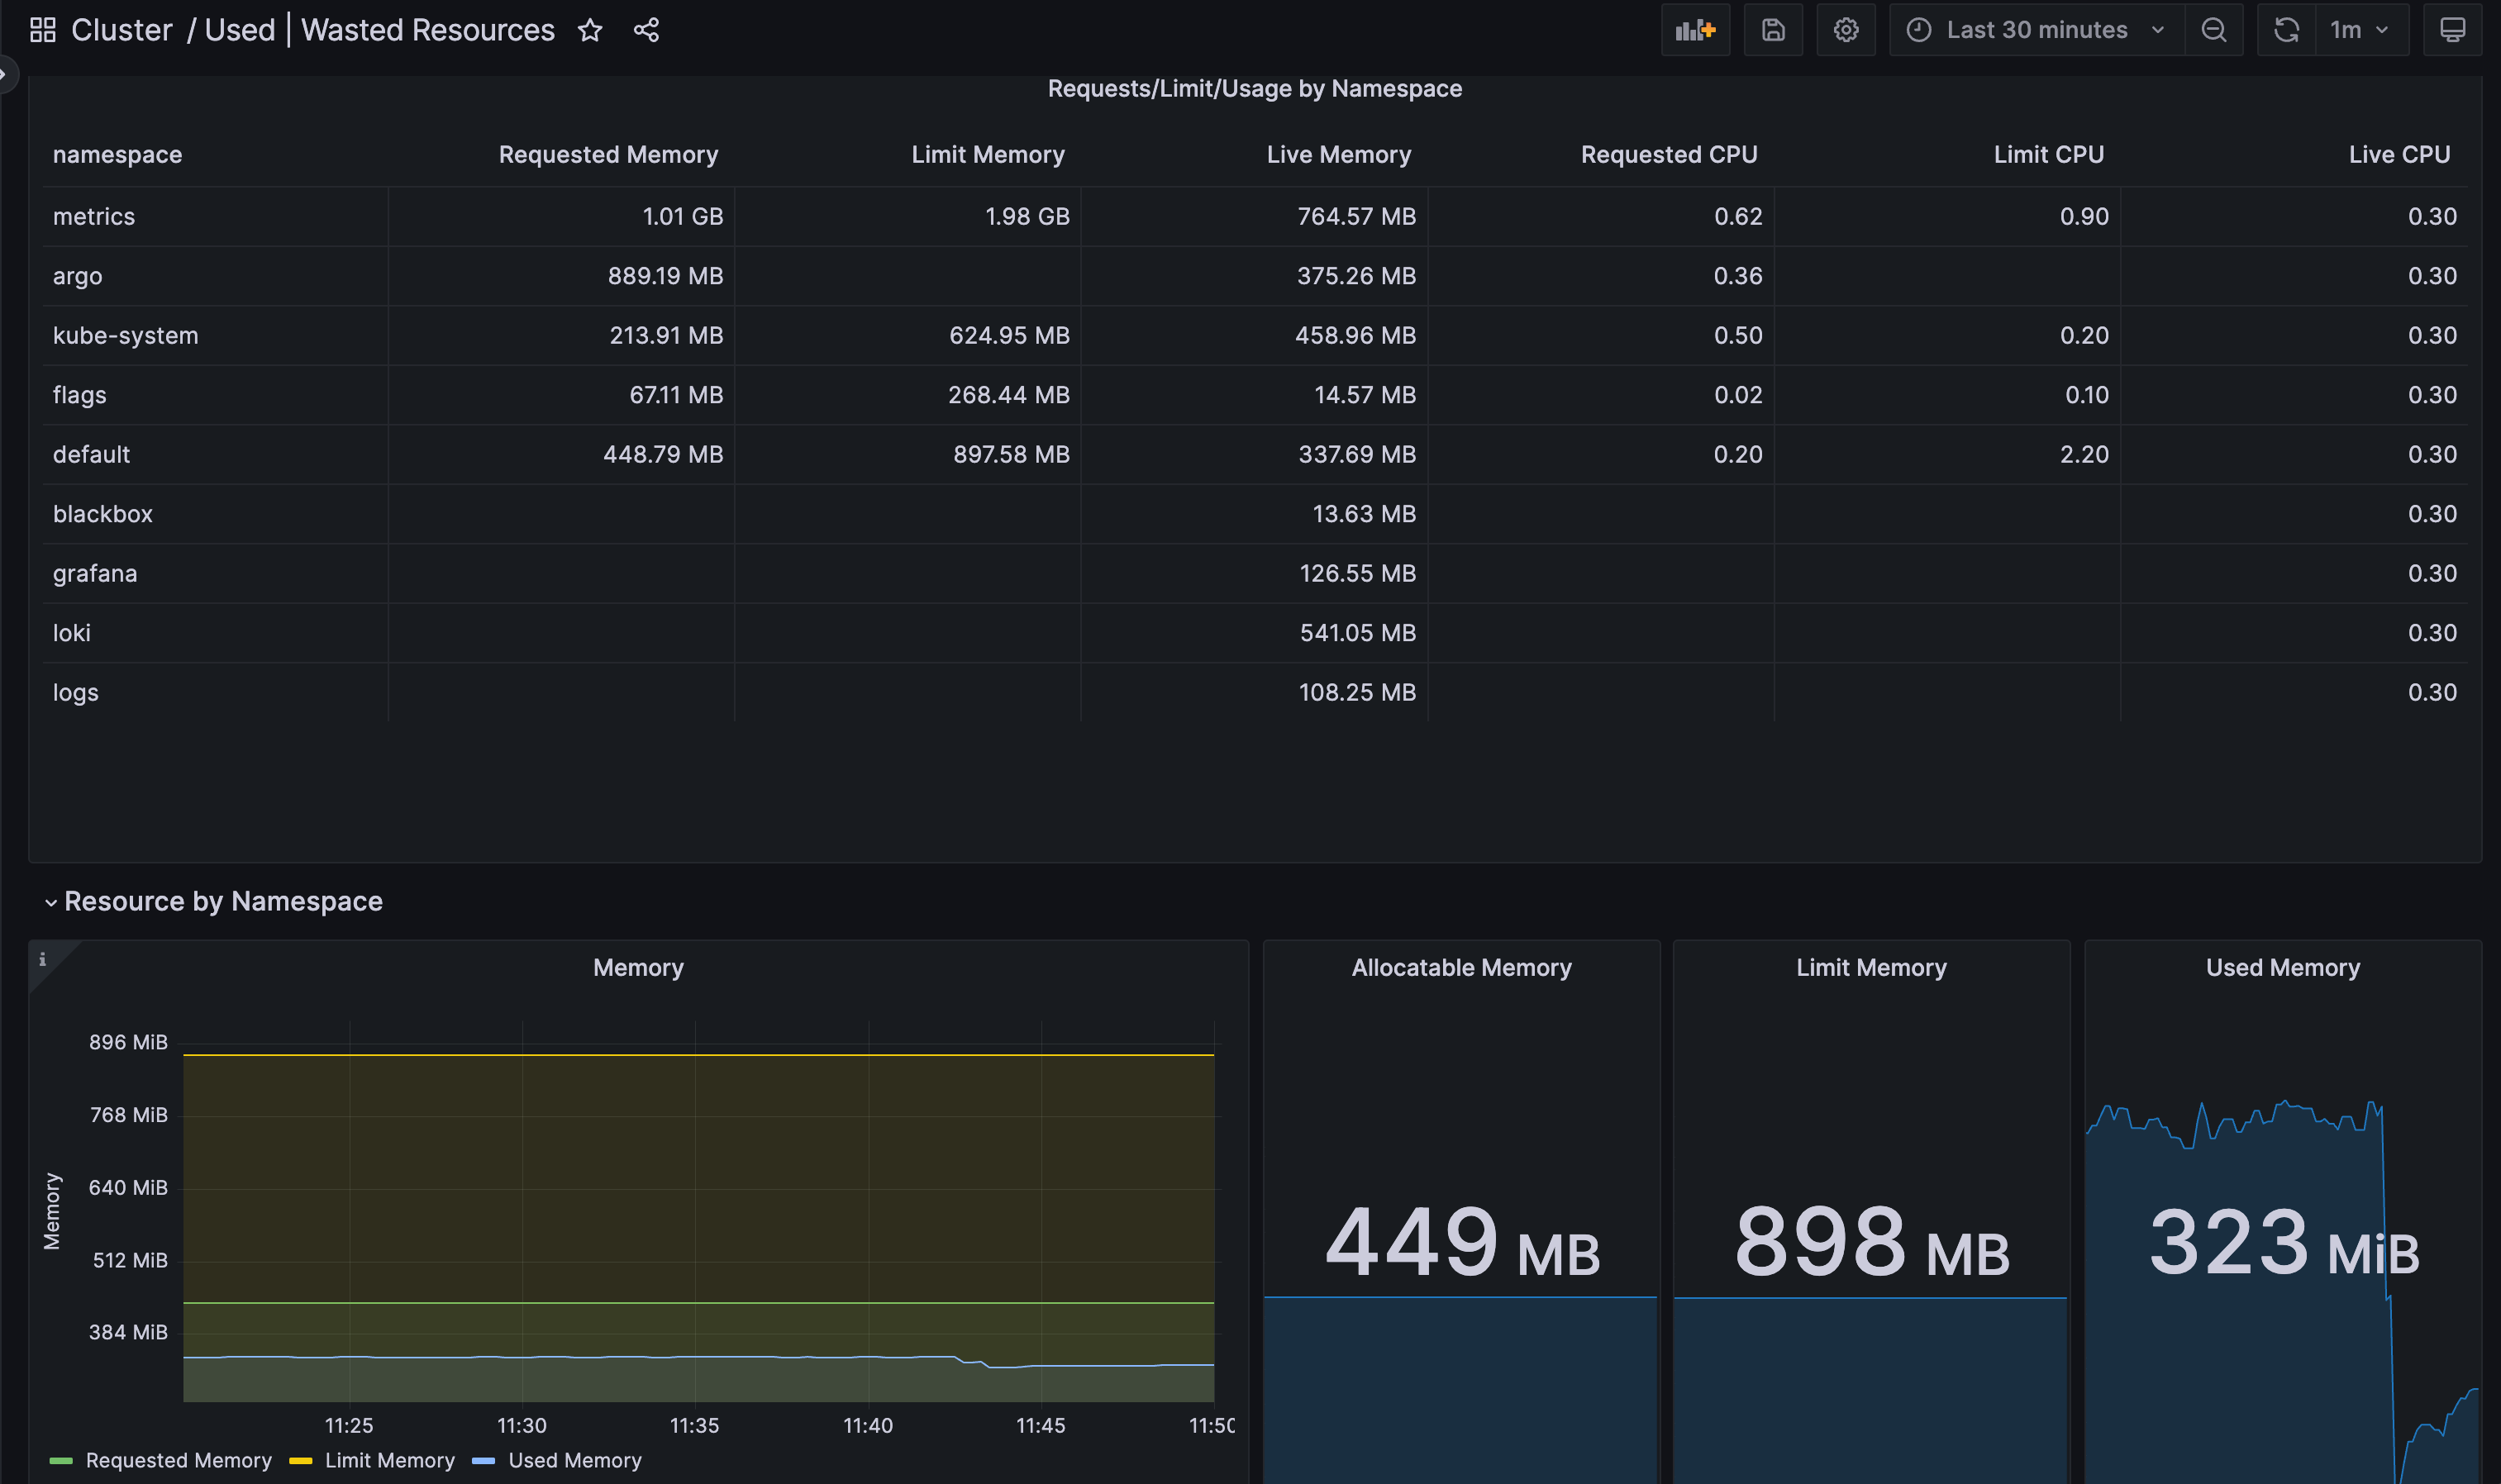
Used | Wasted Resources
Dashboard to show the resource requests vs allocatable in the cluster
Uses kube-prometheus-stack with node-exporter and kube-state-metrics
Data source config
Collector config:
Upload an updated version of an exported dashboard.json file from Grafana
| Revision | Description | Created | |
|---|---|---|---|
| Download |


